XAU/USD Intraday Plan | Support & Resistance to WatchGold is trading around 4121, consolidating after a modest recovery from the 4075 support zone. Price is currently caught between the MA50 and MA200, showing signs of indecision as buyers and sellers battle for short-term control.
While the broader uptrend remains structurally intact, short-term momentum is still bearish to neutral, with gold struggling to close above the 4151 resistance. A decisive break above 4151 could pave the way for a corrective rally toward 4192 and 4227, where the MA200 may act as dynamic resistance.
On the downside, if gold fails to hold above 4117, another retest of 4075 is likely. A clean break below this level could extend weakness into 4020, with 3984–3953 marking the deeper support base where dip-buyers are expected to become active again.
📌 Key levels to watch:
Resistance:
4151
4192
4227
4279
Support:
4117
4075
4044
4020
3984
🔎 Fundamental focus:
Even though gold is under short-term pressure, the overall trend is still healthy. Uncertainty in the global economy continues to support gold, and many traders see price drops toward key support levels as good buying opportunities.
Supportandresistancezones

XAU/USD Intraday Plan | Support & Resistance to WatchGold remains under downside pressure after failing to hold above the 4151 resistance yesterday, with price now trading around 4104. The metal continues to trade below both the MA50 and MA200, confirming that short-term momentum remains bearish within a broader corrective phase.
If buyers can reclaim 4117 and 4151, a corrective bounce toward 4192 and 4227 may follow. However, failure to defend 4075 could trigger another wave of selling toward 4020, and potentially deeper into the 3984-3953 zone, where fresh demand could start building up.
📌 Key levels to watch:
Resistance:
4117
4151
4192
4227
Support:
4075
4044
4020
3984
🔎 Fundamental focus:
Gold continues to trade under macro uncertainty as the U.S. government shutdown drags on, delaying major data releases and weighing on investor confidence. The lack of economic transparency has led to erratic price swings, while persistent U.S.–China trade tensions and weaker manufacturing sentiment add further risk aversion.

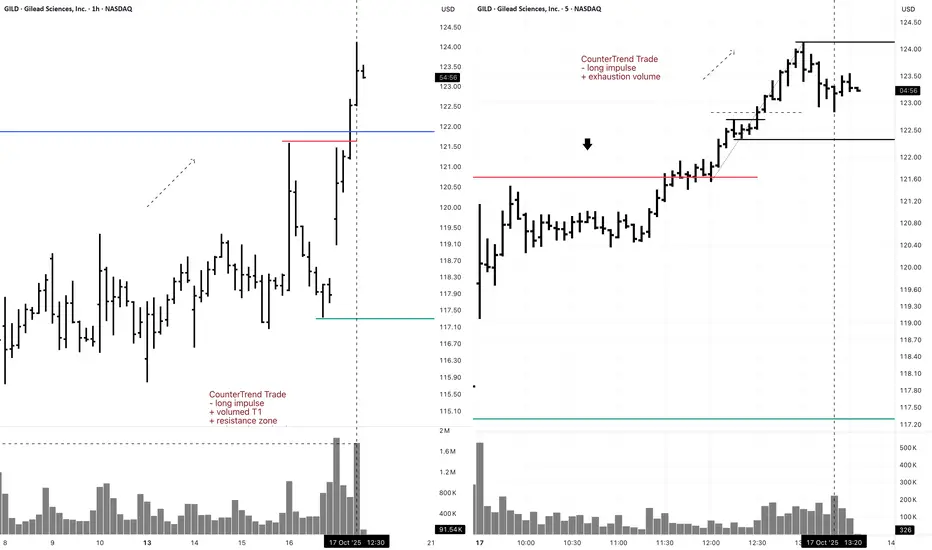
GILD 5M Short CounterTrend Daytrade (Buy Put to Open)5M CounterTrend Trade
- long impulse
+ exhaustion volume
1H CounterTrend
"- long impulse
+ volumed T1
+ resistance zone
+ volumed reaction bar"
1D CounterTrend
"- long impulse
- unvolumed T1
+ resistance level
+ volumed manipulation bar "
1M CounterTrend
"- long impulse
+ volumed T1 level
+ resistance zone"
1Y CounterTrend
"- long impulse
- unvolumed T1
+ resistance zone"
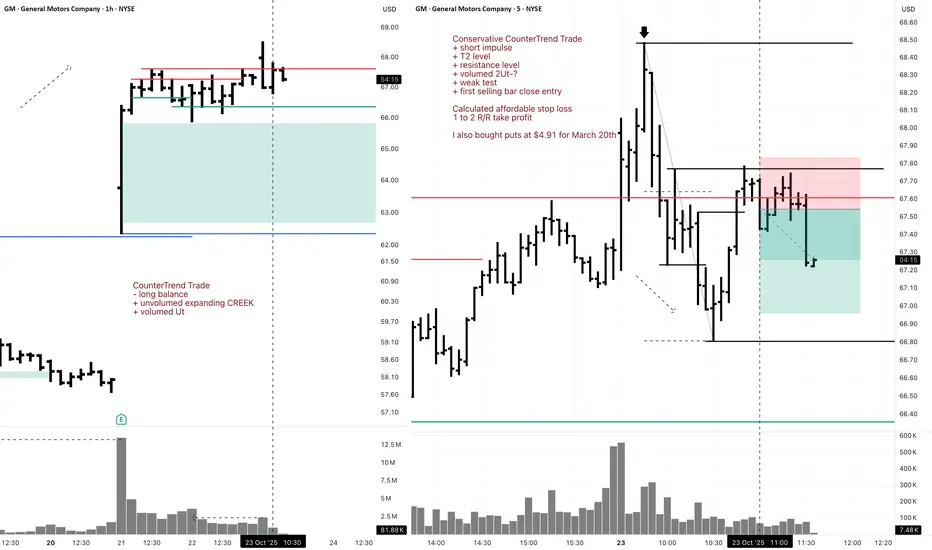
GM Short 5M DayTrade Conservative CounterTrend TradeConservative CounterTrend Trade
+ short impulse
+ T2 level
+ resistance level
+ volumed 2Ut-?
+ weak test
+ first selling bar close entry
Calculated affordable stop loss
1 to 2 R/R take profit
I also bought puts at $4.91 for March 20th
1H CounterTrade
"- long balance
+ unvolumed expanding CREEK
+ volumed Ut"
1D CounterTrend
"- long impulse
- neutral zone
+ exhaustion volume?"
1M CounterTrade
"- long impulse
- unvolumed T1
+ resistance zone
+ volumed manipulation bar
- volumed reaction bar looks for break
- volume distribution is long"
1Y CounterTrend
"- long balance
+ expanding volumed CREEK
+ resistance level"
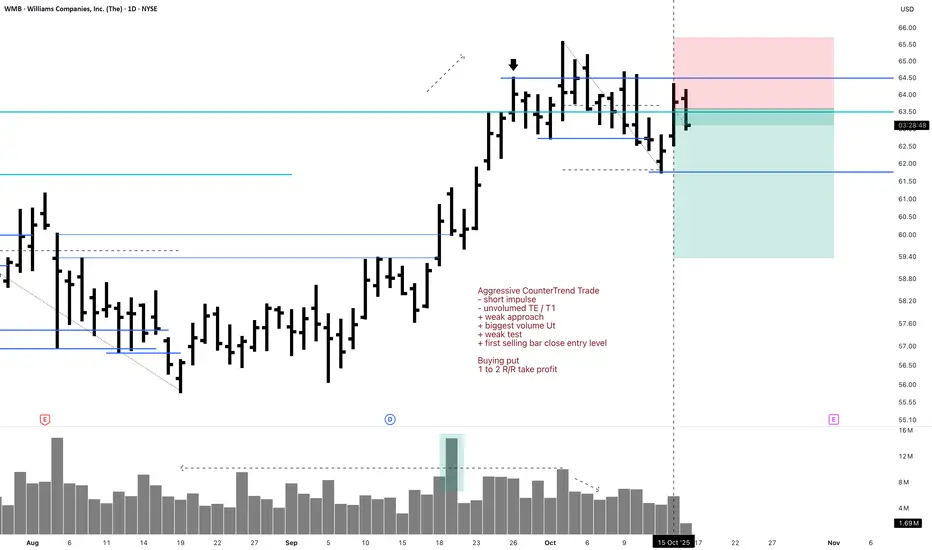
WMB 1D Short Aggressive CounterTrend Trade (Put Buy to Open)Aggressive CounterTrend Trade
- short impulse
- unvolumed TE / T1
+ weak approach
+ biggest volume Ut
+ weak test
+ first selling bar close entry level
Buying put
1 to 2 R/R take profit
Monthly CounterTrend
"- short balance
+ volumed expanding CREEK
+ resistance level
= wrong volume distribution weak approach"
Yearly CounterTrend
"- short balance
+ volumed expanding CREEK
+ resistance level
= wrong volume distribution weak approach"
GBP/JPY Support Flip in ActionLong-term vibe (2W chart):
GBP/JPY's been cursing upwards since 2020, riding that strong support line. It's like the pair's got a safety net, and as long as it holds above this line, the trend's buddy-buddy with the bulls.
Short-term play (1D chart):
Check it, on the daily chart, GBP/JPY broke above a key resistance zone, and now that level turn into support. It's like getting a green light for a potential push higher. We're chillin' around the 203-204 zone now, if this holds, we're prob looking at higher targets.
Putting it together:
Long-term trend's up, and short-term breakout saying "hey, maybe more upside". If GBP/JPY hangs out above 203-204, bulls might keep pushing it higher.
DYOR, NFA
Thanks for reading! Appreciate your support and engagement 🙏

USD/JPY – Buy Entry (H1- Channel Breakout Pattern)
The USD/JPY Pair, Price has been trading within a Channel Breakout Pattern on the H1 chart, forming consistent higher highs and higher lows. Price action is now testing the upper boundary of the Pattern, signalling a possible breakout. FX:USDJPY
✅Market Context:
1️⃣Strong Upward Structure Inside the Pattern.
2️⃣Buyers are showing strength near Resistance.
3️⃣Breakout above the Trendline indicates Momentum continuation toward higher zones.
✅Trade Plan:
Entry: Buy after Confirmed Breakout above the Resistance (H1 candle close above trendline or retest of the breakout).
💰Take Profit (TP): At the Key Zone – a Major Resistance area identified ahead.
🛑Stop Loss (SL): Below the Pattern Structure.
✅Psychological Discipline :
1️⃣Stick to plan – No Revenge Trades.
2️⃣Accept losing trades as Part of the Strategy.
3️⃣Risk only 1–2% of your account balance per trade.
💬 Support the community: If you found this useful, drop a 👍 like and share your thoughts in the comments!
⚠️ Disclaimer: This analysis is for educational purposes only and does not constitute financial advice. Forex trading involves high risk. Trade only with capital you can afford to lose and always do your own research.

Ford 1D Investment Aggressive CounterTrend TradAggressive CounterTrend Trade
- short impulse
+ exhaustion volume
+ 1/2 correction
Calculated affordable stop limit
Take profit:
1/3 to 1/2 Month Trend
1/3 to Month T2
1/3 to Year 1/2
Sell F Limit at $14.95 (Good 'til Canceled)
Sell F Limit at $11.57 (Good 'til Canceled)
Sell F Limit at $10.21 (Good 'til Canceled)
Monthly CounterTrend
"- short impulse
+ 1/2 correction
- unvolumed T1
+ support level
+ reverse volume approach
+ volumed manipulation"
Yearly Trend
"+ long impulse
+ volumed T2 level
+ volumed 2Sp+
+ weak test"

F 5M Daytrade Long Aggressive Trend TradeAggressive Trend Trade
- short impulse
+ volumed TE / T1 level
+ support level
+ long volume distribution approach
+ biggest volume 2Sp+
- no test
Calculated affordable stop limit
1 to 2 R/R take profit before 5M T2
Hour Trend
"- long impulse
- volumed T2
+ support level
+ 1/2 correction
+ biggest volume manipulation"
Day Trend
"+ long impulse
+ 1/2 correction
- neutral zone
- context direction short"
Month CounterTrend
"- short impulse
+ 1/2 correction
- unvolumed T1
+ support level
+ long volume distribution
+ biggest volume manipulation"
Year Trend
"+ long impulse
+ volumed T2 level
+ volumed 2Sp+
+ 1/2 correction
+ weak test"

UPS Swing Long 1H Conservative Trend TradeConservative Trend Trade
+ long impulse
- supporting reaction bar
+ support zone
+ 1/2 correction
+ biggest volume Sp
Calculated affordable virtual stop loss
1 to 2 R/R take profit
Daily Trend
+ long impulse
= neutral zone"
Monthly CounterTrend
"+ short impulse
+ biggest volume T1
+ support zone
+ biggest volume manipulation bar
- one bar reversal?"
Yearly trend
"+ long impulse
+ 1/2 correction
+ T2 level
+ support zone
+ biggest volume manipulation bar"

XAU/USD Intraday Plan | Support & Resistance to WatchGold dropped like a rock yesterday, extending its sharp sell-off into the early Asian session, where price briefly touched 4,004 before bouncing back. The move marked one of the steepest single-day declines in weeks, slicing straight through multiple support zones before finding some footing just above 4075(deeper support zone).
Price is now hovering around 4,141, showing early signs of stabilization after yesterday’s flush-out. While the broader uptrend remains intact, short-term momentum has clearly shifted bearish, with the MA50 now acting as dynamic resistance. If buyers can reclaim 4,192 and the MA200, a corrective bounce toward 4,227 and 4,279 could follow.
However, failure to hold above 4,117 would likely trigger another leg lower toward the Deeper Support Zone (4,075–4,044), where stronger buying interest are expected.
📌 Key levels to watch:
Resistance:
4151
4192
4227
4279
4321
Support:
4117
4075
4044
4004
3984
🔎 Fundamental focus:
While short-term sentiment has flipped cautious, the broader macro backdrop remains gold-supportive — ongoing political risk and weak global growth continue to attract dip buyers on major corrections.

GBP/USD – Sell Entry (H1 – Channel Pattern)
The GBP/USD Pair, Price has been trading within a Channel Pattern on the H1 chart, forming consistent lower highs and lower lows. Price action is now testing the lower boundary of the pattern, signalling a possible breakdown.
✅Market Context:
1️⃣Downward structure building inside the pattern.
2️⃣Sellers are showing strength near support levels.
3️⃣Breakdown below the trendline indicates momentum continuation toward lower zones.
✅Trade Plan:
Entry: Sell after confirmed breakdown below the support (Candle close below trendline or retest of the breakout).
💰Take Profit (TP): At the Key Zone – major support area identified ahead.
🛑Stop Loss (SL): Above the pattern structure / recent swing high.
✅Psychological Discipline:
1️⃣Stick to plan – No Revenge Trades.
2️⃣Accept losing trades as part of the strategy.
3️⃣Risk only 1–2% of your account balance per trade.
💬 Support the community: If you found this useful, drop a 👍 like and share your thoughts in the comments!
⚠️ Disclaimer: This analysis is for educational purposes only and does not constitute financial advice. Forex trading involves high risk. Trade only with capital you can afford to lose and always do your own research.

GBP/NZD - Wedge Breakdown (20.10.2025)📊 Setup Overview:
GBP/NZD has formed a Rising Wedge Pattern on the 30-min chart, signaling a potential trend reversal from the recent bullish structure. The pair has also completed a Cloud Cross, indicating early bearish momentum as price begins to break below the wedge support line. OANDA:GBPNZD
📈 Trade Plan: Bias: Bearish
Sell Entry Zone: Below 2.3400 (after candle close confirmation)
1st Target: 2.3288 ✅
2nd Target: 2.3277 🎯
Resistance Zone: 2.3479 – 2.3523
🧩 Technical Highlights:
1.Rising Wedge pattern breakdown – early bearish signal
2.Ichimoku Cloud Cross confirms downside pressure
3.Volume profile thinning below 2.34, showing potential liquidity vacuum
4.Clean bearish structure with clear risk–reward setup
#GBPNZD #ForexAnalysis #WedgePattern #BearishBreakout #Ichimoku #PriceAction #TechnicalAnalysis #ChartSetup #SwingTrade #TradingView #FXMarket #Kabhi_TA_Trading #ChartsDontLie #TradersDontQuit #ForexSignals
⚠️ Disclaimer:
This analysis is for educational purposes only and not financial advice.
Always confirm setups with your own analysis and manage risk properly before entering any trade.
💬 Support This Analysis:
If this setup helped your trading view — LIKE 👍, COMMENT 💬 your thoughts, and FOLLOW ✅ for more daily forex setups and chart breakdowns from Kabhi_TA_Trading!

ETH Consolidating Before the Next Move$ETH/USDT has been trading sideways for the past 74 days, holding strong at the confluence of the rising trendline and key support zone. This prolonged consolidation suggests that both buyers and sellers are in a state of equilibrium, waiting for a decisive move.
A breakout on either side could set the tone for the next major trend. If ETH manages to hold this support and gain momentum, we might see a strong recovery toward the upper resistance levels.
However, if it loses this zone, a deeper correction could follow before any significant upside move.
DYOR, NFA
PEACE


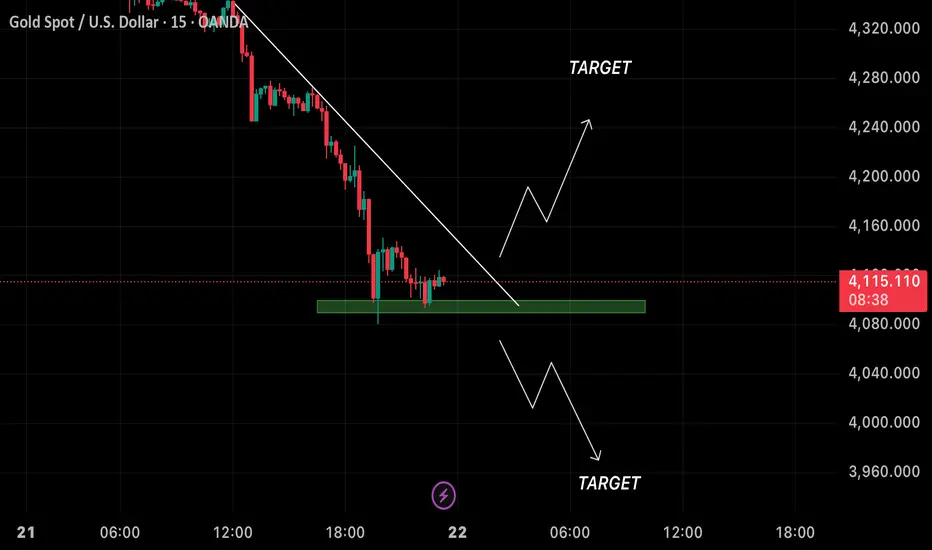
Xau/Usd – Breakout or Breakdown? Key Decision Zone AheadPrice is currently in a strong downtrend, forming lower highs and lower lows. The market has reached a key support zone (highlighted in green), which has acted as a previous reaction level.
Trendline:
A clear descending trendline shows continuous selling pressure. Price is now consolidating just below this line, suggesting a potential breakout setup.
Scenarios:
1. Bullish Breakout:
• A strong close above the descending trendline with volume confirmation could trigger a reversal or retracement move.
• Upside Target: Toward the next resistance area around 4,200–4,250.
• Confirmation: Retest of the broken trendline as new support.
2. Bearish Continuation:
• If price fails to break above and rejects the trendline, a continuation to the downside is likely.
• Downside Target: Toward 4,000–3,960 area (next support zone).
• Confirmation: Breakdown below the green demand zone.
Key Levels:
• Support: 4,080 – 4,100
• Resistance: 4,160 – 4,200
Bias: Neutral → Waiting for breakout confirmation before taking direction.
XAU/USD Intraday Plan | Support & Resistance to WatchGold attempted another run-up yesterday but failed to sustain momentum, leading to a renewed pullback this session. Price is currently trading around 4259, slipping below the MA50 as short-term momentum softens after repeated rejections from the 4362 resistance zone.
Despite the rejection the broader trend remains bullish above the MA200, though short-term momentum has clearly weakened. If buyers manage to reclaim 4321, gold could reattempt the upside toward 4362 and 4406.
However, a break below 4,279 would expose the First Reaction Zone (4,227–4,192), where buyers will likely defend to maintain trend structure. A deeper breakdown beneath this area could open the way toward 4,151–4,117 near the MA200.
📌 Key levels to watch:
Resistance:
4321
4362
4406
Support:
4279
4227
4192
4151
4117
🔎 Fundamental focus:
The U.S. government shutdown continues to pressure risk sentiment, with political negotiations showing little progress. Several key data releases this week, including PMI and durable goods orders, remain uncertain due to the data blackout, adding to market caution.

XAG/USD – SELL Entry (H1- Wedge Breakout Pattern)The XAG/USD Pair, Price has been trading within a Wedge Pattern on the H1 chart, forming consistent higher highs and higher lows. Price action is now testing the upper boundary of the Pattern, signalling a possible breakout. OANDA:XAGUSD
✅Market Context:
1️⃣Strong Upward Structure Inside the Pattern.
2️⃣Buyers are showing strength near Resistance.
3️⃣Breakout above the Trendline indicates Momentum continuation toward higher zones.
✅Trade Plan:
Entry: Buy after Confirmed Breakout above the Resistance (H1 candle close above trendline or retest of the breakout).
💰Take Profit (TP): At the Key Zone – a Major Resistance area identified ahead.
🛑Stop Loss (SL): Below the Pattern Structure.
✅Psychological Discipline :
1️⃣Stick to plan – No Revenge Trades.
2️⃣Accept losing trades as Part of the Strategy.
3️⃣Risk only 1–2% of your account balance per trade.
💬 Support the community: If you found this useful, drop a 👍 like and share your thoughts in the comments!
⚠️ Disclaimer: This analysis is for educational purposes only and does not constitute financial advice. Forex trading involves high risk. Trade only with capital you can afford to lose and always do your own research.

US100: Needs a healthy pullback before breaking highs🧭 SKILLING:US100 (30-Min Chart) – The Market Needs a Pause Before the Breakout
After a strong recovery from the 24,200 area , the US100 has shown an impressive upward acceleration, forming a steep speed line that pushed price back toward the previous highs around 25,150 – 25,250 — a major resistance zone where sellers previously dominated.
However, as price reaches this area, the bullish momentum is starting to fade. Smaller candles and indecisive movements reveal hesitation — buyers are still in control, but the strength that carried the market this far is beginning to weaken.
If we look closely at the market structure, it’s clear that the index has been trying to reclaim the entire prior range, but that effort hasn’t come easy. After such a fast rally, the market looks overextended, and bulls may need a healthy pullback to gather enough energy for a real breakout.
________________________________________
🔍 Technical Outlook
• The 25,150 – 25,250 zone remains the key resistance area. If price keeps getting rejected here, short-term sellers might step in.
• A corrective move toward 24,850 – 24,950 (the pink zone) would not be surprising.
• That area should be watched closely — if buyers defend it strongly, it could become the launchpad for another push toward new highs.
________________________________________
🎯 Personal View
The overall structure still favors the bullish side, but momentum needs a reset.
A short-term pullback shouldn’t be seen as weakness — it’s an opportunity for the market to rebalance before the next leg up.
If the 24,850 zone holds, the probability of a true breakout above 25,250 increases significantly, potentially opening room toward 25,400 – 25,500 in the next sessions.
________________________________________
💬 In summary:
The US100 has worked hard to reclaim lost ground, but breaking above the previous top will require fresh momentum. A short-term correction could be exactly what the market needs to build a stronger foundation for a sustainable rally.
Please like and comment below to support our traders. Your reactions will motivate us to do more analysis in the future 🙏✨
Harry Andrew @ ZuperView

XAU/USD Intraday Plan | Support & Resistance to WatchGold had a strong pullback on Friday following last week’s sharp rally and is now consolidating between 4,279 and 4,227. The retracement has allowed the market to cool off after consecutive all-time highs, while buyers are still defending the First Reaction Zone (4,227–4,192).
Price remains above the MA200, maintaining the broader bullish structure, but continues to struggle reclaiming the MA50, which now acts as short-term resistance. A break above 4,279 could re-ignite bullish momentum toward 4,321 and 4,362, while a failure to hold 4,227 may invite deeper correction toward 4,151–4,117.
📌 Key levels to watch:
Resistance:
4279
4321
4362
4406
Support:
4227
4192
4151
4117
🔎 Fundamental focus:
This week’s calendar features key U.S. data releases, including Flash PMIs, Durable Goods Orders, and Consumer Sentiment, though many reports risk delay due to the ongoing government shutdown. The blackout continues to cloud market visibility and reinforce safe-haven demand for gold.

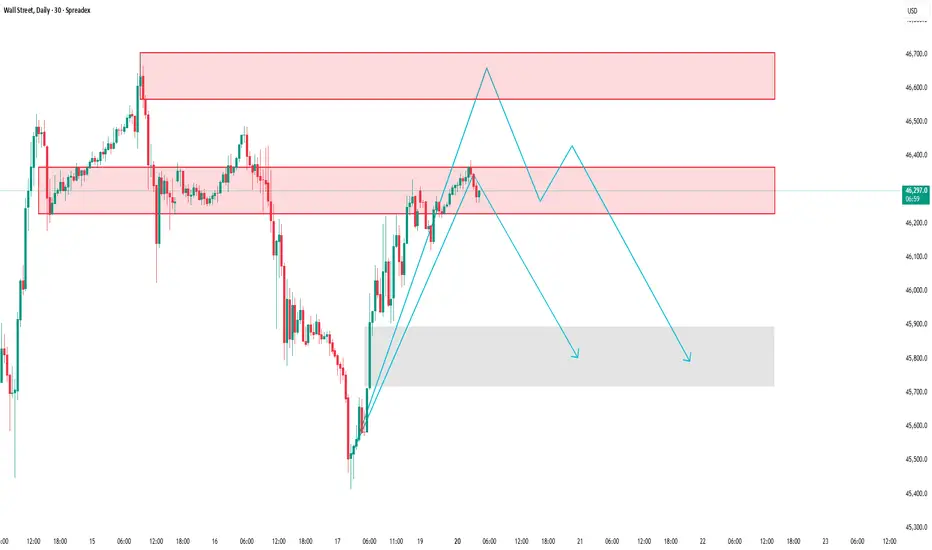
US30: Testing key supply zone, possible pullback ahead
SPREADEX:DJI – Price Reaction at Supply Zone | Possible Short-Term Correction
Timeframe: 30-Minute Chart
Analysis Style: Price Action • Supply & Demand • Market Structure
________________________________________
🧭 Market Context
After a strong rally from the lower demand zone, the Wall Street Index is now approaching a key supply area that previously triggered a sharp downward move.
At this level, sellers are beginning to step in again, and price momentum is starting to fade — suggesting a potential short-term correction ahead.
________________________________________
🧩 Market Structure & Key Zones
🔴 Supply Zone #1: 46,227 – 46,370
→ The first reaction zone, where previous selling pressure started a strong decline.
🔴 Supply Zone #2 (Major Resistance): 46,572 – 46,700
→ A higher zone where strong bearish momentum originated before.
🟢 Demand Zone: 45,900 – 45,700
→ A previous accumulation area that fueled the recent bullish leg — possible support zone if price pulls back.
________________________________________
📊 Current Price Behavior
Price has reached the 46,227 – 46,370 area and is showing signs of buyer exhaustion.
Multiple rejections and slower bullish candles near this level indicate a loss of momentum.
If the short-term bullish structure breaks, the market may shift toward a corrective phase.
________________________________________
📉 Trading Scenario
✅ Primary Scenario (Bearish Reaction Expected):
1. Price might retest 46,229–46,400 once more.
2. Failure to break above this level could lead to a downward “push.”
3. Target zone for the correction: 45,800 – 45,900.
⚙️ Alternative Scenario:
• If price closes clearly above 46,400, the short-term bearish setup becomes invalid.
• In that case, the next resistance to watch lies around 46,600 – 46,700.
________________________________________
💡 Conclusion
The Wall Street Index is currently testing a critical supply zone with visible signs of slowing momentum.
Unless bulls regain control above 46,400, the market may experience a short-term pullback toward the lower demand area.
This analysis is for educational and informational purposes only — not financial advice. Always confirm with your own price action and risk management strategy before making any trading decisions.
Please like and comment below to support our traders. Your reactions will motivate us to do more analysis in the future 🙏✨
Harry Andrew @ ZuperView
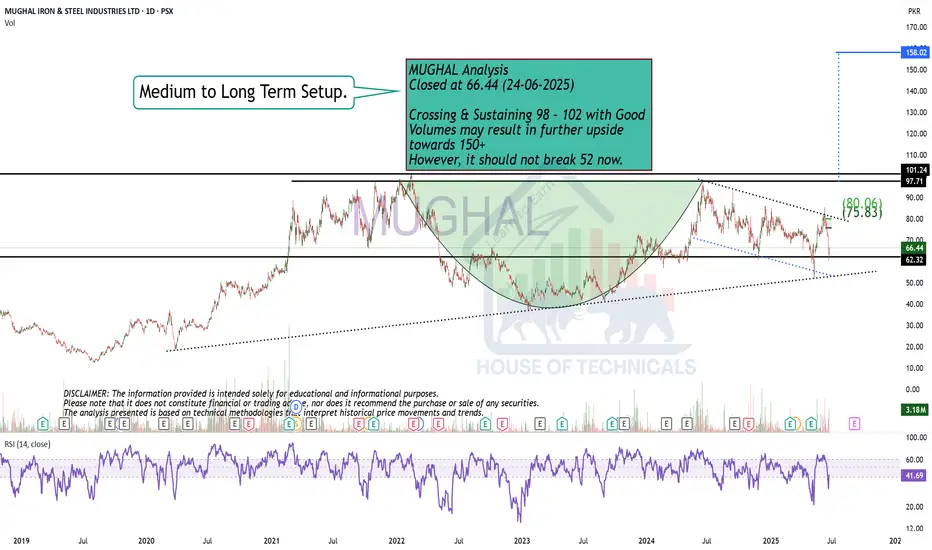
Cup & Handle FormationMUGHAL Analysis
Closed at 66.44 (24-06-2025)
Crossing & Sustaining 98 - 102 with Good
Volumes may result in further upside
towards 150+
However, it should not break 52 now.
Gbp/Usd - Inverse Head & Shoulders Targeting Bullish BreakoutA potential bullish reversal is forming on GBP/USD in the 15-minute chart via a classic Inverse Head and Shoulders pattern.
Pattern Details:
Left Shoulder: Formed with a minor pullback and recovery.
Head: A deeper dip indicating strong buyer absorption and bottoming.
Right Shoulder: Symmetrical pullback signaling the potential end of the bearish move.
Neckline: Marked by horizontal resistance (around 1.34395) — a confirmed breakout above this level may trigger bullish continuation.
Trade Idea:
Entry Zone: On breakout and close above neckline (~1.34400)
Target 1: Previous structural resistance (~1.34680)
Target 2: Extended move toward ~1.35070
Stop Loss: Below the right shoulder or neckline retest (~1.34186)
Analysis Notes:
This pattern suggests bullish momentum is building.
Confirmation needed via volume spike or candle close above neckline.
Risk-to-reward ratio is favorable for short-term intraday trade.
