Bounce Or Breakdown? Eur/Usd at Critical Support Price is currently testing a strong support zone around the 1.1650 level, where it has previously shown buying interest. The market has been in a downtrend, but we’re now seeing signs of potential reversal as price reacts to this key demand area.
Key Levels:
Support: 1.1645 – 1.1655 (highlighted in blue)
Resistance/Target Zone: 1.1715 – 1.1730 (highlighted in green)
Trade Idea:
If price holds above the support zone and shows bullish confirmation (e.g. bullish engulfing, break of minor structure), we could see a potential bounce toward the target resistance zone, offering a favorable risk-to-reward setup.
Supportandresistancezones

AUDCAD: Wait for the Close – 0.9130 vs 0.9057AUDCAD is sitting at a make-or-break spot. It’s been climbing in a 4H channel but just topped out and pulled back to support. I won’t guess mid-range—I'll trade the break:
Bull: H4 candle closes above 0.9130 → room toward 0.9165/0.9180, then 0.9230–0.9250.
Bear: H4 candle closes below 0.9057 → opens 0.9000, then 0.8950–0.8920.
I prefer a close and quick retest/hold for confirmation. Watch AUD/CAD news and oil (for CAD).

ADA 5% DROP AHEAD!Theres a chance we get one more push up to test the supply zone ahead before moving down but if not and we move lower from here, it's a 5% drop to the nearest support level.
Just sit back and enjoy the ride.
Calculate Your Risk/Reward so you don't lose more than 1% of your account per trade.
Every day the charts provide new information. You have to adjust or get REKT.
Love it or hate it, hit that thumbs up and share your thoughts below!
This is not financial advice. This is for educational purposes only.

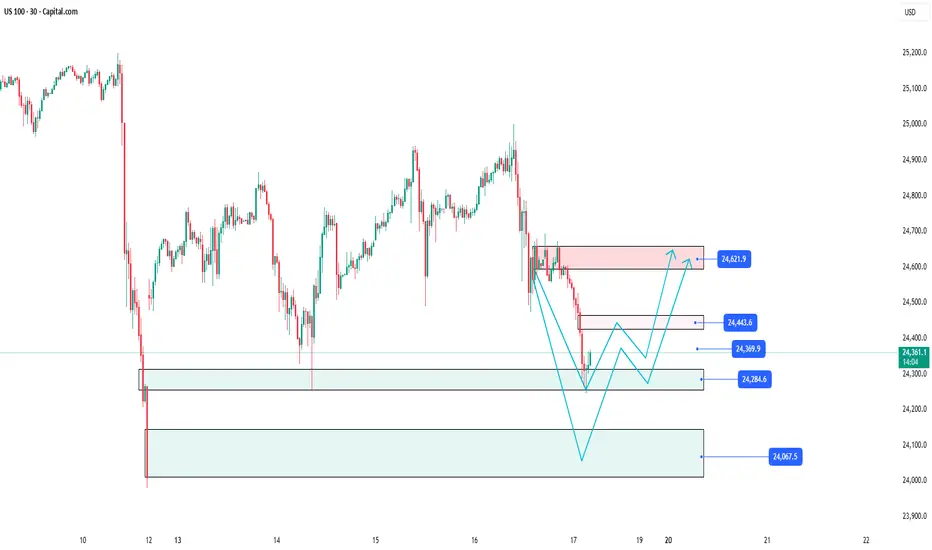
US100: Price action around important imbalance📊 SKILLING:US100 Analysis: Detailed trading scenario at key price level 24,443.6 🚀
The US 100 30-minute chart is currently illustrating a clear picture of price movements with significant support and resistance zones. At the moment, the price is undergoing a strong correction after a deep decline and is approaching crucial price areas, creating multiple potential trading opportunities for investors.
________________________________________
Support Zone 24,284.6 – The starting point for a potential bounce 💥
Currently, the price is nearing the technical support level around 24,284.6 – a key support area that is expected to hold considerable buying interest, potentially triggering a short-term bounce. Buyers may step in here to prevent further declines and initiate a recovery trend.
Careful observation of price action around this zone is essential as it will determine the market’s next momentum: whether the price will rebound or break lower.
________________________________________
Immediate Resistance Levels and the Imbalance Zone at 24,443.6 🔍
Following a bounce from the 24,284.6 support, the expected scenario is a gradual move upwards to test important resistance levels:
• First at 24,369.9, where initial selling pressure may emerge, challenging the upward momentum.
• Next at 24,443.6, identified as a significant imbalance zone on the chart — a price level where price previously moved rapidly, creating a notable supply-demand gap.
• This zone acts as a technical “wall,” a crucial checkpoint before the price can continue its upward trend or get pushed back down.
________________________________________
Detailed Price Movement Scenario 🔄
1. Price bounces from the support at 24,284.6, setting the stage for a recovery leg.
2. Price moves up to test the first resistance at 24,369.9; the reaction here indicates the buyers’ strength.
3. Price then challenges the imbalance zone at 24,443.6 — where significant selling pressure may occur.
4. At this level, two scenarios may unfold:
• Price breaks above 24,443.6, confirming the uptrend and targeting the next resistance at 24,621.9.
• Price rejects this zone, leading to selling pressure that pushes price back to retest the 24,284.6 support or even lower.
________________________________________
Downside scenario if support at 24,284.6 fails 🛡️
In the worst case, if price breaks below the crucial support at 24,284.6, further declines toward a broader support zone at 24,067.5 are likely. This level may act as the next key area for price stabilization and buyer interest before any potential rebound.
Please like and comment below to support our traders. Your reactions will motivate us to do more analysis in the future 🙏✨
Harry Andrew @ ZuperView
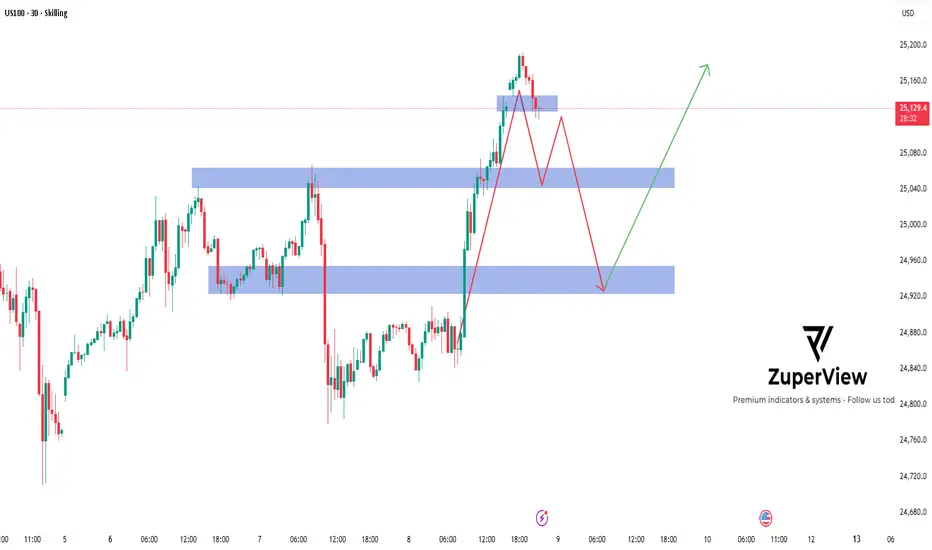
US100: Potential reversal from overbought zone
Symbol: SKILLING:US100
Timeframe: 30 Minutes
Indicators: OB/OS Overlap (RSI, MFI, Stochastic) + S/R
________________________________________
🔍 Quick Summary
After a strong rally 🚀 from the 24,750–24,800 support area, US100 has reached the 25,280–25,300 resistance zone — where multiple oscillators are showing overbought signals.
This suggests potential profit-taking or a technical correction may occur soon.
________________________________________
📊 Price Structure
• Price formed a temporary top after tapping the overbought area, with clear rejection candles near resistance.
• A pullback toward the first support zone around 25,000–25,050 could occur before the next move.
• If selling pressure continues, the next target area lies near 24,800–24,850, where previous structure and demand overlap 📉.
________________________________________
🧩 Technical Highlights
• OB/OS Overlap: RSI, MFI, and Stochastic are all in overbought territory (3/3 alignment) — a strong early signal of potential short-term exhaustion.
• Price Action: A minor double top or bearish divergence may be forming if momentum indicators continue to decline.
• Key Zones: Blue zones on the chart mark areas of potential buyer reaction (demand).
________________________________________
🧭 Scenario Outlook
Main Scenario (🔻 Pullback Expected):
Price could retrace toward 25,000–24,850 before buyers attempt a rebound.
Alternative Scenario (🚀 Continuation):
If the price holds above 25,100 and breaks 25,280, the bullish momentum might continue short-term.
________________________________________
⚙️ Risk Note
This analysis is for educational purposes only and not financial advice.
Always manage risk carefully and align your trade plan with your own strategy 📘💡.
Market conditions can change rapidly — stay flexible and objective!
Please like and comment below to support our traders. Your reactions will motivate us to do more analysis in the future 🙏✨
Harry Andrew @ ZuperView
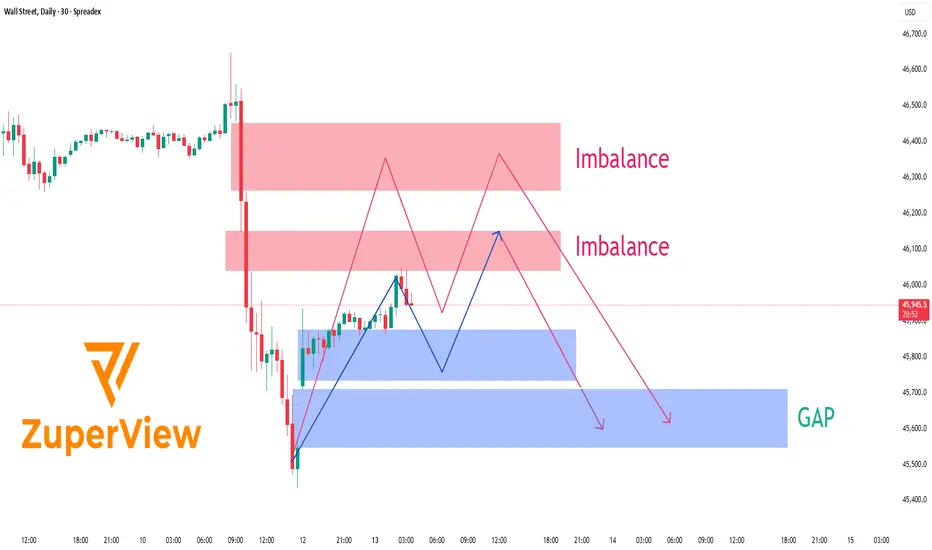
US30: Rebound before the stormTechnical Outlook – Wall Street Index (30-Minute Chart)
After the announcement that the U.S. will impose a 100 % tariff on Chinese imports, Wall Street ⚡ plunged sharply, leaving behind distinct Imbalance zones and an unfilled GAP lurking below current price levels.
At present, price is hovering around 45,950 💵, showing a modest rebound after tapping into a short-term demand zone. Above, two notable Imbalance areas stand out — around 46,000-46,150 and 46,250-46,450 - both formed as aggressive sell orders flooded the market following the latest wave of trade-war headlines 🌍.
The likely scenario 🎯:
Price could continue to retrace upward ↗️ to test one of these supply/imbalance zones before sellers re-enter the market. If selling pressure remains dominant, the index may resume its decline toward the GAP area around 45,500 - 45,650 📉, where liquidity is still unfilled and buyers may look to step back in.
Current price action indicates a corrective pullback rather than a full reversal. Trading volume is thinning 📉, candlestick patterns show signs of exhaustion 🕯️, and the upper imbalance zones remain untouched — all signaling that sellers still hold the upper hand.
________________________________________
🌍 Fundamental Context – U.S. vs. China Tensions Heating Up
On October 10, President Trump officially declared a 100 % additional tariff on Chinese goods, effective November 1, 2025 — the most aggressive move since the 2018-2019 trade war.
Beijing immediately condemned the plan, warning of “corresponding countermeasures”, including restrictions on rare-earth exports and higher port fees on U.S. vessels. While strong in tone, China has so far stopped short of announcing a direct tariff retaliation, signaling a cautious approach while keeping the door open for talks.
Washington, meanwhile, insists the measure aims to “protect American interests and reduce over-reliance on China’s supply chains,” but officials also noted that negotiations remain possible if China shows “substantive goodwill.”
Financial markets reacted swiftly 💥:
• U.S. and Asian equities dropped 2–3 % on average.
• USD strengthened, while gold and JPY rallied as safe-haven flows increased.
• Tech and industrial stocks with strong China exposure saw the largest losses.
Overall, risk sentiment remains fragile as investors brace for a prolonged phase of trade uncertainty.
________________________________________
💡 Trading Summary
Short-term structure favors a sell-the-rally approach. The market may retest upper imbalance zones before resuming its downtrend toward the 45,500 USD GAP area.
If U.S.–China tensions intensify further, downside momentum could accelerate. Conversely, any sign of renewed dialogue or tariff delay could trigger a short-term rebound — but bias remains bearish until the market reclaims 46,300 USD convincingly.
In short: patience, risk control, and reaction to headlines are key this week. ⚖️
Please like and comment below to support our traders. Your reactions motivate us to do more analysis in the future 🙏✨
Harry Andrew @ ZuperView
US100: Breakout signals a strong second bullish leg🧩 Market Context
On the 30-minute chart, SKILLING:US100 index shows renewed bullish momentum after a phase of sideways consolidation. Following a deep correction, price action has started forming higher highs and higher lows, suggesting that buyers are gradually regaining control.
🔍 Price Structure and Breakout
Price has recently broken out above a short-term consolidation zone and a rising trendline.
This breakout reinforces the short-term bullish bias and could mark the start of a second upward leg in the current recovery.
Statistically, when a breakout happens after tight accumulation, the next bullish leg often becomes equal to or larger than the previous one, as momentum builds and buyers gain confidence.
📈 Key Price Levels
• Resistance 1: 24,914 – prior rejection zone in the last upward move.
• Resistance 2: 25,074 – distribution area before the previous drop.
• Support: 24,700 – 24,750 (former resistance now acting as potential support).
⚙️ Trading Scenarios (for observation only)
• After the breakout, price may retest the previous resistance zone (around 24,700–24,750) before continuing higher.
• If buyers defend this level, the second bullish leg could extend toward 24,914 and possibly 25,074.
• Conversely, a close back below 24,700 may trigger a deeper pullback before any continuation attempt.
🧠 Summary
The technical structure on US100 favors a short-term bullish outlook. A successful retest of the breakout zone could pave the way for a second upward leg, potentially matching or exceeding the size of the previous rally.
______________________________________
📌 This analysis is for educational and technical purposes only. It does not constitute financial advice or a recommendation to buy or sell any asset.
Please like and comment below to support our traders. Your reactions will motivate us to do more analysis in the future 🙏✨
Harry Andrew @ ZuperView

GBP/JPY | Breakout Alert! (16.10.2025)The GBP/JPY pair on the M30 timeframe presents a Potential Buying Opportunity due to a recent Formation of a Wedge Breakout Pattern.
This suggests a shift in momentum towards the upside and a higher likelihood of further advances in the coming hours.
Possible Long Trade:
Entry: Consider Entering A Long Position around Trendline Of The Pattern.
Target Levels:
1st Resistance – 204.11
2nd Resistance – 201.77
#GBPJPY #Forex #TradingSetup #TechnicalAnalysis #Breakout #SupportAndResistance #Ichimoku #FX #Bullish #TradePlan
🎁 Please hit the like button and
🎁 Leave a comment to support for My Post !
Your likes and comments are incredibly motivating and will encourage me to share more analysis with you.
Disclaimer: This is for educational and analytical purposes only. Trading involves significant risk and is not suitable for everyone. Do your own research (DYOR) and always manage your risk. Never trade with money you cannot afford to lose. "Charts Don't Lie, Traders Don't Quit."
Best Regards, KABHI_TA_TRADING
Thank you.

Nzd/Usd - Breakout SetupMarked in red, located around the 0.57300 area. Price has tested this zone multiple times but failed to break above — indicating strong selling pressure.
Support Zone (S):
Marked in blue, around the 0.57100–0.57150 range. This zone has acted as a strong bounce area where buyers stepped in.
Scenarios:
Bullish Scenario:
If price holds above the Support (S) zone and breaks through the Resistance (R) zone with strong volume or bullish momentum...
Target: A move toward the next higher structure (likely around 0.57400+), as indicated by the top-right upward arrow.
Bearish Scenario:
If price fails to maintain above the Support (S) zone and breaks below it with strong bearish candles...
Target: A move downward to the next key demand area (likely around 0.56800), indicated by the bottom-right downward arrow and U.S. economic icon.
Trade Plan Considerations:
Wait for confirmation breakout of either the support or resistance zone.
Use volume or candlestick confirmation for entry.
Risk management: Place stop-loss just outside the zone boundaries (above R or below S).
Be cautious of news impact, as suggested by the U.S. economic icon — upcoming USD-related data could cause volatility.

Gbp/Jpy - Ascending Channel in PlayGBP/JPY is currently respecting a well-defined ascending channel on the 15-minute chart, with price action moving between the upper and lower bounds.
Key Observations:
Ascending Channel: The price is trending upward, respecting both the upper resistance and lower support lines of the channel.
Midline Reaction: The dashed midline is acting as a dynamic support/resistance level within the channel.
Current Status: Price is near the midline after a brief rejection at the top boundary.
Trade Scenarios:
Bullish Continuation: If price holds above the midline and moves higher, the next target would be the channel top and potentially beyond (green arrow).
Bearish Breakdown: A break below the channel support could invalidate the pattern and trigger a downside move toward the lower target (red arrow).
Conclusion:
This setup provides an opportunity to trade the channel bounds or wait for a breakout. Use price action confirmation before entering either direction.

Eur/Usd - Breakout or Breakdown?EUR/USD is currently trading near a key resistance zone, while maintaining a short-term ascending trendline support. Price action shows a strong bullish structure, but the resistance zone is acting as a barrier.
Key Observations:
Resistance Zone: Price has tested this level multiple times without a clear breakout, indicating seller presence.
Trendline Support: An ascending trendline is providing support, forming a potential ascending triangle pattern.
Support Zone: If the trendline breaks, the price may retest the broader support zone below (marked in blue).
Potential Scenarios:
Bullish Breakout: A clean breakout above resistance could trigger a move toward the next upside target.
Bearish Breakdown: A break below the trendline and support could open the door for a drop toward the lower target zone.
Conclusion:
This setup is ideal for breakout traders. Watch for a candle close above resistance or below trendline support for confirmation of the next move.

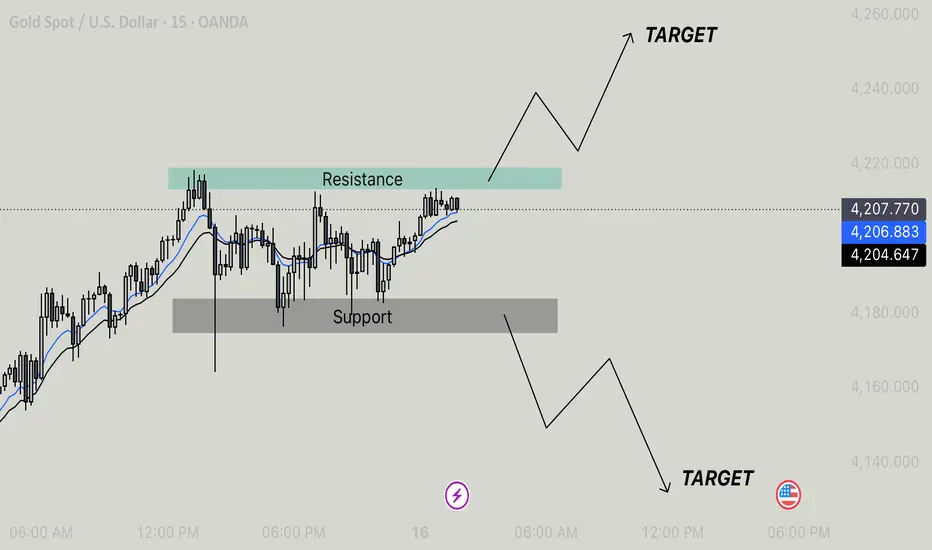
Xau/Usd- Technical Outlook Range Bound with Breakout PotentialCurrent Price Movement:
The price is fluctuating just above the Support zone (marked in gray) and near the Resistance zone (marked in green). It’s oscillating between these two zones, suggesting a consolidation phase or a potential breakout.
Resistance and Support Levels:
Resistance is indicated by the green area, where price has previously faced upward rejection. If the price breaks this resistance level, it could signify further bullish movement.
Support is marked by the gray area, suggesting that if the price drops to this level, it has historically found buying interest, preventing further downward movement.
Price Target:
The chart marks target points above and below the current price levels. The arrows indicate expected price movement. The top arrow suggests an upward target if the price breaks above resistance, while the bottom arrow indicates a downward target if the price falls through support.
Trend Indication:
There is a slight upward trend in the price, as seen in the shape of the moving averages. This could indicate bullish momentum, but the market remains in a range (bound by support and resistance).
Key Focus for Traders:
Traders should monitor if the price breaks through the resistance or support levels. A breakout from the range could lead to a sharp move in the direction of the breakout.
Depending on how the price reacts at the support and resistance levels. Keep an eye on the breakout direction to confirm the next move.
BTCUSD – Bullish Continuation Expected from Demand Zone BITSTAMP:BTCUSD
🟢
Market Overview
BTC has been consolidating within a corrective pattern after a sharp impulsive rise from the same demand zone.
The zone has held multiple times, confirming strong institutional interest.
As long as price respects this area, bullish momentum is expected to resume, targeting mid-range liquidity levels and previous structural highs.
Key Scenarios
✅ Bullish Case 🚀 → 🎯 Target 1 113 100 | 🎯 Target 2 114 500 | 🎯 Target 3 116 000
❌ Bearish Case 📉 → Break and close below 110 700 may open move toward 109 700 – 108 700 support
Current Levels to Watch
Resistance 🔴 113 100 – 114 500
Support 🟢 110 700 – 109 700
⚠️ Disclaimer: This analysis is for educational purposes only. Not financial advice.

UPS Swing 1H Long Conservative CounterTrend TradeConservative CounterTrend Trade
+ long impulse
- support bar above JOC level
+ support level
- above 1/2 correction
+ volumed 2Sp-
+ weak test
Calculated affordable virtual stop loss
1 to 2 R/R take profit above 1H T1 below 1D CREEK
Daily CounterTrend
"= uniderectional balance
+ expanding ICE level
+ support level"
Monthly CounterTrend
"- short impulse
+ biggest volume T1
+ biggest volume breaking bar with bad result"
Yearly Trend
"+ long impulse
+ 1/2 correction
+ T2 level
+ support level"

USDX — rebound from demand zoneThe U.S. Dollar Index (USDX) is correcting within an upward channel. After testing the demand zone 98.20–98.80 on the 4H chart, a double bottom pattern appeared, signaling a potential bullish continuation.
Strong Smart Money and volume support remain near 98.50. As long as price stays above this area, the bullish scenario remains valid.
Targets for growth are located at 100.12 and 101.03 — key supply zones and previous highs.
The dollar is supported by solid U.S. macro data and expectations that the Federal Reserve will maintain higher rates for longer. This keeps the USD attractive and favors further recovery.
The bullish bias remains while price holds above 98.20. Only a confirmed breakdown below 97.50 would shift the structure to bearish.

USD/CAD - Wedge Breakout (15.10.2025)📊 Setup Overview: OANDA:USDCAD
USD/CAD has completed a rising wedge formation and broken below the support trendline — a classic sign of bearish reversal pressure. The price is now rejecting from the resistance zone, supported by weakening momentum within the Ichimoku cloud. This setup indicates a potential move toward the next major support levels.
📈 Trade Plan:
Bias: Bearish
Sell Entry Zone: Near 1.4040 – 1.4060 (resistance retest area)
1st Target: 1.3992 ✅
2nd Target: 1.3954 🎯
Invalidation: Above 1.4075 resistance zone
🧩 Supporting Factors:
Clear wedge breakout below trendline
Resistance zone rejection after sharp upward push
Price trading below Ichimoku cloud, signaling bearish control
Volume and structure aligning for a potential downside continuation
#USDCAD #Forex #PriceAction #TechnicalAnalysis #TradingView #ChartPattern #WedgeBreakout #ForexSignals #BearishSetup #FXTrading #Ichimoku #ChartsDontLie
⚠️ Disclaimer:
This analysis is for educational purposes only and not financial advice. Always conduct your own analysis and use proper risk management before taking any trade.
💬 Support the Analysis:
If you found this helpful — Like 👍, Comment 💬, and Follow ✅ for more high-quality chart setups and pattern-based analyses!

Nzd/Usd - Bounce or BreakSupport Zone (Blue Box):
This area shows multiple rejections of lower prices (marked with “S” and triple taps), forming a Triple Bottom or potential Inverse Head & Shoulders structure, hinting at bullish reversal potential.
Resistance Zone (Red Box, labeled "R"):
This is a supply zone where price previously consolidated before continuing lower. Now price is testing it again. A break above this zone could signal trend reversal and continuation to the upside.
Two Potential Scenarios:
Scenario 1: Bullish Breakout
Price breaks above Resistance (R).
Could trigger buy entries, targeting the next resistance (marked “TARGET” above).
Confirmation would be a strong candle close above the red box and EMA crossover.
Scenario 2: Bearish Rejection
Price rejects the Resistance zone.
Could trigger short entries if price breaks below the support (S).
Target is the lower support zone (marked “TARGET” below).
Key Levels
Resistance (R): ~0.56940 - 0.56960
Support (S): ~0.56830 - 0.56860
Trade Ideas (Not Financial Advice)
Bullish Setup
Entry: Break and retest above 0.56960
Stop-loss: Below 0.56890
Target: 0.57100+
Bearish Setup
Entry: Rejection at resistance, break below 0.56830
Stop-loss: Above 0.56960
Target: 0.56650

GBP/USD - Breakout Pattern (14.10.2025)The GBP/USD pair on the M30 timeframe presents a Potential Buying Opportunity due to a recent Formation of a Breakout Pattern.
This suggests a shift in momentum towards the upside and a higher likelihood of further advances in the coming hours.
Possible Long Trade:
Entry: Consider Entering A Long Position around Trendline Of The Pattern.
Target Levels:
1st Resistance – 1.3434
2nd Resistance – 1.3484
🎁 Please hit the like button and
🎁 Leave a comment to support for My Post !
Your likes and comments are incredibly motivating and will encourage me to share more analysis with you.
#GBPUSD #Forex #Trading #TechnicalAnalysis #PriceAction #ForexSignals #BreakoutTrading #Ichimoku #FXTrading #BullishSetup #TradingView
⚠️ Disclaimer:
This analysis is for educational purposes only and not financial advice. Always use proper risk management and conduct your own research before trading.
Best Regards, KABHI_TA_TRADING
Thank you.

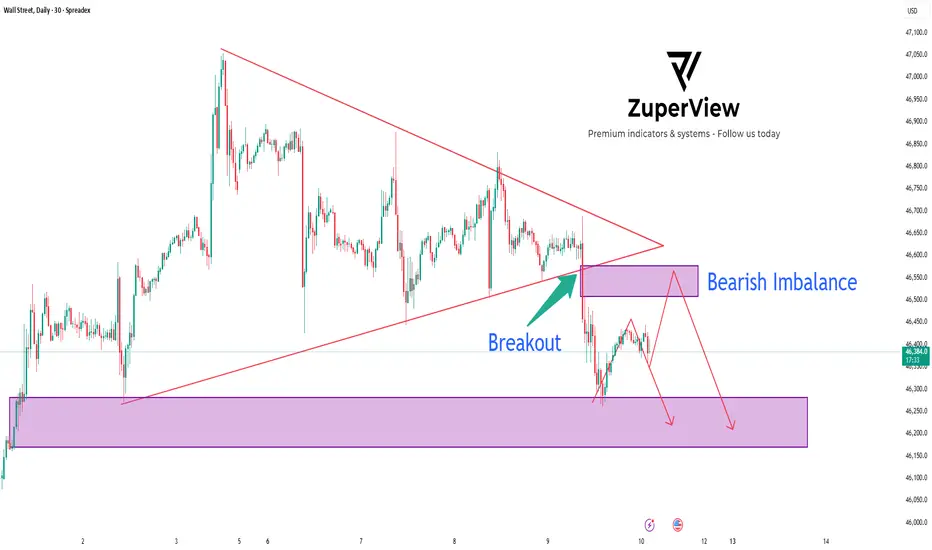
US30: Triangle breakout signal deeper sell move
📉 US30 Analysis: 4-Layer Resistance, Bearish Imbalance & Triangle Breakout | TradingView
The SPREADEX:DJI just printed a clean bearish breakout from a symmetrical triangle pattern on the 30-minute chart 🕒.
What makes this setup stand out is the 4-layer resistance zone perfectly overlapping with a Bearish Imbalance, creating a strong confluence for a potential continuation to the downside.
________________________________________
🧠 Technical Overview
On TradingView, the chart shows multiple lower highs forming inside a symmetrical triangle — a sign of buying exhaustion and seller accumulation. After several attempts, price finally broke below the structure, confirming a bearish market shift.
Key zones:
🔴 4-Layer Resistance: 46,850 → 46,550
⚫ Bearish Imbalance: 46,500 – 46,550
🟣 Demand Zone / Support: 46,150 – 46,250
Each resistance layer acted as a rejection point, showing how Smart Money continues to distribute orders and defend that area aggressively.
________________________________________
📊 Breakout – Retest – Continuation Setup
Following the breakout, price made a quick pullback to retest the 4-layer resistance zone — right where the Bearish Imbalance sits.
This is a textbook Breakout–Retest–Continuation pattern on TradingView, confirming that sellers are still in control.
1️⃣ Breakout: Price breaks below the triangle.
2️⃣ Retest: Price retraces to test the 4-layer resistance and imbalance.
3️⃣ Continuation: Strong rejection signals the next bearish leg.
________________________________________
💡 Trading Plan
Our trading plan for this setup is straightforward. I’m waiting for price to retest the 46,500–46,550 zone and show clear signs of rejection — such as a bearish engulfing candle or a break of structure on lower timeframes.
If confirmed, I’ll look to enter a short position targeting the Demand Zone around 46,150–46,250.
A stop loss would be placed just above 46,650, beyond the resistance cluster, to protect against false breakouts.
This plan aligns perfectly with Smart Money Concept (SMC) and Price Action trading, offering a strong risk-to-reward ratio 📈.
________________________________________
🧩 Market Psychology
✅ The four consecutive rejections at the same price zone clearly show how institutional traders are defending supply levels.
✅ Every time price pushes higher, Smart Money sells into liquidity, leaving wicks and imbalances behind.
✅ This behavior reinforces the bearish bias and supports the idea of a continued drop once short-term liquidity is collected.
________________________________________
🔎 Summary
✅ Bearish breakout confirmed from the triangle pattern
🔴 Strong 4-layer resistance overlapping with Bearish Imbalance
📉 Expecting price to continue toward the lower Demand Zone
This setup is clean, confluence-rich, and ideal for traders using TradingView, Price Action, and Smart Money Concepts.
A well-timed short from this zone could deliver a high-probability trade with excellent structure confirmation 🔥.
Please like and comment below to support our traders. Your reactions will motivate us to do more analysis in the future 🙏✨
Harry Andrew @ ZuperView
EUR/AUD - Bears in Control - Key Zones to WatchPrice is respecting the downtrend channel 📉 and sellers are showing strength near the Key Zone. If rejection holds, we could see fresh downside moves toward the marked support levels.
🎯 Targets:
1️⃣ 1.7700
2️⃣ 1.7650
👀 Watching closely for bearish continuation!
#EURAUD #FXSetup #ForexSignals
🔥 Support this idea with a LIKE 👍 & COMMENT 💬 Don’t forget to FOLLOW 🔔 for more setups daily.
⚠️ Disclaimer: This is not financial advice. Trade at your own risk and always do your own analysis.

GBP/AUD Sellers in Control | Key Supports Ahead📉 GBP/AUD Analysis 📉
The pair is trading inside a descending channel, showing continuous bearish pressure. Sellers remain in control, and price is respecting lower highs with potential continuation toward the marked Key Zones below.
🔑 Levels to Watch:
Resistance: 2.0450 – 2.0470
Support: 2.0280 / 2.0200
⚠️ If price breaks and holds below the mid-support, we could see a further slide toward the lower key zone.
#GBPAUD #ForexTrading #TechnicalAnalysis
✅ Support the idea with a LIKE 👍, COMMENT 💬, and FOLLOW 🔔 for more chart updates!
📌 Disclaimer:
This is an educational analysis only and not financial advice. Please do your own research before trading.

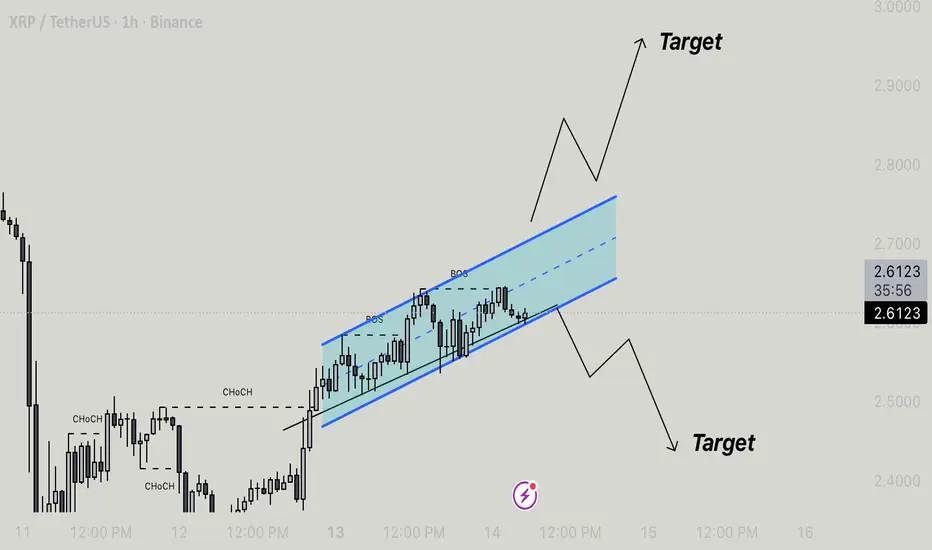
Assending Channel Formation And Potential Breakout OutlookXRP/USDT is currently trading within a well-defined ascending channel, indicating a short-term bullish structure following a previous period of consolidation. The market has shown a clear change of character (CHoCH) and multiple breaks of structure (BOS) to the upside, confirming the shift from bearish to bullish momentum.
Price action is currently respecting both the upper and lower boundaries of the channel, moving in a controlled upward pattern. The midline of the channel is acting as a short-term equilibrium level, where price frequently reacts before continuing in its prevailing direction.
As the price approaches the upper boundary, a breakout above this level would suggest bullish continuation, targeting the next resistance zone around 2.80–2.90. Conversely, if the price fails to hold above the lower boundary and breaks below it, a corrective move toward 2.40–2.30 could be expected.
Overall, XRP is in a bullish corrective phase within a rising channel. Traders are watching for a decisive breakout in either direction to determine the next major move.
Xau/Usd - Smart Money Setup, Targeting Liquidity Above Weak HighMarket Structure & Key Levels:
The chart shows a clear bullish trend with consistent Breaks of Structure (BOS) to the upside.
Change of Character (CHoCH) occurred after a bearish move, indicating a shift in market sentiment.
Price reclaimed the Important Key Level (highlighted in grey), showing it now acts as a strong demand zone.
Current Price Action:
Price has formed a Weak High near the 4,128.210 level, which is likely to be targeted and taken out.
Market structure remains bullish with consistent higher highs and higher lows.
Projected Move:
Expecting a short-term pullback into the demand zone (previous structure area).
Anticipating bullish continuation afterward with the target being the liquidity sweep above the Weak High.
The area around 4,150 appears to be the TARGET for this next impulsive move.
Key Zones to Watch:
Demand Zone: Between 4,050 – 4,075 (watch for bullish confirmation if price pulls back).
Liquidity Target Zone: Above 4,128.210 (Weak High), aiming for a stop-hunt/liquidity grab.
Strategy: Smart Money Concepts (SMC)
Watch for bullish price action at the demand zone.
Wait for confirmation (e.g., BOS on lower timeframes) before entering long positions.
Timing:
Setup likely to play out within the next 24–48 hours based on current 1H structure.
