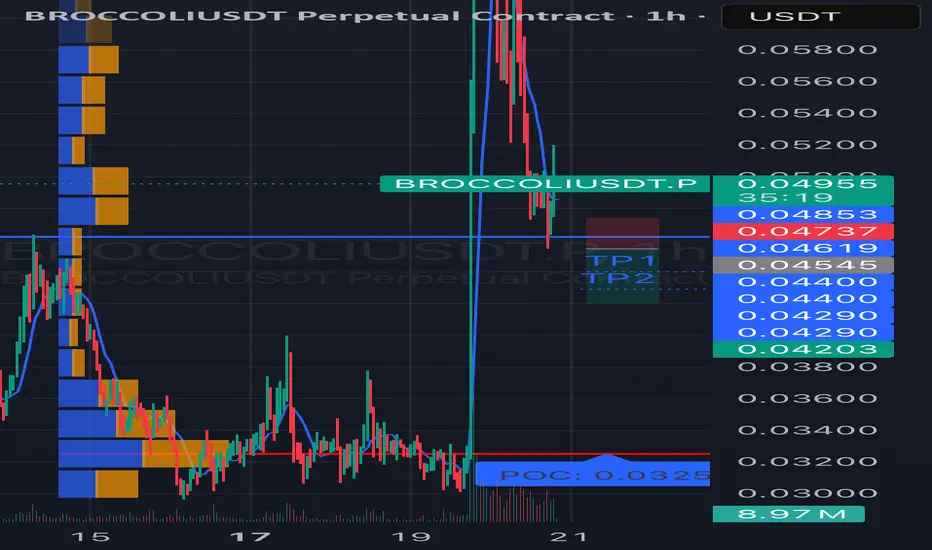
#BROCCOLIUSDT is showing bearish potential SHORT BYBIT:BROCCOLIUSDT.P from $0.04545
🛡 Stop Loss: $0.04737
🕒 Timeframe: 1H
⚡️ Overview:
➡️ BYBIT:BROCCOLIUSDT.P is showing bearish momentum on the 1-hour timeframe after a significant drop from $0.06000 to the current consolidation zone of $0.4203–$0.4885.
➡️ The price recently tested the $0.04545 level (a possible retest of a broken support, now acting as resistance), which could serve as an entry point for a short.
➡️ The volume profile on the left shows strong buyer interest at $0.0325 (POC), which acts as a key support level. However, the lack of significant buying volume at current levels suggests potential for further downside.
➡️ The price structure remains bearish: lower highs and lows are forming after the drop.
➡️ The RSI (14) indicator on the 1H timeframe is presumably around 45 (based on price action), indicating neutral momentum with room for a downward move.
🎯 Take Profit Targets:
💎 TP 1: $0.04400
💎 TP 2: $0.04290
💎 TP 3: $0.04203
⚡️Plan:
➡️ Entry: Sell below $0.04545 after the 1-hour candle closes below this level to confirm the rejection from resistance.
➡️ Stop Loss: Set at $0.04737, which provides a 7% risk from the entry point and protects against a potential breakout.
➡️ Risk/Reward Ratio: From 1:2 (for TP1) to 1:5 (for TP3), making this trade attractive from a risk management perspective.
➡️ After the drop, the price has stabilized, indicating possible consolidation or accumulation.
➡️ Resistance zone: $0.04885 (upper boundary of the current range).
Technical Indicators:
➡️ The chart shows candles in red and green, reflecting bearish and bullish movements.
➡️ After the sharp decline, the price has formed lower highs and lows, but in recent hours, there’s an attempt at recovery.
📢 A price rejection below $0.04545 with increasing selling volume increases the likelihood of reaching the targets.
📢 The $0.04400 and $0.04290 levels may act as areas for partial profit-taking, so monitor price action in these zones.
📢 Risks: If the price breaks above $0.04885, it could signal a false breakdown and a potential reversal to the upside. In this case, consider reassessing the position.
📊 The decline in BYBIT:BROCCOLIUSDT.P aligns with cautious sentiment in the crypto market.
📊 As of March 20, 2025, BYBIT:BTCUSDT.P is trading around $90,000, showing signs of consolidation, which may pressure altcoins like BYBIT:BROCCOLIUSDT.P
BYBIT:BROCCOLIUSDT.P is showing bearish potential on the 1H timeframe.
⚡️A confirmed rejection below $0.04545 is your signal to act!
Supportandresitance
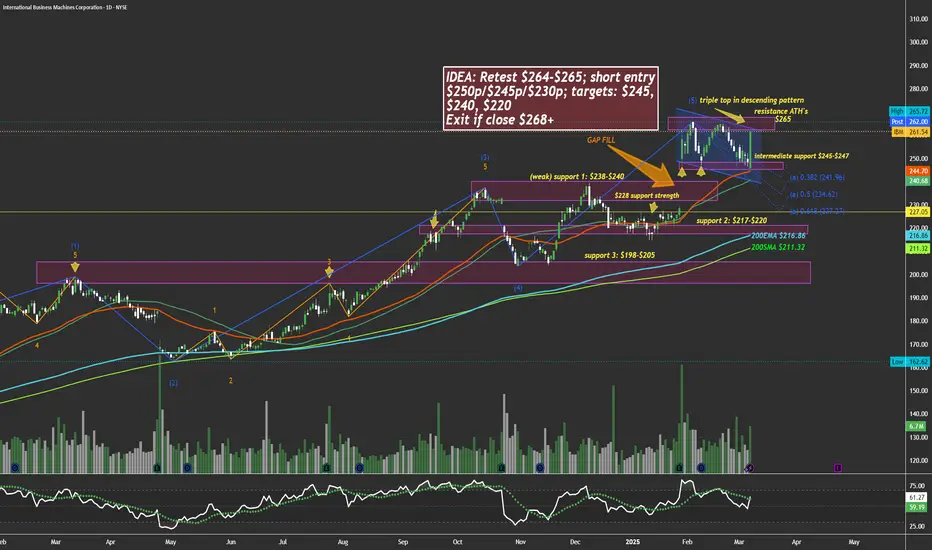
$IBM too hot, due for a chillHi, constructed a chart here showing many levels. I personally think NYSE:IBM will face some downside weeks to come. My trade plan is written in the idea box. The two lines that aren't labeled are 50ema and 50sma.
WSL
Charting the Path Forward: Key Levels to WatchPrevious Analysis: Successful Bullish Breakout
In our previous analysis, we identified a Falling Wedge pattern accompanied by bullish divergence, forecasting a breakout above 147.807. The price hit our target, confirming the bullish momentum and reaching key Fibonacci levels.
What’s Next:
Upon analyzing the chart, we observe that price has found support at 147.535 after a pullback during the American session. We anticipate the price to reach our first target, and after consolidation and a possible pullback, we expect to hit our second target near the upper line of the channel.
However, if the price declines from the first target and breaches support at 147.535, the next key support level is at 146.306.
Remember to follow your risk management strategies to protect your capital.

UsdJpy buy continuation Taking Yesterday's low as Inducement my point of interest is 149.034. I'm anticipating price to retrace back to that zone before pushing toward.
Kindly boost if you find this insightful 🫴

Alts- Will they drop further? (+name your alt)In my early February analysis on altcoins , I noted that while a bounce was likely after the sharp drop triggered by Trump’s initial tax remarks, the $1.3T level would act as strong resistance.
I expected another decline once this resistance was confirmed— which is exactly what happened, as the market reached that level and began to drop again.
After multiple tests of the rising trendline that began in October 2023, last week saw a breakdown, with price finding support just above $900B (an important level as we can see from the posted chart).
But was that the full extent of the drop?
In my view, we are far from being in the clear, and further declines seem likely. Technically, the rising trendline has been broken, and the recent rebound appears to be corrective rather than the start of a sustained recovery.
As long as the price remains below the $1.15T–$1.2T zone, I see a high probability of the market
breaking under 900B zone support and reaching $700B in the coming months.

The game plan is clear: DCA,accumulate, and let the market work!HKEX:2800
Breakthrough downtrend channel on last Sept2024 and W-Chart formed MACD Goldencross for bullish mode.
If enter now at 24.50
Target Profit 1 Level at : 30.70 (~25.3%)
Target Profit 2 @33.50; another ~9% (cumulative + ~36%)
Target Profit 3 : ATH
Continue to DCA and accumulate; you may wait for slight retracement to add position. 24.26
Time frame : 9-24months
It created higher hi recently for W chart.
🔎 DYODD and don't listen to anyone. Invest in yourself, do some study and learn along the way while you trying to verify or finding the answer if to start invest in CHN/HKG markets.
Follow your trade plan then zen with 📙 and 🍵 while waiting for profits to be reazlied.
** Please Boost 🚀/LIKE 👍, FOLLOW ✅, SHARE 🙌 and COMMENT ✍ if you enjoy this idea! Share your trading journey to encourage the trading buddies.

GBPJPY Trade Analysis**GBP/JPY 15-minute chart**
**Trade Analysis & Idea:**
📉 **Previous Downtrend**: The pair experienced a strong drop before finding support around **191.400**.
📈 **Current Recovery**: Price is now rebounding and trading above short-term moving averages (blue & red EMA).
🔄 **Resistance Zone**: The **192.000 - 192.200** area may act as resistance for further upside.
### **Potential Trade Setups:**
1️⃣ **Bullish Continuation**:
- If price **breaks & closes above 192.000**, we could see further upside towards **192.400 - 192.600**.
- A strong candle close above resistance would confirm bullish momentum.
2️⃣ **Rejection & Pullback**:
- If price struggles to hold above 192.000, a pullback toward **191.700 - 191.500** is possible.
- Look for **bearish candlestick patterns** (e.g., rejection wicks, engulfing candles) to confirm a short opportunity.
### **Risk Management:**
✅ Secure partial profits at key levels.
✅ Use **tight stop-loss** below **191.700** for longs or above **192.200** for shorts.

EURGBP - Approaching Key Resistance: Is 0.8370 the next target?OANDA:EURGBP is nearing a key resistance level that has previously acted as a strong barrier, triggering bearish momentum in the past. This zone also aligns with prior supply areas where sellers have stepped in, making it a potential point of interest for those looking for short opportunities. Given its historical significance, how price reacts here could set the tone for the next move.
If bearish signals emerge, such as rejection wicks, bearish candlestick patterns, or signs of weakening bullish pressure, I anticipate a move toward the 0.83700 level. However, a clear breakout above this resistance could challenge the bearish outlook and open the door for further upside. It's a pivotal area where price action will likely provide clearer clues on the next direction.
Just my take on support and resistance zones, not financial advice. Always confirm your setups and trade with a proper risk management.

AUDUSD – LONGAUDUSD – LONG
ENTRY PRICE - 0.62850
SL - 0.61800
TP - 0.64900
Always follow the 6 Golden Rules of Money Management:
1. Protect your gains and never enter into a position without setting a stop loss.
2. Always trade with a Risk-Reward Ratio of 1 to 1.5 or better.
3. Never over-leverage your account.
4. Accept your losses, move on to the next trade and trust the software.
5. Make realistic goals that can be achieved within reason.
6. Always trade with money you can afford to lose.
Please leave your comment and support me with like if you agree with my idea. If you have a different view, please also share with me your idea in the comments.
Have a nice day!

Falling Wedge Breakout in Play? Key Levels to Watch!After analyzing the chart across multiple timeframes, we have identified a Falling Wedge pattern, signaling a potential bullish breakout. Additionally, bullish divergence is visible on most timeframes, reinforcing the likelihood of upward momentum.
Currently, the price is trading above a strong support level at 146.213, indicating a solid base. Our nearest resistance stands at 147.807—a breakout above this level could pave the way for further gains. The next key targets align with the 38.2% and 50% Fibonacci retracement levels, offering potential profit opportunities.
As always, stick to your risk management strategy to protect your capital. Stay disciplined and trade wisely!

The Steps to Identify Key Levels on Chart Scalping Opportunity)**The Steps to Identify Key Levels on Chart:**
1. **Support & Resistance:**
- Identify areas where the price has bounced multiple times.
- Based on your chart, key **support** seems around **2900**, while **resistance** could be near **2925-2930**.
2. **Trendlines:**
- Check if highs/lows are forming a triangle pattern.
- If lower highs and higher lows appear, it could be a **symmetrical triangle** (potential breakout).
3. **Moving Averages & Volume:**
- The **moving averages (EMA)** are close together, suggesting consolidation.
- Look for a volume spike near breakout points (above 2925 or below 2900).
### **Possible Chart Pattern Scenarios:**
- If price **breaks above 2925-2930 with volume**, it could be a **bullish breakout**.
- If price **drops below 2900**, it may confirm a **bearish breakdown** (continuation down).
- If price keeps bouncing between 2900-2925, it's likely **range-bound** (scalping opportunity).

Euro can rebound up from support line to 1.1000 pointsHello traders, I want share with you my opinion about Euro. Looking at this chart, we can see that a few days ago, the price entered a range, where it immediately broke through the 1.0425 support level, which aligned with the buyer zone, and then moved to the upper part of the range. After trading near this area for some time, the price dropped back to the buyer zone, reaching the support line before starting to rise again. Soon, the Euro broke the 1.0425 level once more and later exited the range, continuing its upward movement. Not long after, the price climbed to the 1.0805 support level, which coincided with a support area. It traded around this level for a while before breaking through it as well. Following that, the Euro reached the resistance line, reversed, and corrected back to the support area, where it found support again. Recently, it rebounded and started moving upward. Given this, I expect a further rebound from the support line and a breakout above the resistance line. Based on this scenario, my TP is set at 1.1000 points Please share this idea with your friends and click Boost 🚀

US30 (Dow Jones) 4H & 1H Analysis US30 is currently trading in a well-defined downward channel, making lower highs and lower lows. The next critical support sits near the 31,880 “Major Low,” where any decisive break could lead to further downside. On the upside, watch for a potential bullish bounce targeting the fair value gap and Fib confluence around 32,400–32,500. A breakout above the channel top may signal a trend shift, while a rejection there would likely keep the bearish momentum intact. Always monitor price action and manage risk around these key levels.

NVDA $90 PRISONAs last time we were stuck within the $90 range I can see a previous order block that was created and retested making it invalid. I am considering regardless this area of $91/94 as a good demand area. Not only the sentiment of the fanatics is that it is a discounted price at $90. But speculations are already running online that once they reach this area, they need to load up to head to $130.
This is a good sentiment to capitalize both on the movement down and the bounce.
The good traders do not become "fans" of a company. We just capitalize on fanatic sentiments to get their money as any good record label would with their artist.
Ladies and gentlemen, NVDA is our artist for this week concert.
Let us capitalize on the fans and hope they request an encore.

TSLA’s Failed Breakout: Reversal or Deeper Drop Ahead?Tesla (TSLA) Market Outlook & Long-Term Investment Report
Tesla (TSLA) has positioned itself as more than just an electric vehicle (EV) manufacturer. With its advancements in robotics, artificial intelligence (AI), autonomous driving, and energy solutions, Tesla is becoming a major player in multiple high-growth industries. While recent price action has shown volatility, long-term investors see buying opportunities at key support levels.
Technical Analysis & Key Levels
1. High-Timeframe Context (HTF)
- HTF Resistance: $415.71 – Tesla attempted to break above this level but faced rejection, leading to a sharp pullback.
- Major Support & Resistance Zone – A critical level where Tesla has previously consolidated and reacted strongly.
- Liquidity Zones (LQZs):
- Daily LQZ (~$238.18) – A key demand area where buyers could step in.
- Weekly LQZ (~$182.44 - $108.01) – A deeper liquidity zone, potentially offering even better long-term buying opportunities if the downtrend continues.
2. Market Structure & Trend Analysis
- **Failed Breakout:** Price action showed a breakout above resistance, but the failure to hold led to a sharp reversal, indicating a potential liquidity grab.
- **Retest of Support:** The price is currently testing a significant support level, which will determine the next move.
- **Momentum Shift:** The aggressive rejection at HTF resistance suggests sellers are in control in the short term, but this creates long-term entry opportunities.
Long-Term Investment Thesis
Tesla's expansion into AI, robotics, and autonomous technology presents significant long-term growth potential beyond its traditional automotive business. Here are the key areas driving Tesla's future:
1. Robotics & Artificial Intelligence
- **Tesla Optimus Robot:** Tesla’s humanoid robot project is expected to revolutionize industrial automation. It could become a major revenue source as industries move toward AI-driven labor solutions.
- **Neural Networks & AI Advancements:** Tesla’s AI systems, used for Full Self-Driving (FSD), are also being adapted for robotics, increasing its competitive edge.
2. Energy & Infrastructure Expansion
- **Solar & Energy Storage:** Tesla’s **Megapack** and **Powerwall** businesses are growing as renewable energy adoption accelerates.
- **Grid-Scale Energy Solutions:** Tesla’s energy division could play a crucial role in stabilizing power grids worldwide, providing another strong revenue stream.
3. Autonomous Vehicles & FSD
- Tesla’s **Full Self-Driving (FSD)** software could create a high-margin subscription-based revenue model.
- The potential for a **Tesla Robotaxi network** could disrupt the ride-sharing industry and unlock new business models.
4. Synergies with SpaceX & AI Computing
- Tesla benefits indirectly from advancements in **SpaceX** technologies, such as materials science and AI computing.
- The **Dojo supercomputer** is being developed to enhance AI training, which could accelerate Tesla’s robotics and self-driving ambitions.
Investment Strategy & Accumulation Plan
For long-term investors, Tesla's volatility provides attractive buying opportunities. A strategic approach would involve:
1. Key Accumulation Levels
- **Daily LQZ (~$238)** – A strong support zone where Tesla could see renewed buying interest.
- **Weekly LQZ (~$182-$108)** – A deeper level that may offer excellent long-term value if the price declines further.
2. Dollar-Cost Averaging (DCA) Strategy
- Instead of trying to time the absolute bottom, investors can **ladder buy-ins** at different liquidity zones to optimize their cost basis.
- This reduces risk and takes advantage of market dips without excessive exposure.
3. Risk Management & Long-Term Horizon
- Tesla is known for its volatility; maintaining **a long-term vision (5+ years)** is crucial for maximizing gains.
- Investors should be prepared for short-term fluctuations while focusing on Tesla’s multi-industry expansion.
Conclusion
Tesla’s failed breakout and recent pullback present a strategic buying opportunity for long-term investors. With its advancements in robotics, AI, energy, and autonomous technology, Tesla is well-positioned to be a key player in multiple trillion-dollar industries over the next decade. The current price action suggests that accumulation at liquidity zones could provide strong long-term returns.
As the robotics industry grows, Tesla’s potential as a leading producer for industrial automation is increasingly clear. Investors with a bullish long-term outlook may find current and upcoming dips as prime entry points.
Final Thought
**Is Tesla’s current dip a gift for long-term believers?** With its expanding technological footprint, this may be an opportunity to accumulate before the next major growth cycle. 🚀

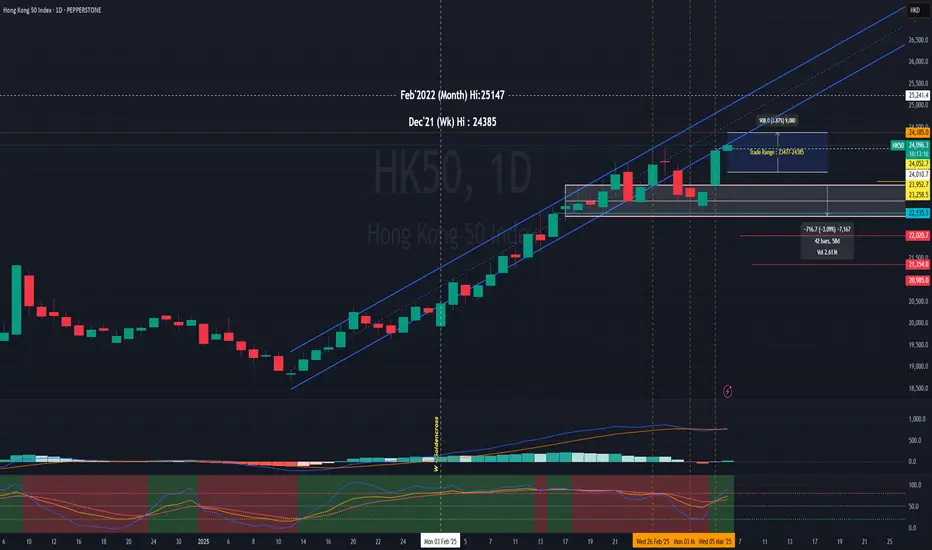
GPS recalculating, HSI is finding its way back to the bull routePEPPERSTONE:HK50
D chart : it tries to returning into uptrend channel.
HSI:HSI
D Chart
We look forward to see it at 24192, 24385! Let's continue to monitor.
W Chart PEPPERSTONE:HK50
in 1H 4H chart mentioned the Index is intact and in the Bullish runway!
Look at longer term and trade zen-ly!
Cultivating and nurturing your trading mindset:
Pay attention to your trading strategy becoming a great trader but not profits from one trade.
Happy Trading Everyone.
** Please Boost 🚀/LIKE 👍, FOLLOW ✅, SHARE 🙌 and COMMENT ✍ if you enjoy this idea! Share your trading journey to encourage the trading buddies *
Platinum at Key Support Zone – Will Buyers Step In?OANDA:XPTUSD is approaching a significant support zone, marked by prior price reactions and strong buying interest. This area has previously acted as a key demand zone, increasing the likelihood of a bullish bounce if buyers step in.
If the price confirms support within this zone through bullish price action—such as long lower wicks or bullish engulfing candles—we could see a reversal toward 978.700, a logical target based on previous market structure and price behavior.
However, if the price breaks below this support zone and sustains, the bullish outlook would be invalidated, potentially leading to further downside.
Just my take on support and resistance zones—not financial advice. Always confirm your setups and trade with solid risk management.
Best of luck!

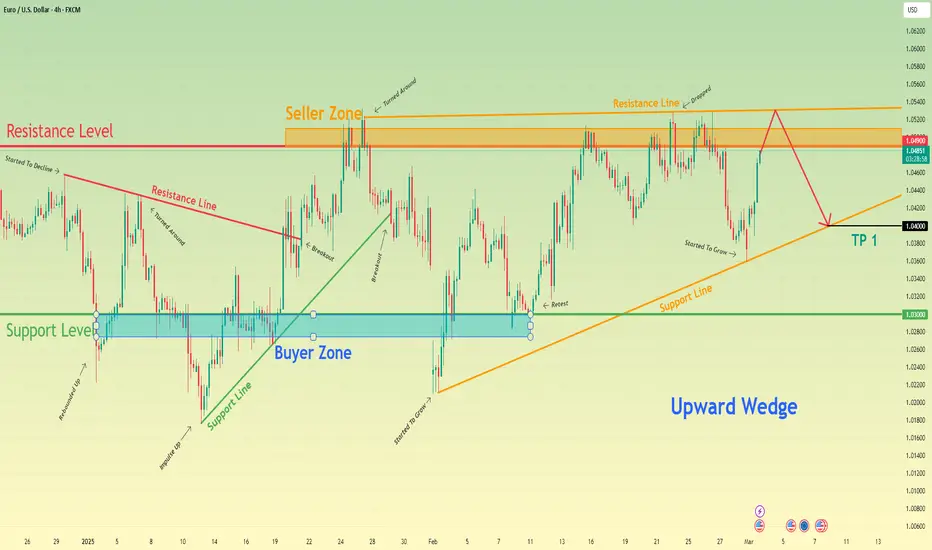
Euro can reach resistance line of wedge and then drop to $1.0400Hello traders, I want share with you my opinion about Euro. Observing the chart, we can see that the price reached the resistance line before beginning to decline. Shortly after, the Euro dropped to the support level, aligning with the buyer zone, then rebounded back to the resistance line before falling again and breaking below the 1.0300 level. Following that, the Euro made a strong upward move, pushing past the resistance level and briefly entering the seller zone. However, the price quickly reversed and started declining within a wedge pattern, eventually breaking through the support line as well. It then fell to the lower boundary of the wedge, forming a gap before beginning to climb again. Not long after, the Euro broke above the 1.0300 level, retested it, and surged toward the resistance level, where it immediately re-entered the seller zone. After some consolidation in this area, the price dropped back to the wedge’s support line, breaking below 1.0490 once again. Recently, however, it rebounded and is now trading near the 1.0490 resistance level. From my perspective, the Euro has the potential to rise toward the wedge’s resistance line, breaking above the resistance level before reversing downward. If that happens, I expect the price to break below 1.0490 again and continue falling toward the wedge’s support line. That’s why I’ve set my TP at 1.0400, as it aligns with this key level. Please share this idea with your friends and click Boost 🚀
Gold may continue to fall inside downward wedgeHello traders, I want share with you my opinion about Gold. A short while ago, the price dropped to the support line, breaking through the resistance level that aligned with the resistance area. Following this, it rebounded and quickly climbed to the 2935 level, even entering the seller’s zone before pulling back to the support line. After that, the price made another push toward the seller’s zone but remained range-bound near the 2935 resistance level. Eventually, it reversed and began to decline, first breaking below 2935 and soon after breaching the support line as well. Gold then continued its downward movement within a falling wedge pattern. Inside this formation, the price touched the support line before rebounding to the resistance line, where it hovered for a while before eventually dropping back to the wedge’s support line, breaking the current resistance level along the way. At the moment, XAU is still moving lower, but I anticipate a temporary rise toward the resistance area before the decline resumes. Given this scenario, I have set my TP at 2830, which aligns with the wedge’s support line. Please share this idea with your friends and click Boost 🚀

BTC DOMINANCE 19 MAY ALTCOIN SEASONN !!!I expect BTC dominance to break downward by May 19. I believe dominance will touch 64% and then decline. We are very close to ALTCOIN SEASON—buckle up and keep an eye on the chart!
BOOOOMMM

Bullish behaviour on NEM stockThe price of Newmont Corporation shares retraced to the areas where professional buying took place in the past (blue rectangles). The volume during that move down is decreasing, which, according to Volume Spread Analysis (VSA), is bullish behaviour.
Also, given that today's bar penetrates the recent demand zone and the professionals were buying there again, this stock looks very strong and has a high chance of reversal.
Closing above the $43.72 level followed by its testing on daily or lower (1H, 15 minutes) timeframes might start the rally towards $55.13 - $55.89 with resistance around $49.27 - $50.12.
If today's bar is tested and supply reappears during this process, we may expect an extension of the ongoing correction to the $37.53 - $38.37 area and another surge of buying there.

Euro can reach resistance level, break it and continue to growHello traders, I want share with you my opinion about Euro. A few days ago, the price entered a wedge pattern, where it immediately rebounded from the support line into the seller's zone. It then started to decline, quickly dropping to the 1.0355 support level, which aligned with the buyer's zone. Following this, the Euro experienced a sharp gap down, breaking out of the wedge and falling below the support level. However, it soon reversed direction and began to rise, reaching the support level again and breaking through it. After that, the Euro continued moving upward within the range formed by the resistance and support lines. It first corrected to the support line before making a strong push toward the support-turned-resistance level. After breaking it and completing a retest, the price climbed further to the resistance line. From there, it briefly pulled back before making another upward move, reaching the seller's zone, which coincided with a key resistance level. The price consolidated near this level for some time before dropping to the support line. However, not long ago, it rebounded and started to rise again. In this scenario, I expect the price to continue its upward movement toward the resistance level. If it manages to break through, a retest could follow before further growth. Based on this, I have set my TP at 1.0580. Please share this idea with your friends and click Boost 🚀

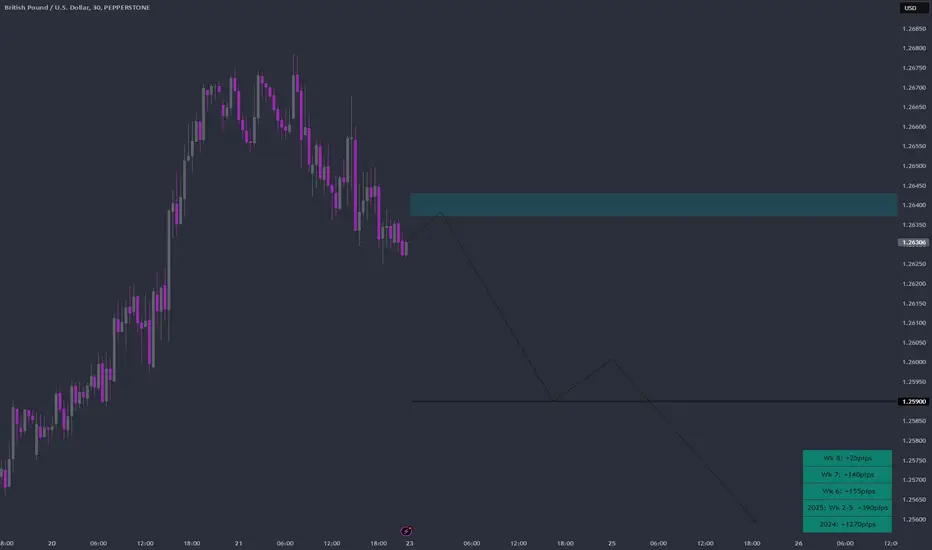
GBPUSD Week 9 Swing Zone/LevelsLast week saw a few pinched pips and also few losses. This highlights the benefit of having a good risk to reward ratio.
Weekly zone and levels are mapped based on previous week daily high-low relationship (ie Monday HL in relation to Tuesday in relation to Wednesday HL, etc). This generates a fairly accurate levels with actual price action determining trades.
SL, stoploss is usually btw 10-15pips
TP, Takeprofit is 5-10x that, with sl moving to BE, breakeven once trade pinches +20pips.