BTCUSDT vs DXY - Pro Bitters or Dolly?DXY touching a Monthly resistance in a Rising Wedge. Bitters Weekly support in a Pennant. Bitters also in a Falling Wedge. Bias bitters (BTCUSDT) to the upside. BTC Weekly also local CC 0.618.
DXY close above Weekly 104.650 will be a Game Changer. Possibly, probably push BTC down a notch. Will be looking at the pwLow approx. 23,415 .. Monthly 23, 300.
Supportresistace

XAUUSD My analysis for rest of day : v2So here is my 2nd analysis using a separate set of 2 main tools and a 3rd which is sometimes switched out with any indicator I might come across and feel the urge to give it a try but otherwise its mainly EngulfingCandle and Fluid Trades - SMC
Anyone else use these indicators and if you have/are, what settings and assets do you find works best for you?

BTCUSDT - Trading Range (Retest)2Hour Chart - UTC+1
My best effort attempting to draw a trading range that the price if currently retesting to enter back into the range. Will create a separate chart idea for a possible trading range should we continue to the upside.
Trading range:
Bottom 21,500 Top 24,300 and Middle 22,900. At the time of writing, possible retest of the top of the range. Not having yet hit the weekly at 24,295 could possibly be a signal for a front run however, levels between this weekly and daily levels above seem to be well respected. * The weekly was tapped. Nice reaction, lots a resistance above after recent daily action.
Fibs:
Fib Channel from low on Saturday 14 Jan at 11:00, to low Mon 13 Feb at 17:00, to higgh Thurs 2 Feb at 01:00.
Fib Retracemet from low Mon 13 Feb 2022 at 17:00 to high Thurs 16 Feb at 17:00. Interesting level is 0.618 about mid of the channel including a daily an nPoc.
Assumptions:
All monthly, weekly, daily, and nPoc Horizontal rays act as support and resistance levels. Support when price is above and resistance on price action below. Fib channel also used for indication of past and present possible support/resistance levels.
My bias:
Bullish for a break to the upside. Plenty of price discovery above should the range be broken to the upside. Although bias I'm always trading the levels as they come.

AUDUSD Long Term Predictions (4H Chart)Technical Analysis Summary
AUD/USD
TREND ANALYSIS
We have 1 Uptrend Trend in Green (Long Term)
Be careful trends need to be modified when broken to the new peaks(Downtrend) and lows (Uptrend).
FUTURE PREDICTIONS
We have many resistance and support levels that I have mentioned above.
I use thickness as an indicator of strength of levels (ONLY FOR VISUALS).
White Levels are levels that represent tight stoplosses or support and ressitance levels from the past to show old publications.
Good luck everyone, stay safe!
If you need help don't hesitate to send me a message or comment
If you find this content beneficial please don't forget to LIKE and FOLLOW
Trading Involves High Risk
Not Financial Advice
Exercise Proper Risk Management

Hope this video bless you!keep forex simple and dont do short cuts in your journeys stay in process in learning your only forex strategy don't keep changing it will create confusing and only have couple pairs tat you are willing to learn! God bless you stay safe

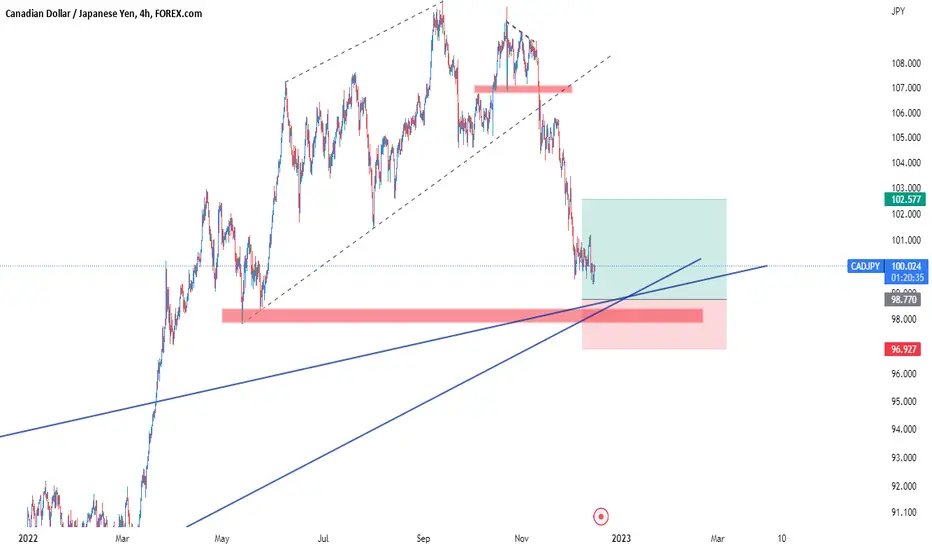
cadjpy 4hHello friends, I am waiting for the cadjpy to reach the desired range to open a buy position
Tue 22nd November 2022 Daily Forex Charts : 7x New Trade SetupsGood morning fellow traders. On my Daily Forex charts using the High Probability & Divergence trading methods from my books, I have identified 7x new trade setups this morning. As usual, you can read my notes on the chart for my thoughts on these setups. The trades being a AUD/CAD Sell, AUD/USD Sell, GBP/JPY Buy, GBP/NZD Buy, USD/CAD Buy, USD/JPY Buy & XAU/USD (Gold) Sell. A few of these are higher risk and there is obviously some correlation here, so be aware of risk % per trade and overall risk. Enjoy the day all. Cheers. Jim

EURGBP D1 shortZigzag at D1 not yet appear.
Price now Fibonacci D1 passed 61%.
So it is possible to continue the movement to the nearest support.
Sell limit at 8630.

$ENSG poised to go higher from here?Notes:
* Very strong up trend on the weekly/monthly charts
* Great earnings for the past few years
* Basing for the past 19 months
* Creating a cup and handle
* Trying to break out of the handle
* Strong resistance around the $85.4 area
Technicals:
Ticker: $ENSG
Sector: Healthcare - Medical Care Facilities
Relative Strength vs. Sector: 28.52
Relative Strength vs. SP500: 11.74
U/D Ratio: 1.15
Base Depth: 36.29%
Distance from breakout buy point: -9.18%
Volume 16.02% above its 15 day avg.
Trade idea:
* Not jumping into this just yet.
* Waiting to see if it can stay above the $85.4 area and hold it as support.

Fri 30th September 2022 Daily Forex Charts : 7x New Trade SetupsGood morning fellow traders. On my Daily Forex charts using the High Probability & Divergence trading methods from my books, I have identified 7x new trade setups this morning. As usual, you can read my notes on the chart for my thoughts on these setups. The trades being a EUR/JPY Buy, EUR/USD Buy, GBP/AUD Buy, GBP/JPY Buy, GBP/NZD Buy, GBP/USD Buy & NZD/CAD. A few of these are high risk and there is obviously a lot of correlation on the GBP pairs, so be aware of risk % per trade and overall risk. Enjoy the day all. Cheers. Jim

BTC/USDT 4H 22.09.19Hello crypto community and my followers, please if you like ideas do not forget to support it with your like and Comment and share with your friends, thank you so much
Now I'm waiting for this scenario.
I really hope this will be useful for you.
Be ready and take care your money. Have a great profit !
plan A (white) : 19500 goes to 17614 .16227
plan B (orange) : if 20226 break up , goes to 21700
📅 22.09.19
📌

Eyes on the support play Watching USD/CAD this morning to see how it handles this recent inflection level.
Looking for price to make a clean support/resistance play before taking an entry.

EUR/USD Short-Term Rebound!• The weekly S1 (0.9880) provided support for the EUR/USD, which has since attempted to close the gap. It has encountered resistance at 0.9935 and currently appears to be unsure. It might shift sideways in the near future.
• Price declines are still possible as long as the pair remains below the descending pitchfork's Resistance Trendline, signaling a bearish bias. A new sell-off could be announced if the gap is not closed. Only a valid breakout above the Resistance Trendline could signal a larger growth.
Good Luck Traders!

EURCAD 2Hello to all friends
An analysis on a 2-hour timeframe for scalper traders.
Enter the trade with your analysis.

BTC/USDT 4h 02.08.22 Hello crypto community and my subscribers, please if you like ideas do not forget to support it with your like and comment, thank you so much
Now I'm waiting for this scenario.
I really hope this will be useful for you.
Be ready and take care your money. Have a great profit !
📅 02.08.22
📌

Banknifty 15th July 2022. Analysis For Tomorrow.Banknifty, 15th July 2022 updated chart levels for tomorrow in 15 min timeframe.

BTC/USDT 2h 29.06.22 FUTURES TRADEHello everyone, if you like the idea, do not forget to support with a like and follow.
long ( 18x ) 😉
Entry price : 20000
LONG :
Tp : 21800 %162 18x
📅 29.06.22
📌

NZDCHFHello dear friends. My analysis of this currency pair in 1 hour time frame. It is up to you to check it

BTC/USDT 2h 22.06.22Hello crypto community and my subscribers, please if you like ideas do not forget to support it with your like and comment, thank you so much
Now I'm waiting for this scenario.
I really hope this will be useful for you.
Be ready and take care your money. Have a great profit !
📅 22.06.22
📌

BTC LONG TERM : IS IT READY TO PUMP ???Hello !!
Welcome to the quick update of BTCUSDT. It was trading in the range of 37300 to 39800 for a long time. It is still in that channel and I can see a larger bear flag that was about to break but BTC managed to enter the channel again. I think we are still not bullish on BTC as it has a number of resistance that it needs to break before hitting 48000.
The points we need to consider are if BTC breaks R1, R2, and R3 i.e. 40800, 42200, and 43400 respectively. If it manages to break these resistances, it will touch 48000 without any doubt.
I think it's better we wait for the right moment to enter any trade. As of now, all altcoins are pumped around 5 % to 10 % and we may see some retests again. Please be safe with your positions and invest wisely.
This is not financial advice, please do your own research before investing and we are not responsible for any of your losses or profits.
Please like and share and comment on this idea if you liked it.

AUDNZD SHORTPrice can model one of the scenarios.
Personally, I find the downturn scenario more likely


