Bitcoin VOLUME levels - this is NOT a free fallHey fellow traders,
just a reminder to see the big picture... Look at the historical trading volume which is below us (actual price 38,5k atm) and the number of supports from them... Now imagine how much of a sell effort would that be to break all of them? Is it realistic? I feel NOT.
Let's wait what FED will have for us next week, how the markets will react and if Dollar index would bump back off the historical resistance...
GL&HF
Cryptovlcoun
Supportzones

CAD/CHF: Buy i the reaction zoneCanadian Dollar/Swiss Franx show up a good moment to buy in the key supoort around $0.7500 CHF
I buy in the market price and put my Sl to 0.7460 CHF and target to $0.7585 °CHF
Re.ember CAD it's bullish as I sae from Sunday when i made an analysia of this par.

GOLD what is next 💡Based on the chart, the price is close to vital support area ($1920) and our important trend line and resistance area are located on the chart ✔️
if
the price stays above this support zone ($1920) we will see more gain, at least to $1960 🚀
and if
the price breaks the support area to the downside, we will see correction to lower price 📖💡
Please, feel free to ask your question, write it in the comments below, and I will answer.🐋

BNB - possibility of a bull flaghello everyone
In the past month we had the BNBUSDT covering a lot of the chart, we had a bull market (Mar 15-Mar 30), then a reversal pattern with the indication of divergence on RSI(Mar 30- Apr 04),then we had a hanging man candle to tell us the obvious downtrend happening on April 05.But anyway, Now we have a possibility of a bull flag on daily chart. As we all know a trend line with 2 leg's down is a weak one,So ,I expect to see another small down trend on lower time frames until the price hit the trend line.
Our possible ideal down trend will break the 420$ support level, touches the 410$ make a shadow there and goes back up.
key support level the weekly trend line( black one) & 390$(on daily)
key resistance level 440$ (on daily)

Again and Again, up to 756%On daily chart
After surged and created new ATH at nearly 64, BINANCE:WAVESUSDT has been pulling back to 17, perhaps. That level is 0.618 FIB of previous impulse wave.
Right now, WAVES is swinging at 22. A good buying zone in range 22 - 17.
WAVES might be at 144 if it can break ATH.
Wait and see

waxpusdt next target waxp is on support zone .. will go up until the previous resistance on 0.38 -- 0.39
long trade with 30% profit and 2.6 R/R ratio

Bitcoin at Support, We need to bounce from this support area, failure to bounce we may go down to 40 -39K, we have alost 8 hours to daily close! Bulls should fight back

AAVAS looks like reversal Showing strong sign of reversal from Area of Support, RSI - Oversold.
Watch for tomorrow movement - if closes green with confirmation - go long.
Good opportunity stock.
Follow for more ideas and share your thoughts in comment box.

GALAUSDT is testing the supportThe price is testing the daily support after a breakout from the dynamic resistance without volume.
On the 4h timeframe, the price is trying to have a breakout from the dynamic 4h resistance.
How to approach?
IF the price is going to have a breakout from the 4h support on 0.2$ and retest as new resistance, we can add it to our watchlist and wait to apply our rules for open a new short position. The scenario is invalidated if the price is going to have a breakout of 0.24$ with confirmations
––––
Keep in mind.
🟣 Purple structure -> Monthly structure.
🔴 Red structure -> Weekly structure.
🔵 Blue structure -> Daily structure.
🟡 Yellow structure -> 4h structure.

ALGOUSDT is testing the monthly areaThe price is testing a key monthly level of 0.68$ where the price bounced several times. Check the upper chart, the price respected that area.
on the lower timeframe (4H) the price had a false breakout from that area.
How to approach?
If the price is going to confirm the breakout from the monthly support, According to Plancton's strategy , we can set a nice order
–––––
Keep in mind.
🟣 Purple structure -> Monthly structure.
🔴 Red structure -> Weekly structure.
🔵 Blue structure -> Daily structure.
🟡 Yellow structure -> 4h structure.
–––––
Follow the Shrimp 🦐

BTCUSDT is testing the supportThe price is testing the lower trendline on the daily timeframe after a rejection from the 42k resistance.
On the 4h timeframe, the price got a rejection from 0.382 Fibonacci level and created a new Higher low.
The price is looking for a new bounce, and if the price is going to create a new Lower high we could see a new bearish impulse until the weekly support.
How to approach?
IF the price is going to lose the 4h support ton 38k and retest it as new resistance, we can add it to our watchlist and wait for applying our rules.
According to Plancton's strategy , we can set a nice order
–––––
Keep in mind.
🟣 Purple structure -> Monthly structure.
🔴 Red structure -> Weekly structure.
🔵 Blue structure -> Daily structure.
🟡 Yellow structure -> 4h structure.
–––––
Follow the Shrimp 🦐

BTCUSDT is testing the previous support as new resistanceThe price got a rejection from the monthly resistance on 45700$
on the daily timeframe, the price created a double bottom on the monthly area and the price lost the weekly support at 40500$
on the 4h timeframe, the price is losing the support on 38500 after a rejection from 4h structure on 39522.
Now the price is testing the dynamic daily support as new resistance.
How to approach?
IF the price is going to confirm the breakout, we can add it to our watchlist According to Plancton's strategy , we can set a nice order
The next valid support is the weekly one on 34k
The safe place remains the 42k
–––––
Keep in mind.
🟣 Purple structure -> Monthly structure.
🔴 Red structure -> Weekly structure.
🔵 Blue structure -> Daily structure.
🟡 Yellow structure -> 4h structure.
–––––
Follow the Shrimp 🦐

Sun Pharma chart analysis Sun Pharma a great company and a great stock and ofcourse a great chart because of the Russia ukraine war sun Pharma fell towards its money making support line which is going to push this stock upwards and this support line is been followed from 2020 corona crash so I suggest strong buying position for sun Pharma

BTC Needs To Hold This Support!When looking at the chart above, you can see that BTC has managed to climb above support but in the past few days, it has sold off to the current support zone shown by the yellow line. It needs to stay above this line to remain bullish. If it does move below the line, the next area we need to watch is 32.9k. This area was the previous weekly low set a few weeks back and if we can remain above that zone, it is still bullish in my opinion. Let's watch closely.
Don't trade with what you're not willing to lose. Safe Trading, Calculate Your Risk/Reward & Collect!
Love it or hate it, hit that thumbs up and share your thoughts below!
This is not financial advice. This is for educational purposes only.

NZDJPY Buy IdeaD1 - Price is bouncing higher from a key support zone.
Bullish divergence.
No opposite signs.
H4 - Bullish trend pattern.
Until the two strong support zones hold my view remains bullish here.

EURCHF - Looking To Buy PullbacksD1 - Price is bouncing higher from 1.03 psychological level.
Bullish convergence.
Currently it looks like a pullback is happening.
H4 - Higher highs.
No opposite signs.
Until both the strong support zone holds my view remains bullish here.

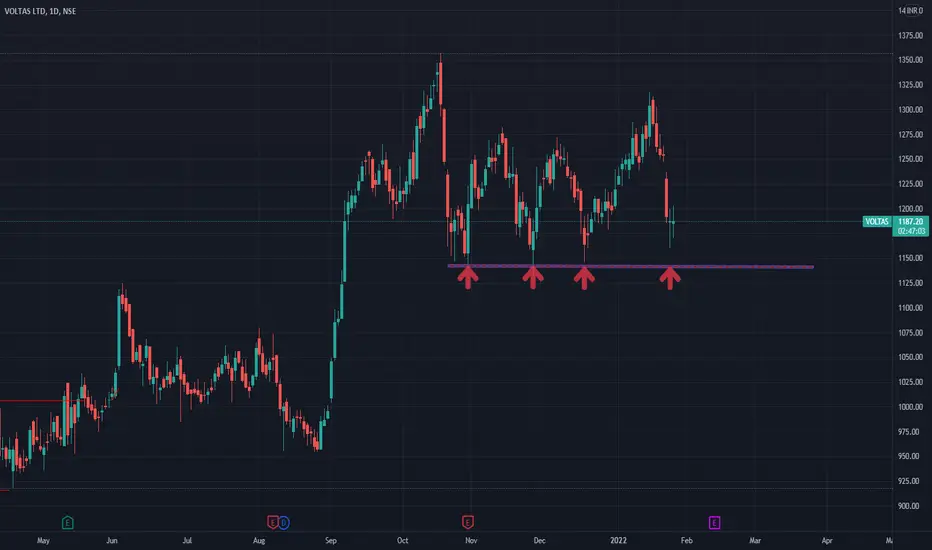
VoltasVoltas is nearing its very strong support zone of 1140, it bounced multiple times in last three months from 1140 levels.
Could be bought here or on dips till 1155-1160 levels & hold with stoploss slightly below 1140 levels for bigger targets of 1250/1300
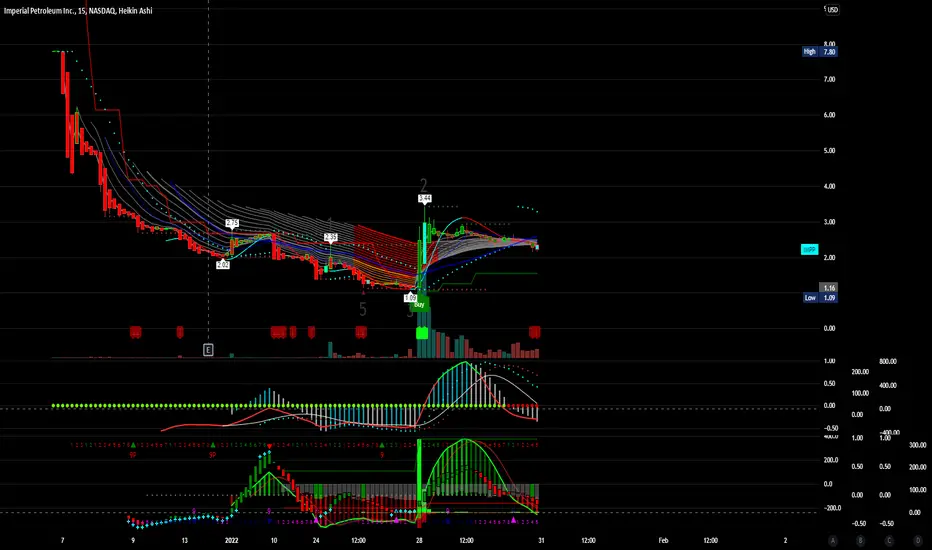
$IMPP Target PT 3.75 and higherImperial Petroleum Inc., together with its subsidiaries, provides international seaborne transportation services to oil producers, refineries, and commodities traders. As of September 30, 2021, it owns and operates cargo fleet with capacity is 255,804 dwt. The company was incorporated in 2021 and is based in Athens, Greece. Imperial Petroleum Inc.(NasdaqCM:IMPP.V) operates independently of StealthGas Inc. as of December 3, 2021.
EURGBP - Looking To Buy PullbacksW1 - Price has reached a strong support zone.
Bullish divergence.
H4 - Higher highs.
No opposite signs.
Until the strong support zone holds I expect the price to continue higher further after pullbacks.

TatasteelTatasteel is trading near 3-4 months supoort zones of 1160. It has given good upmove from these levels in recent past.
Try to buy here & add more on dips till 1080 with stoploss slightly below 1060 for targets of 1150/1200 positionally.

$IMRNImmuron stock rockets after funding by U.S. DoD of new research agreement
Shares of Immuron Ltd. IMRN, +46.18% rocketed 49.6% in active premarket trading Wednesday, after the Australia-based biopharmaceutical company said it received an award of AUD$6.2 million ($4.5 million) from the U.S. Department of Defense to evaluate Travelan for military use. Trading volume spiked to 1.3 million shares, compared with the full-day average of about 60,500. The award is aimed at testing the efficacy of a single larger dose regimen of Travelan for the treatment of moderate to severe diarrhea upon challenge with enterotoxigenic Escherichia coli (ETEC). "This new project expands our clinical development program and represents the first of several significant clinical trials which the Company expects to undertake with the US Military in 2022," said Immuron Chief Executive JErry Kanellos. "The new funding is testament to the value proposition our hyperimmune bovine polyclonal colostrum technology offers to benefit the US Military as well as the civilian international travelling population." The stock has tumbled 30.1% over the past three months while the iShares Biotechnology ETF IBB, -1.11% has declined 7.2% and the S&P 500 SPX, +0.28% has gained 8.3%.

BTC 52k or 30k?BTC is and has been in a bearish trend. I went ahead and mapped out KEY support and resistance zones with the amount of % shown if it decides to move up or down. Since it's currently at support, I can expect to see a bounce here. If the bulls are strong enough, we can see a push to the next resistance, which is around the 52k area. If the bearish pressure continues, then we can expect a move to the 30k area! lets keep it simple and see.
Don't trade with what you're not willing to lose. Safe Trading, Calculate Your Risk/Reward & Collect!
Love it or hate it, hit that thumbs up and share your thoughts!
This is not financial advice. This is for educational purposes only.

LONG on NZD/CADThis pair has a descending triangle and is currently back at the support zone it has not be able to break from previous attempts in the past.
On the lower timeframes (1hr, etc) there is a bounce off of the golden zone of Fibonacci and I am looking for this pair to continue pushing up.
Here is the play I will be taking on this pair:
PAIR = NZD/CAD
ORDER TYPE = MARKET BUY NOW
LOT SIZE = Micro lot (0.01) (0.02)
ENTRY PRICE = 0.86595
STOP LOSS = 0.86120 - 54 PIPS
TAKE PROFIT = 0.87614 - 95 PIPS
