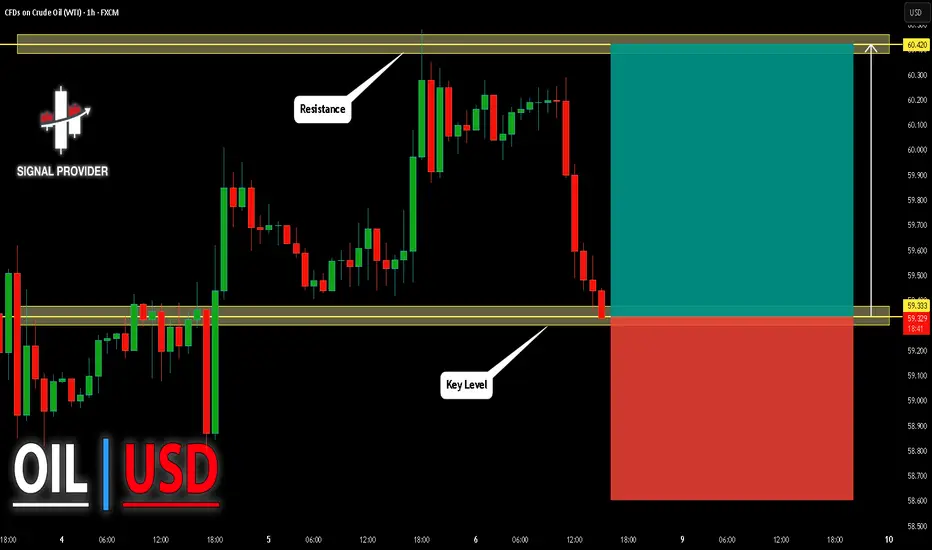
USOIL Will Go Up From Support! Buy!
Here is our detailed technical review for USOIL.
Time Frame: 1h
Current Trend: Bullish
Sentiment: Oversold (based on 7-period RSI)
Forecast: Bullish
The market is approaching a significant support area 59.333.
The underlined horizontal cluster clearly indicates a highly probable bullish movement with target 60.420 level.
P.S
Overbought describes a period of time where there has been a significant and consistent upward move in price over a period of time without much pullback.
Like and subscribe and comment my ideas if you enjoy them!
Swing
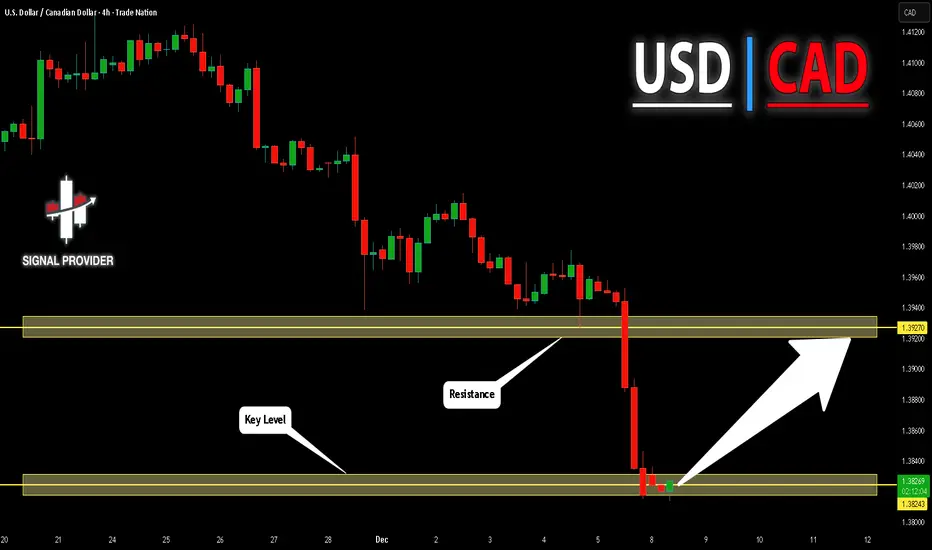
USDCAD Will Go Higher! Long!
Take a look at our analysis for USDCAD.
Time Frame: 4h
Current Trend: Bullish
Sentiment: Oversold (based on 7-period RSI)
Forecast: Bullish
The market is on a crucial zone of demand 1.382.
The oversold market condition in a combination with key structure gives us a relatively strong bullish signal with goal 1.392 level.
P.S
Please, note that an oversold/overbought condition can last for a long time, and therefore being oversold/overbought doesn't mean a price rally will come soon, or at all.
Like and subscribe and comment my ideas if you enjoy them!
EURAUD Will Go Down! Short!
Please, check our technical outlook for EURAUD.
Time Frame: 1h
Current Trend: Bearish
Sentiment: Overbought (based on 7-period RSI)
Forecast: Bearish
The price is testing a key resistance 1.756.
Taking into consideration the current market trend & overbought RSI, chances will be high to see a bearish movement to the downside at least to 1.750 level.
P.S
The term oversold refers to a condition where an asset has traded lower in price and has the potential for a price bounce.
Overbought refers to market scenarios where the instrument is traded considerably higher than its fair value. Overvaluation is caused by market sentiments when there is positive news.
Like and subscribe and comment my ideas if you enjoy them!

US30 Will Move Lower! Sell!
Here is our detailed technical review for US30.
Time Frame: 9h
Current Trend: Bearish
Sentiment: Overbought (based on 7-period RSI)
Forecast: Bearish
The market is trading around a solid horizontal structure 47,967.2.
The above observations make me that the market will inevitably achieve 46,950.2 level.
P.S
We determine oversold/overbought condition with RSI indicator.
When it drops below 30 - the market is considered to be oversold.
When it bounces above 70 - the market is considered to be overbought.
Like and subscribe and comment my ideas if you enjoy them!

NZDUSD Is Bearish! Short!
Take a look at our analysis for NZDUSD.
Time Frame: 7h
Current Trend: Bearish
Sentiment: Overbought (based on 7-period RSI)
Forecast: Bearish
The market is testing a major horizontal structure 0.577.
Taking into consideration the structure & trend analysis, I believe that the market will reach 0.569 level soon.
P.S
Overbought describes a period of time where there has been a significant and consistent upward move in price over a period of time without much pullback.
Like and subscribe and comment my ideas if you enjoy them!

GOLD Is Very Bearish! Sell!
Please, check our technical outlook for GOLD.
Time Frame: 9h
Current Trend: Bearish
Sentiment: Overbought (based on 7-period RSI)
Forecast: Bearish
The market is approaching a key horizontal level 4,198.77.
Considering the today's price action, probabilities will be high to see a movement to 4,117.75.
P.S
Please, note that an oversold/overbought condition can last for a long time, and therefore being oversold/overbought doesn't mean a price rally will come soon, or at all.
Like and subscribe and comment my ideas if you enjoy them!

EURUSD Is Going Down! Sell!
Here is our detailed technical review for EURUSD.
Time Frame: 8h
Current Trend: Bearish
Sentiment: Overbought (based on 7-period RSI)
Forecast: Bearish
The market is approaching a significant resistance area 1.164.
Due to the fact that we see a positive bearish reaction from the underlined area, I strongly believe that sellers will manage to push the price all the way down to 1.160 level.
P.S
The term oversold refers to a condition where an asset has traded lower in price and has the potential for a price bounce.
Overbought refers to market scenarios where the instrument is traded considerably higher than its fair value. Overvaluation is caused by market sentiments when there is positive news.
Like and subscribe and comment my ideas if you enjoy them!

QS V3 Weekly Call Opportunity – MSFT Bullish TrendMSFT Weekly Signal | 2025-12-05
MSFT Weekly Call Option
Direction: Buy Calls (Long / Bullish)
Strike: $482.50
Entry Price: $5.62 – $5.70
Profit Target 1: $8.90 (≈60% gain)
Profit Target 2: $11.20 (≈100% gain)
Stop Loss: $3.90 (≈30% loss)
Expiry: Dec 12, 2025 (7 days)
Position Size: 2% of portfolio
Confidence: 58%
Rationale: Katy AI predicts upward trajectory to ~$497 by Friday; MACD bullish divergence suggests potential multi-day reversal.
Risk Notes: High – Friday expiration with gamma effects; low VIX may reduce premium capture. Monitor actively.

APLD Swing Setup: Bullish Breakout with High MomentumInstrument: APLD
Trade Type: BUY CALLS (Bullish)
Confidence: 65% (Medium Conviction)
Horizon: 14 days (to 2025-12-19)
Strike Focus: $33.00 (Delta: 0.468)
Entry Price: $2.11 (mid of $2.07–$2.15)
Profit Target 1: $3.15 (50% gain)
Profit Target 2: $4.20 (100% gain)
Stop Loss: $1.35 (40% risk from entry)
Position Size: 2% of portfolio
Trend / Momentum:
Katy AI: Strong bullish momentum with 37% single-day surge
Technical Analysis: Current price $31.88 above VWAP $27.58; resistance at $35.94, support at $27.58
Market Context: Broad bullish alignment (SPY & QQQ)
Options Flow / Risk Notes:
Put/Call Ratio: 1.45 → mild bearish hedging, not directional conviction
Risk Level: Moderate – elevated IV (106–112%) increases premium cost
Notes: Momentum breakout may consolidate; monitor follow-through and adjust position size
Competitive Edge / Timing:
Balanced delta strike for time value buffer
Technical breakout with multi-timeframe bullish alignment
14-day expiry gives swing thesis time to develop

GBPUSD Will Go Lower From Resistance! Sell!
Please, check our technical outlook for GBPUSD.
Time Frame: 4h
Current Trend: Bearish
Sentiment: Overbought (based on 7-period RSI)
Forecast: Bearish
The price is testing a key resistance 1.333.
Taking into consideration the current market trend & overbought RSI, chances will be high to see a bearish movement to the downside at least to 1.326 level.
P.S
Overbought describes a period of time where there has been a significant and consistent upward move in price over a period of time without much pullback.
Like and subscribe and comment my ideas if you enjoy them!

USOIL Will Go Lower! Short!
Here is our detailed technical review for USOIL.
Time Frame: 1h
Current Trend: Bearish
Sentiment: Overbought (based on 7-period RSI)
Forecast: Bearish
The market is trading around a solid horizontal structure 59.542.
The above observations make me that the market will inevitably achieve 58.960 level.
P.S
Please, note that an oversold/overbought condition can last for a long time, and therefore being oversold/overbought doesn't mean a price rally will come soon, or at all.
Like and subscribe and comment my ideas if you enjoy them!

BITCOIN Will Go Higher From Support! Buy!
Take a look at our analysis for BITCOIN.
Time Frame: 4h
Current Trend: Bullish
Sentiment: Oversold (based on 7-period RSI)
Forecast: Bullish
The market is approaching a key horizontal level 86,080.52.
Considering the today's price action, probabilities will be high to see a movement to 92,932.85.
P.S
Overbought describes a period of time where there has been a significant and consistent upward move in price over a period of time without much pullback.
Like and subscribe and comment my ideas if you enjoy them!

NZDUSD Is Very Bullish! Buy!
Take a look at our analysis for NZDUSD.
Time Frame: 1h
Current Trend: Bullish
Sentiment: Oversold (based on 7-period RSI)
Forecast: Bullish
The market is trading around a solid horizontal structure 0.571.
The above observations make me that the market will inevitably achieve 0.574 level.
P.S
Please, note that an oversold/overbought condition can last for a long time, and therefore being oversold/overbought doesn't mean a price rally will come soon, or at all.
Like and subscribe and comment my ideas if you enjoy them!

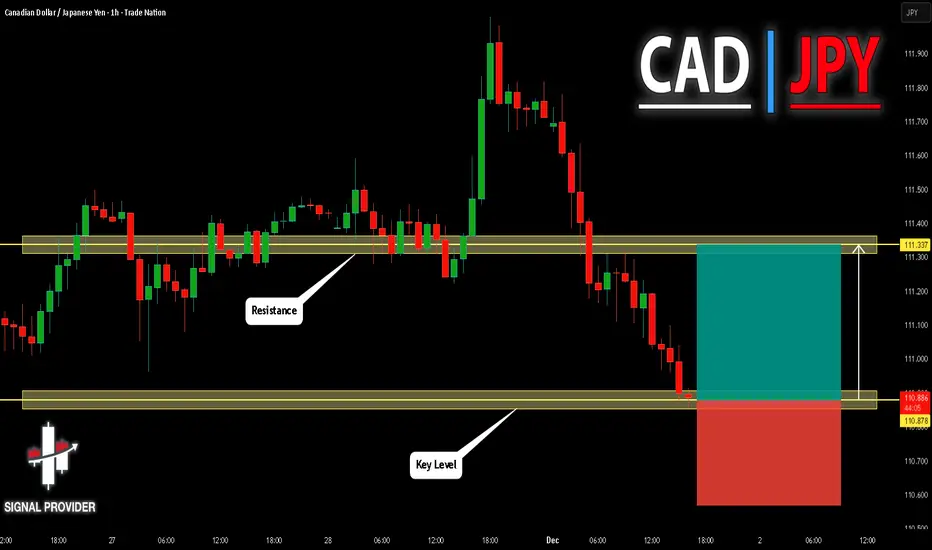
CADJPY Will Go Up From Support! Long!
Please, check our technical outlook for CADJPY.
Time Frame: 1h
Current Trend: Bullish
Sentiment: Oversold (based on 7-period RSI)
Forecast: Bullish
The market is approaching a significant support area 110.878.
The underlined horizontal cluster clearly indicates a highly probable bullish movement with target 111.337 level.
P.S
Please, note that an oversold/overbought condition can last for a long time, and therefore being oversold/overbought doesn't mean a price rally will come soon, or at all.
Like and subscribe and comment my ideas if you enjoy them!
EURCHF Is Going Down! Sell!
Here is our detailed technical review for EURCHF.
Time Frame: 4h
Current Trend: Bearish
Sentiment: Overbought (based on 7-period RSI)
Forecast: Bearish
The price is testing a key resistance 0.934.
Taking into consideration the current market trend & overbought RSI, chances will be high to see a bearish movement to the downside at least to 0.931 level.
P.S
The term oversold refers to a condition where an asset has traded lower in price and has the potential for a price bounce.
Overbought refers to market scenarios where the instrument is traded considerably higher than its fair value. Overvaluation is caused by market sentiments when there is positive news.
Like and subscribe and comment my ideas if you enjoy them!

GBPCHF Will Fall! Short!
Take a look at our analysis for GBPCHF.
Time Frame: 1h
Current Trend: Bearish
Sentiment: Overbought (based on 7-period RSI)
Forecast: Bearish
The market is trading around a solid horizontal structure 1.068.
The above observations make me that the market will inevitably achieve 1.062 level.
P.S
We determine oversold/overbought condition with RSI indicator.
When it drops below 30 - the market is considered to be oversold.
When it bounces above 70 - the market is considered to be overbought.
Like and subscribe and comment my ideas if you enjoy them!

SILVER Will Go Lower From Resistance! Sell!
Please, check our technical outlook for SILVER.
Time Frame: 4h
Current Trend: Bearish
Sentiment: Overbought (based on 7-period RSI)
Forecast: Bearish
The market is testing a major horizontal structure 5,852.3.
Taking into consideration the structure & trend analysis, I believe that the market will reach 5,592.7 level soon.
P.S
Overbought describes a period of time where there has been a significant and consistent upward move in price over a period of time without much pullback.
Like and subscribe and comment my ideas if you enjoy them!

USDCAD Will Go Higher! Buy!
Here is our detailed technical review for USDCAD.
Time Frame: 1h
Current Trend: Bullish
Sentiment: Oversold (based on 7-period RSI)
Forecast: Bullish
The market is approaching a key horizontal level 1.394.
Considering the today's price action, probabilities will be high to see a movement to 1.399.
P.S
Please, note that an oversold/overbought condition can last for a long time, and therefore being oversold/overbought doesn't mean a price rally will come soon, or at all.
Like and subscribe and comment my ideas if you enjoy them!

USDCHF Will Go Up! Long!
Take a look at our analysis for USDCHF.
Time Frame: 4h
Current Trend: Bullish
Sentiment: Oversold (based on 7-period RSI)
Forecast: Bullish
The market is approaching a significant support area 0.801.
The underlined horizontal cluster clearly indicates a highly probable bullish movement with target 0.805 level.
P.S
The term oversold refers to a condition where an asset has traded lower in price and has the potential for a price bounce.
Overbought refers to market scenarios where the instrument is traded considerably higher than its fair value. Overvaluation is caused by market sentiments when there is positive news.
Like and subscribe and comment my ideas if you enjoy them!

AUDUSD Will Move Lower! Short!
Please, check our technical outlook for AUDUSD.
Time Frame: 1h
Current Trend: Bearish
Sentiment: Overbought (based on 7-period RSI)
Forecast: Bearish
The market is on a crucial zone of supply 0.657.
Taking into consideration the current market trend & overbought RSI, chances will be high to see a bearish movement to the downside at least to 0.656 level.
P.S
We determine oversold/overbought condition with RSI indicator.
When it drops below 30 - the market is considered to be oversold.
When it bounces above 70 - the market is considered to be overbought.
Like and subscribe and comment my ideas if you enjoy them!

USOIL Is Bearish! Sell!
Here is our detailed technical review for USOIL.
Time Frame: 4h
Current Trend: Bearish
Sentiment: Overbought (based on 7-period RSI)
Forecast: Bearish
The price is testing a key resistance 59.116.
Taking into consideration the current market trend & overbought RSI, chances will be high to see a bearish movement to the downside at least to 58.630 level.
P.S
Overbought describes a period of time where there has been a significant and consistent upward move in price over a period of time without much pullback.
Like and subscribe and comment my ideas if you enjoy them!

GBPNZD Is Going Up! Long!
Please, check our technical outlook for GBPNZD.
Time Frame: 4h
Current Trend: Bullish
Sentiment: Oversold (based on 7-period RSI)
Forecast: Bullish
The market is trading around a solid horizontal structure 2.305.
The above observations make me that the market will inevitably achieve 2.320 level.
P.S
The term oversold refers to a condition where an asset has traded lower in price and has the potential for a price bounce.
Overbought refers to market scenarios where the instrument is traded considerably higher than its fair value. Overvaluation is caused by market sentiments when there is positive news.
Like and subscribe and comment my ideas if you enjoy them!

GBPCAD Will Fall! Short!
Here is our detailed technical review for GBPCAD.
Time Frame: 1h
Current Trend: Bearish
Sentiment: Overbought (based on 7-period RSI)
Forecast: Bearish
The market is testing a major horizontal structure 1.849.
Taking into consideration the structure & trend analysis, I believe that the market will reach 1.847 level soon.
P.S
We determine oversold/overbought condition with RSI indicator.
When it drops below 30 - the market is considered to be oversold.
When it bounces above 70 - the market is considered to be overbought.
Like and subscribe and comment my ideas if you enjoy them!
