GBPJPY Will Grow! Buy!
Here is our detailed technical review for GBPJPY.
Time Frame: 4h
Current Trend: Bullish
Sentiment: Oversold (based on 7-period RSI)
Forecast: Bullish
The market is on a crucial zone of demand 206.674.
The oversold market condition in a combination with key structure gives us a relatively strong bullish signal with goal 208.028 level.
P.S
Overbought describes a period of time where there has been a significant and consistent upward move in price over a period of time without much pullback.
Like and subscribe and comment my ideas if you enjoy them!
Swing

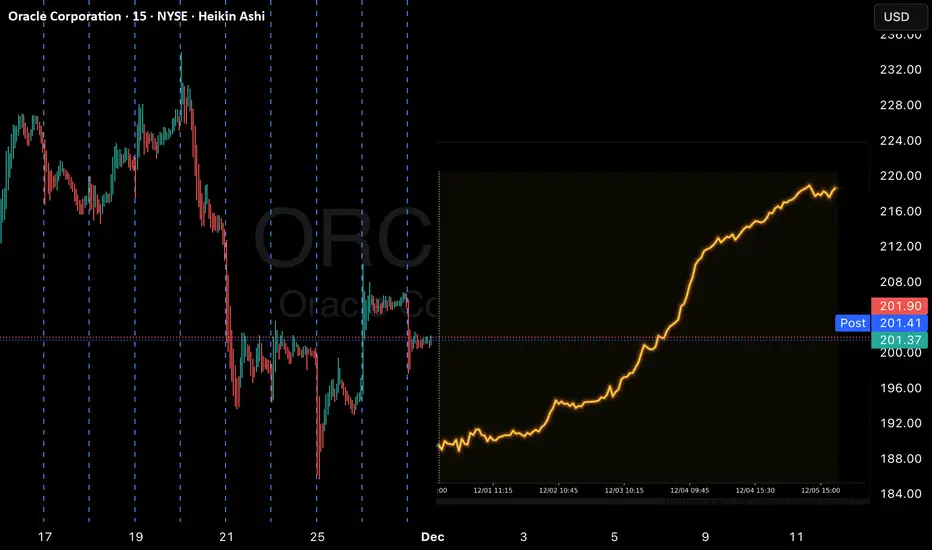
ORCL Swing Signal: Katy AI Predicts Short-Term UpsideORCL Swing Signal — (2025-11-28)
Instrument: ORCL
Direction: BUY CALLS 📈
Confidence: 58% (Medium)
Horizon / Expiry: 14 days → 2025-12-12
Strike Focus: $210.00
Entry Range: $8.50 – $9.00 (mid $8.75)
Target 1: $12.75 (+50%)
Target 2: $15.30 (+80%)
Stop Loss: $6.38 (-25%)
Position Size: 2% of portfolio
Risk Level: Moderate — recent volatility and low confidence
Katy AI Signal
Bullish bias, recovery potential after 7.96% drop
Predicted mean reversion toward $220–$230 range
40.2% swing range position favors upside
Technical Context
Current Price: $201.30 (< VWAP $206.97) → potential bounce
Key Resistance: $219.07
Support: $185.63
Trend Strength: Weak, but setup favors upside
Candlestick Patterns: None detected
Broader Market: STRONG_BULLISH; SPY & QQQ bullish
Options Flow
Neutral flow, low time decay risk
No unusual activity — potential for momentum shift
Trade Setup & Strategy
Why This Trade: Combines oversold bounce potential with broader market tailwinds
Timing Advantage: Enter after sharp single-day drop; favorable risk/reward
Risk Mitigation: Tight stop loss, small position size, scale in if needed
USOIL Will Go Lower From Resistance! Sell!
Take a look at our analysis for USOIL.
Time Frame: 4h
Current Trend: Bearish
Sentiment: Overbought (based on 7-period RSI)
Forecast: Bearish
The price is testing a key resistance 59.046.
Taking into consideration the current market trend & overbought RSI, chances will be high to see a bearish movement to the downside at least to 58.167 level.
P.S
Please, note that an oversold/overbought condition can last for a long time, and therefore being oversold/overbought doesn't mean a price rally will come soon, or at all.
Like and subscribe and comment my ideas if you enjoy them!

GBPUSD Will Go Up From Support! Long!
Please, check our technical outlook for GBPUSD.
Time Frame: 9h
Current Trend: Bullish
Sentiment: Oversold (based on 7-period RSI)
Forecast: Bullish
The market is trading around a solid horizontal structure 1.321.
The above observations make me that the market will inevitably achieve 1.333 level.
P.S
The term oversold refers to a condition where an asset has traded lower in price and has the potential for a price bounce.
Overbought refers to market scenarios where the instrument is traded considerably higher than its fair value. Overvaluation is caused by market sentiments when there is positive news.
Like and subscribe and comment my ideas if you enjoy them!

NZDUSD Will Go Higher! Buy!
Here is our detailed technical review for NZDUSD.
Time Frame: 9h
Current Trend: Bullish
Sentiment: Oversold (based on 7-period RSI)
Forecast: Bullish
The market is testing a major horizontal structure 0.571.
Taking into consideration the structure & trend analysis, I believe that the market will reach 0.577 level soon.
P.S
We determine oversold/overbought condition with RSI indicator.
When it drops below 30 - the market is considered to be oversold.
When it bounces above 70 - the market is considered to be overbought.
Like and subscribe and comment my ideas if you enjoy them!

NZDCAD Will Go Up! Long!
Take a look at our analysis for NZDCAD.
Time Frame: 1D
Current Trend: Bullish
Sentiment: Oversold (based on 7-period RSI)
Forecast: Bullish
The market is approaching a key horizontal level 0.802.
Considering the today's price action, probabilities will be high to see a movement to 0.810.
P.S
Overbought describes a period of time where there has been a significant and consistent upward move in price over a period of time without much pullback.
Like and subscribe and comment my ideas if you enjoy them!

NZDUSD ShortThe overall direction of the trend has been bearish since July 2025. The trajectory has been on continual decline. Price to make another short bullish consolidation before another continual crash downwards.

EURUSD Is Bearish! Short!
Here is our detailed technical review for EURUSD.
Time Frame: 6h
Current Trend: Bearish
Sentiment: Overbought (based on 7-period RSI)
Forecast: Bearish
The market is on a crucial zone of supply 1.159.
The above-mentioned technicals clearly indicate the dominance of sellers on the market. I recommend shorting the instrument, aiming at 1.155 level.
P.S
The term oversold refers to a condition where an asset has traded lower in price and has the potential for a price bounce.
Overbought refers to market scenarios where the instrument is traded considerably higher than its fair value. Overvaluation is caused by market sentiments when there is positive news.
Like and subscribe and comment my ideas if you enjoy them!

AUDJPY Is Going Down! Short!
Please, check our technical outlook for AUDJPY.
Time Frame: 3h
Current Trend: Bearish
Sentiment: Overbought (based on 7-period RSI)
Forecast: Bearish
The market is trading around a solid horizontal structure 101.987.
The above observations make me that the market will inevitably achieve 101.511 level.
P.S
Overbought describes a period of time where there has been a significant and consistent upward move in price over a period of time without much pullback.
Like and subscribe and comment my ideas if you enjoy them!

GBPUSD Is Going Up! Long!
Here is our detailed technical review for GBPUSD.
Time Frame: 6h
Current Trend: Bullish
Sentiment: Oversold (based on 7-period RSI)
Forecast: Bullish
The market is on a crucial zone of demand 1.309.
The oversold market condition in a combination with key structure gives us a relatively strong bullish signal with goal 1.317 level.
P.S
Overbought describes a period of time where there has been a significant and consistent upward move in price over a period of time without much pullback.
Like and subscribe and comment my ideas if you enjoy them!

EURNZD Is Bearish! Short!
Take a look at our analysis for EURNZD.
Time Frame: 1D
Current Trend: Bearish
Sentiment: Overbought (based on 7-period RSI)
Forecast: Bearish
The market is approaching a key horizontal level 2.052.
Considering the today's price action, probabilities will be high to see a movement to 2.025.
P.S
The term oversold refers to a condition where an asset has traded lower in price and has the potential for a price bounce.
Overbought refers to market scenarios where the instrument is traded considerably higher than its fair value. Overvaluation is caused by market sentiments when there is positive news.
Like and subscribe and comment my ideas if you enjoy them!

EURUSD Will Move Higher! Buy!
Here is our detailed technical review for EURUSD.
Time Frame: 1h
Current Trend: Bullish
Sentiment: Oversold (based on 7-period RSI)
Forecast: Bullish
The market is testing a major horizontal structure 1.151.
Taking into consideration the structure & trend analysis, I believe that the market will reach 1.155 level soon.
P.S
Please, note that an oversold/overbought condition can last for a long time, and therefore being oversold/overbought doesn't mean a price rally will come soon, or at all.
Like and subscribe and comment my ideas if you enjoy them!

GBPUSD Will Go Lower From Resistance! Sell!
Take a look at our analysis for GBPUSD.
Time Frame: 6h
Current Trend: Bearish
Sentiment: Overbought (based on 7-period RSI)
Forecast: Bearish
The market is approaching a key horizontal level 1.316.
Considering the today's price action, probabilities will be high to see a movement to 1.309.
P.S
The term oversold refers to a condition where an asset has traded lower in price and has the potential for a price bounce.
Overbought refers to market scenarios where the instrument is traded considerably higher than its fair value. Overvaluation is caused by market sentiments when there is positive news.
Like and subscribe and comment my ideas if you enjoy them!

EURCAD Will Go Lower! Short!
Please, check our technical outlook for EURCAD.
Time Frame: 1D
Current Trend: Bearish
Sentiment: Overbought (based on 7-period RSI)
Forecast: Bearish
The market is approaching a significant resistance area 1.630.
Due to the fact that we see a positive bearish reaction from the underlined area, I strongly believe that sellers will manage to push the price all the way down to 1.619 level.
P.S
We determine oversold/overbought condition with RSI indicator.
When it drops below 30 - the market is considered to be oversold.
When it bounces above 70 - the market is considered to be overbought.
Like and subscribe and comment my ideas if you enjoy them!

EURCHF Will Go Down! Sell!
Here is our detailed technical review for EURCHF.
Time Frame: 1h
Current Trend: Bearish
Sentiment: Overbought (based on 7-period RSI)
Forecast: Bearish
The market is on a crucial zone of supply 0.933.
The above-mentioned technicals clearly indicate the dominance of sellers on the market. I recommend shorting the instrument, aiming at 0.930 level.
P.S
Overbought describes a period of time where there has been a significant and consistent upward move in price over a period of time without much pullback.
Like and subscribe and comment my ideas if you enjoy them!

EURUSD Is Bullish! Buy!
Please, check our technical outlook for EURUSD.
Time Frame: 2h
Current Trend: Bullish
Sentiment: Oversold (based on 7-period RSI)
Forecast: Bullish
The market is trading around a solid horizontal structure 1.152.
The above observations make me that the market will inevitably achieve 1.155 level.
P.S
The term oversold refers to a condition where an asset has traded lower in price and has the potential for a price bounce.
Overbought refers to market scenarios where the instrument is traded considerably higher than its fair value. Overvaluation is caused by market sentiments when there is positive news.
Like and subscribe and comment my ideas if you enjoy them!

AMD Alert: Bullish Reversal Opportunity Amid Sector DipAMD QuantSignals V3 Swing 2025-11-25
Ticker: AMD
Signal Type: Swing Options Setup (Expiry: 2025‑12‑12)
Direction: BUY CALLS
Confidence: 68% (Medium conviction)
Strike Focus: $210.00
Entry Range: ~$13.12
Target 1: ~$18.75
Target 2: ~$22.50
Stop Loss: ~$8.75
Horizon: 17 days
1W Move: -2.93%
2W Move: -6.86%
Volume vs Prior Swing: 1.7×
Swing Range: $194.28 – $217.13
Risk Level: Moderate-High — due to volatility
🧠 Key Technical & Chart Insights
Support/Resistance:
Support at $194.28
Resistance at $256.27
Oversold Condition: AMD down ~18.84% intraday, trading 9.4% below VWAP ($222.16), signaling potential mean reversion.
Momentum: Indicators show extreme bearish exhaustion; RSI likely in oversold territory.
Candlestick Patterns: No specific reversal patterns detected yet.
Trend Context: Overall sector bearish (SPY/QQQ moderately bearish), creating a contrarian swing opportunity for AMD.
📰 News & Market Context
News Sentiment: Mixed but leaning constructive
White House AI initiative (“Genesis Mission”) = long-term tailwind
Google-Meta deal concerns = short-term pressure
Options Flow: Bullish bias with PCR 0.54 and max volume at $350 call, signaling institutional optimism.
🎯 Trade Rationale
Entry Advantage: Stock at maximum fear phase after sharp single-session decline.
Timing: 17-day horizon aligns with Katy AI’s predicted 14–21 day recovery window.
Risk/Reward: Entry at $210 provides buffer below current price, 50–80% potential upside.
Position Size: Suggested 2.5% of portfolio, considering elevated volatility (VIX 20.19).
⚠️ Key Risks
Semiconductor sector sentiment may shift negatively.
High single-day volatility — stop loss adherence is critical.
Trade dependent on Katy AI’s predicted recovery timeline; monitor daily momentum and news catalysts.

GOLD Will Move Lower! Short!
Take a look at our analysis for GOLD.
Time Frame: 9h
Current Trend: Bearish
Sentiment: Overbought (based on 7-period RSI)
Forecast: Bearish
The price is testing a key resistance 4,126.79.
Taking into consideration the current market trend & overbought RSI, chances will be high to see a bearish movement to the downside at least to 4,038.14 level.
P.S
Please, note that an oversold/overbought condition can last for a long time, and therefore being oversold/overbought doesn't mean a price rally will come soon, or at all.
Like and subscribe and comment my ideas if you enjoy them!

AUDUSD Is Very Bearish! Sell!
Here is our detailed technical review for AUDUSD.
Time Frame: 4h
Current Trend: Bearish
Sentiment: Overbought (based on 7-period RSI)
Forecast: Bearish
The market is testing a major horizontal structure 0.645.
Taking into consideration the structure & trend analysis, I believe that the market will reach 0.641 level soon.
P.S
We determine oversold/overbought condition with RSI indicator.
When it drops below 30 - the market is considered to be oversold.
When it bounces above 70 - the market is considered to be overbought.
Like and subscribe and comment my ideas if you enjoy them!

GBPAUD Is Going Down! Short!
Take a look at our analysis for GBPAUD.
Time Frame: 6h
Current Trend: Bearish
Sentiment: Overbought (based on 7-period RSI)
Forecast: Bearish
The market is approaching a key horizontal level 2.033.
Considering the today's price action, probabilities will be high to see a movement to 2.022.
P.S
Overbought describes a period of time where there has been a significant and consistent upward move in price over a period of time without much pullback.
Like and subscribe and comment my ideas if you enjoy them!

USOIL Is Very Bearish! Sell!
Please, check our technical outlook for USOIL.
Time Frame: 15m
Current Trend: Bearish
Sentiment: Overbought (based on 7-period RSI)
Forecast: Bearish
The market is approaching a significant resistance area 57.983.
Due to the fact that we see a positive bearish reaction from the underlined area, I strongly believe that sellers will manage to push the price all the way down to 57.471 level.
P.S
We determine oversold/overbought condition with RSI indicator.
When it drops below 30 - the market is considered to be oversold.
When it bounces above 70 - the market is considered to be overbought.
Like and subscribe and comment my ideas if you enjoy them!

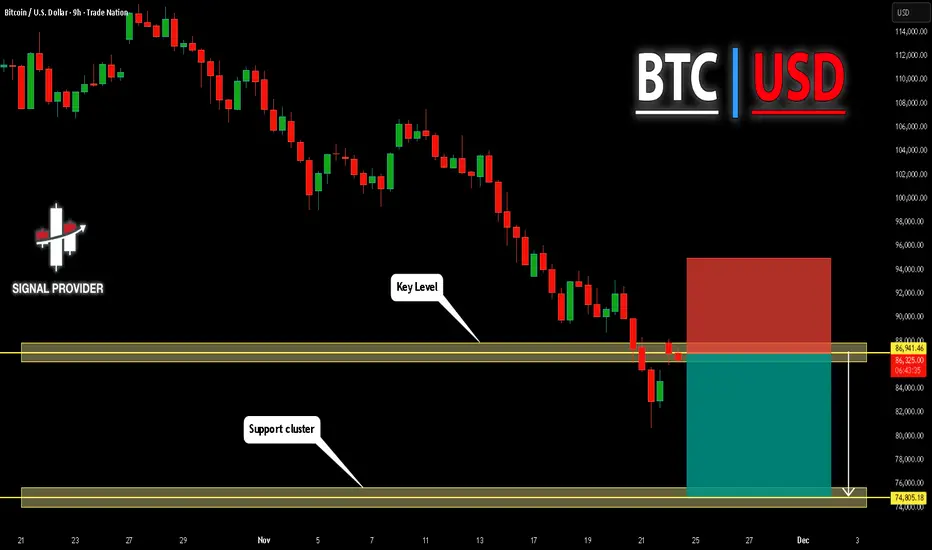
BITCOIN Will Fall! Sell!
Please, check our technical outlook for BITCOIN.
Time Frame: 9h
Current Trend: Bearish
Sentiment: Overbought (based on 7-period RSI)
Forecast: Bearish
The market is approaching a significant resistance area 86,941.46.
Due to the fact that we see a positive bearish reaction from the underlined area, I strongly believe that sellers will manage to push the price all the way down to 74,805.18 level.
P.S
Please, note that an oversold/overbought condition can last for a long time, and therefore being oversold/overbought doesn't mean a price rally will come soon, or at all.
Like and subscribe and comment my ideas if you enjoy them!
USDJPY Will Go Down From Resistance! Short!
Here is our detailed technical review for USDJPY.
Time Frame: 6h
Current Trend: Bearish
Sentiment: Overbought (based on 7-period RSI)
Forecast: Bearish
The market is on a crucial zone of supply 156.909.
The above-mentioned technicals clearly indicate the dominance of sellers on the market. I recommend shorting the instrument, aiming at 155.044 level.
P.S
The term oversold refers to a condition where an asset has traded lower in price and has the potential for a price bounce.
Overbought refers to market scenarios where the instrument is traded considerably higher than its fair value. Overvaluation is caused by market sentiments when there is positive news.
Like and subscribe and comment my ideas if you enjoy them!
