EURAUD Is Very Bearish! Sell!
Take a look at our analysis for EURAUD.
Time Frame: 1h
Current Trend: Bearish
Sentiment: Overbought (based on 7-period RSI)
Forecast: Bearish
The price is testing a key resistance 1.701.
Taking into consideration the current market trend & overbought RSI, chances will be high to see a bearish movement to the downside at least to 1.694 level.
P.S
We determine oversold/overbought condition with RSI indicator.
When it drops below 30 - the market is considered to be oversold.
When it bounces above 70 - the market is considered to be overbought.
Like and subscribe and comment my ideas if you enjoy them!
Swing
USDCHF Is Going Down! Short!
Please, check our technical outlook for USDCHF.
Time Frame: 4h
Current Trend: Bearish
Sentiment: Overbought (based on 7-period RSI)
Forecast: Bearish
The market is trading around a solid horizontal structure 0.768.
The above observations make me that the market will inevitably achieve 0.758 level.
P.S
Overbought describes a period of time where there has been a significant and consistent upward move in price over a period of time without much pullback.
Like and subscribe and comment my ideas if you enjoy them!
GOLD Will Grow! Long!
Here is our detailed technical review for GOLD.
Time Frame: 1h
Current Trend: Bullish
Sentiment: Oversold (based on 7-period RSI)
Forecast: Bullish
The market is testing a major horizontal structure 5,020.46.
Taking into consideration the structure & trend analysis, I believe that the market will reach 5,216.72 level soon.
P.S
Please, note that an oversold/overbought condition can last for a long time, and therefore being oversold/overbought doesn't mean a price rally will come soon, or at all.
Like and subscribe and comment my ideas if you enjoy them!
RECESSION AHEAD?Hi, I’m Maicol, an Italian trader specialized in Gold since 2019.
I need your support.
Leave a like and follow me.
It’s a small gesture for you, but very important for my work.
🌞 GOOD MORNING EVERYONE 🌞
📌 Today requires extremely strict risk management.
📌 No trades until today’s PPI release at 14:30.
We’ll review it live together after the data.
⚠️ Pay close attention to what I shared, both in the trading idea and here.
These are key levels.
We are at the monthly close.
First and last week of the month are usually the worst periods to trade.
🚨 TRUMP UPDATE:
Donald Trump is very likely preparing to appoint Kevin Warsh, former Federal Reserve Governor, as the new Fed Chair, replacing Jay Powell.
Why?
The assumption is that he may be easier to influence.
This could allow Trump to indirectly benefit from interest rate management, even though the Fed is meant to be independent.
🥶 This would be a very serious issue.
But for now, no rushed conclusions. We wait and observe.
❌ Then we have the Microsoft bubble and everything connected to it.
This is causing strong gold selling to raise liquidity and cover losses in other assets.
Gold remains bullish on higher timeframes in the long term.
But watch these liquidations closely.
Especially if major assets start shifting trend.
Today we have very important data for gold.
All details are explained in the trading idea.
🔔 Turn on notifications
so you don’t miss anything.
📬 For any doubts or questions,
write to me. I’ll reply.
🔍 NEXT APPOINTMENTS 🔍
As usual, live at 14:00
to follow the market in real time.
🔍 REMINDER 🔍
I avoid trading during the Asian and London sessions.
I focus on news at 14:30
and New York open at 15:30.
Have a great day.
-GOOD TRADING
-MANAGE RISK
-BE PATIENT
NZDCHF Will Go Lower From Resistance! Sell!
Here is our detailed technical review for NZDCHF.
Time Frame: 4h
Current Trend: Bearish
Sentiment: Overbought (based on 7-period RSI)
Forecast: Bearish
The market is approaching a key horizontal level 0.464.
Considering the today's price action, probabilities will be high to see a movement to 0.462.
P.S
The term oversold refers to a condition where an asset has traded lower in price and has the potential for a price bounce.
Overbought refers to market scenarios where the instrument is traded considerably higher than its fair value. Overvaluation is caused by market sentiments when there is positive news.
Like and subscribe and comment my ideas if you enjoy them!
EURUSD Will Go Up From Support! Buy!
Take a look at our analysis for EURUSD.
Time Frame: 1h
Current Trend: Bullish
Sentiment: Oversold (based on 7-period RSI)
Forecast: Bullish
The market is approaching a significant support area 1.193.
The underlined horizontal cluster clearly indicates a highly probable bullish movement with target 1.197 level.
P.S
We determine oversold/overbought condition with RSI indicator.
When it drops below 30 - the market is considered to be oversold.
When it bounces above 70 - the market is considered to be overbought.
Like and subscribe and comment my ideas if you enjoy them!
GBPJPY Is Bearish! Short!
Please, check our technical outlook for GBPJPY.
Time Frame: 1h
Current Trend: Bearish
Sentiment: Overbought (based on 7-period RSI)
Forecast: Bearish
The market is testing a major horizontal structure 211.866.
Taking into consideration the structure & trend analysis, I believe that the market will reach 211.242 level soon.
P.S
We determine oversold/overbought condition with RSI indicator.
When it drops below 30 - the market is considered to be oversold.
When it bounces above 70 - the market is considered to be overbought.
Like and subscribe and comment my ideas if you enjoy them!
SILVER Will Go Down! Sell!
Here is our detailed technical review for SILVER.
Time Frame: 1h
Current Trend: Bearish
Sentiment: Overbought (based on 7-period RSI)
Forecast: Bearish
The price is testing a key resistance 11,885.9.
Taking into consideration the current market trend & overbought RSI, chances will be high to see a bearish movement to the downside at least to 11,523.9 level.
P.S
Please, note that an oversold/overbought condition can last for a long time, and therefore being oversold/overbought doesn't mean a price rally will come soon, or at all.
Like and subscribe and comment my ideas if you enjoy them!
NZDCAD Will Go Lower! Short!
Please, check our technical outlook for NZDCAD.
Time Frame: 4h
Current Trend: Bearish
Sentiment: Overbought (based on 7-period RSI)
Forecast: Bearish
The market is on a crucial zone of supply 0.821.
The above-mentioned technicals clearly indicate the dominance of sellers on the market. I recommend shorting the instrument, aiming at 0.812 level.
P.S
Overbought describes a period of time where there has been a significant and consistent upward move in price over a period of time without much pullback.
Like and subscribe and comment my ideas if you enjoy them!
Xau to infinity and Hi, I’m Maicol, an Italian trader specialized in Gold since 2019.
I need your support.
Leave a like and follow me.
It’s a small gesture for you, but very important for my work.
🌞 GOOD MORNING EVERYONE 🌞
Gold post-FOMC keeps pushing higher.
At this point, we don’t know when or if it will drop.
We stay aligned.
We try to follow the long from good areas.
With solid risk management.
And logical stop losses.
This is important.
For now, I remain bullish.
5600 is very close.
Reminder: today we have jobless claims.
Tomorrow we close the monthly candle.
Always pay attention to monthly opens.
Especially the first and last week of the month.
As usual, we’ll see each other live today at 14:00
to follow the market together.
See you later.
🔔 Turn on notifications
so you don’t miss anything.
📬 For any doubts or questions,
write to me. I’ll reply.
🔍 NEXT APPOINTMENTS 🔍
As usual, live at 14:00
to follow the market in real time.
🔍 REMINDER 🔍
I avoid trading during the Asian and London sessions.
I focus on news at 14:30
and New York open at 15:30.
Have a great day.
-GOOD TRADING
-MANAGE RISK
-BE PATIENT
GBPNZD Will Move Higher! Long!
Take a look at our analysis for GBPNZD.
Time Frame: 4h
Current Trend: Bullish
Sentiment: Oversold (based on 7-period RSI)
Forecast: Bullish
The market is trading around a solid horizontal structure 2.276.
The above observations make me that the market will inevitably achieve 2.296 level.
P.S
The term oversold refers to a condition where an asset has traded lower in price and has the potential for a price bounce.
Overbought refers to market scenarios where the instrument is traded considerably higher than its fair value. Overvaluation is caused by market sentiments when there is positive news.
Like and subscribe and comment my ideas if you enjoy them!
CHFJPY Is Bullish! Buy!
Please, check our technical outlook for CHFJPY.
Time Frame: 4h
Current Trend: Bullish
Sentiment: Oversold (based on 7-period RSI)
Forecast: Bullish
The market is on a crucial zone of demand 197.884.
The oversold market condition in a combination with key structure gives us a relatively strong bullish signal with goal 199.265 level.
P.S
Overbought describes a period of time where there has been a significant and consistent upward move in price over a period of time without much pullback.
Like and subscribe and comment my ideas if you enjoy them!
EURNZD Is Very Bullish! Buy!
Here is our detailed technical review for EURNZD.
Time Frame: 4h
Current Trend: Bullish
Sentiment: Oversold (based on 7-period RSI)
Forecast: Bullish
The market is approaching a key horizontal level 1.983.
Considering the today's price action, probabilities will be high to see a movement to 1.991.
P.S
Overbought describes a period of time where there has been a significant and consistent upward move in price over a period of time without much pullback.
Like and subscribe and comment my ideas if you enjoy them!
GOLD Is Going Down! Sell!
Take a look at our analysis for GOLD.
Time Frame: 1h
Current Trend: Bearish
Sentiment: Overbought (based on 7-period RSI)
Forecast: Bearish
The market is approaching a significant resistance area 5,257.98.
Due to the fact that we see a positive bearish reaction from the underlined area, I strongly believe that sellers will manage to push the price all the way down to 5,170.91 level.
P.S
Please, note that an oversold/overbought condition can last for a long time, and therefore being oversold/overbought doesn't mean a price rally will come soon, or at all.
Like and subscribe and comment my ideas if you enjoy them!
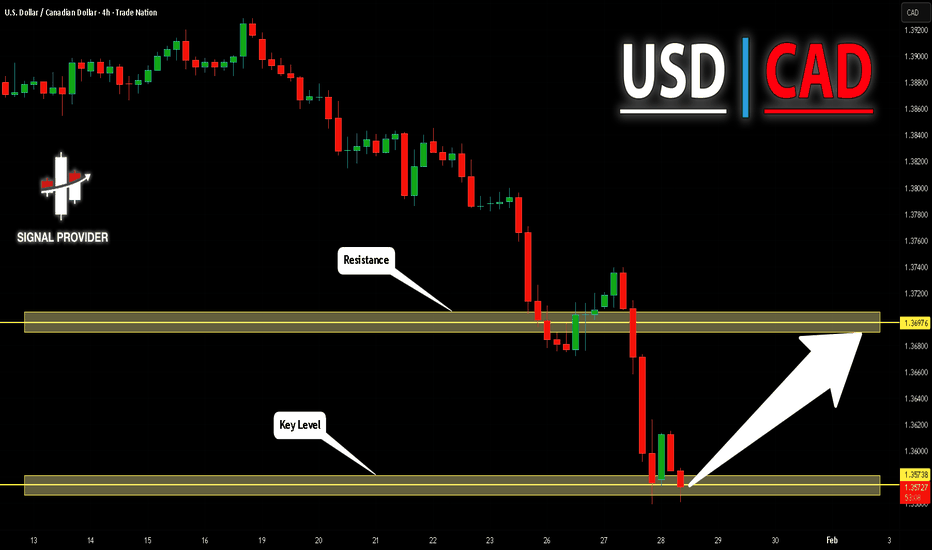
USDCAD Will Grow! Long!
Please, check our technical outlook for USDCAD.
Time Frame: 4h
Current Trend: Bullish
Sentiment: Oversold (based on 7-period RSI)
Forecast: Bullish
The market is on a crucial zone of demand 1.357.
The oversold market condition in a combination with key structure gives us a relatively strong bullish signal with goal 1.369 level.
P.S
The term oversold refers to a condition where an asset has traded lower in price and has the potential for a price bounce.
Overbought refers to market scenarios where the instrument is traded considerably higher than its fair value. Overvaluation is caused by market sentiments when there is positive news.
Like and subscribe and comment my ideas if you enjoy them!
USDCHF Will Go Higher From Support! Buy!
Here is our detailed technical review for USDCHF.
Time Frame: 1h
Current Trend: Bullish
Sentiment: Oversold (based on 7-period RSI)
Forecast: Bullish
The price is testing a key support 0.767.
Current market trend & oversold RSI makes me think that buyers will push the price. I will anticipate a bullish movement at least to 0.775 level.
P.S
We determine oversold/overbought condition with RSI indicator.
When it drops below 30 - the market is considered to be oversold.
When it bounces above 70 - the market is considered to be overbought.
Like and subscribe and comment my ideas if you enjoy them!
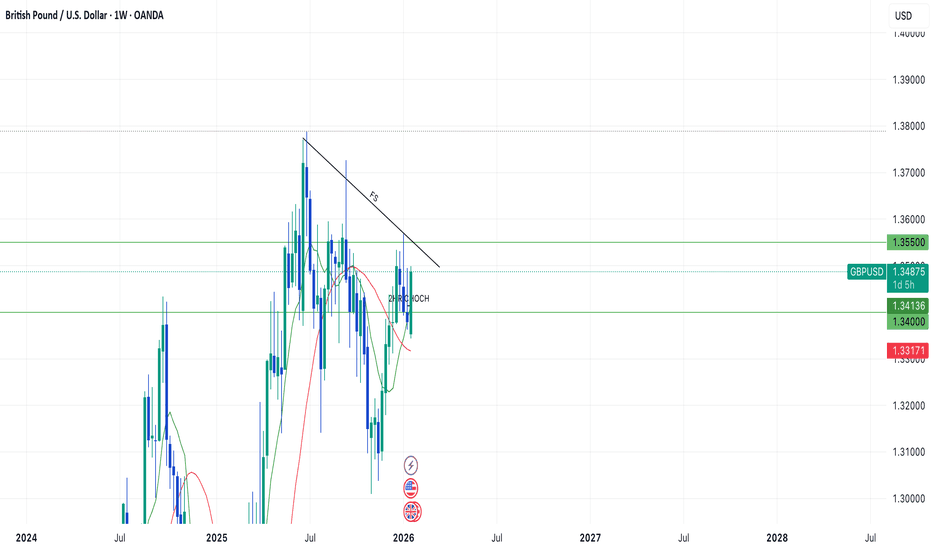
GBPUSD Swing Trade In ProgressHi Traders!
Three days ago I wrote a mind about swinging GU. As I do my top down analysis, here is my trade plan...
Based off of the weekly, GU looked to me that it is in a retracement phase giving a low at 1.30200 then progressing to the upside. With the 3 small candles printed from Monday Dec. 29th to January 12th, GU has then been in progress to make a new bullish engulfing candle (Closing in 1 day).
Moving down to the daily, within the 3 weekly candles, price seemed to be in another retracement dipping into the 50% zone at 1.33500 from the high of around 1.35700. If the 1.33500 higher low is true, then I am looking for price to continue to fill in the weekly wicks.
Furthermore, as I began to look for my entry moving down to the 2HR TF, price came down to a 2HR CHOCH zone bouncing off 1.34000. With no close below and continuation, this gave me the opportunity to fill my order around 1.34500.
My swing targets are 1.35500, and potentially into 1.36000. Based off of my TP targets, I'm looking for price to continue to fill in weekly wicks. Depending on how price reacts to 1.35500/Resistance and if price can stay above 1.35500 with signs of continuation, then I'd consider holding longer.
However, with everything said, I am still taking into consideration that price is in a failed swing, and anything below 1.34000 would invalidate my swing plan.
Entry: 1.34500
TP 1: 1.35500/1.35600
SL: 1.34000
~1:2 RR
*DISCLAIMER: I am not a financial advisor. The ideas and trades I take on my page are for educational and entertainment purposes only. I'm just showing you guys how I trade. Remember, trading of any kind involves risk. Your investments are solely your responsibility and not mine.*
US30 Will Move Lower! Sell!
Take a look at our analysis for US30.
Time Frame: 1h
Current Trend: Bearish
Sentiment: Overbought (based on 7-period RSI)
Forecast: Bearish
The market is approaching a significant resistance area 49,481.0.
Due to the fact that we see a positive bearish reaction from the underlined area, I strongly believe that sellers will manage to push the price all the way down to 49,076.8 level.
P.S
The term oversold refers to a condition where an asset has traded lower in price and has the potential for a price bounce.
Overbought refers to market scenarios where the instrument is traded considerably higher than its fair value. Overvaluation is caused by market sentiments when there is positive news.
Like and subscribe and comment my ideas if you enjoy them!
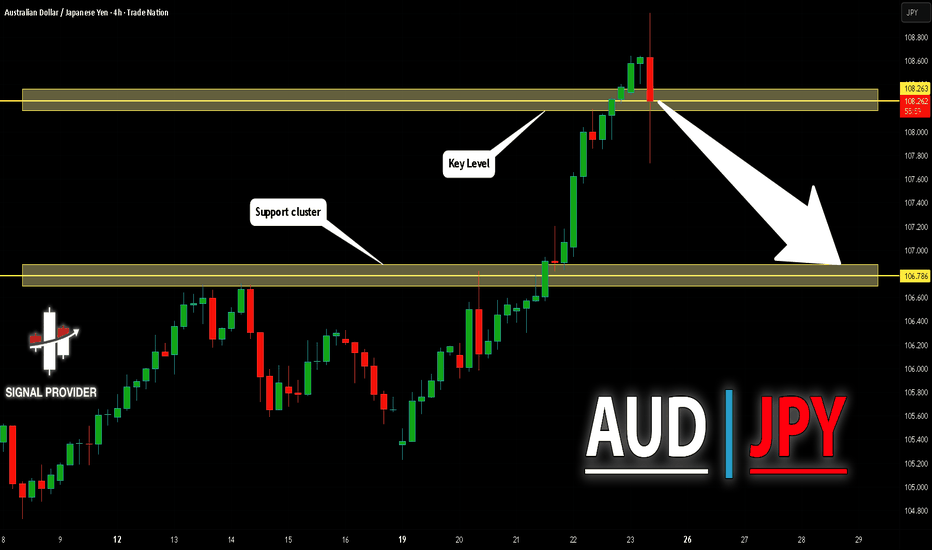
AUDJPY Will Fall! Sell!
Take a look at our analysis for AUDJPY.
Time Frame: 4h
Current Trend: Bearish
Sentiment: Overbought (based on 7-period RSI)
Forecast: Bearish
The market is approaching a significant resistance area 108.263.
Due to the fact that we see a positive bearish reaction from the underlined area, I strongly believe that sellers will manage to push the price all the way down to 106.786 level.
P.S
We determine oversold/overbought condition with RSI indicator.
When it drops below 30 - the market is considered to be oversold.
When it bounces above 70 - the market is considered to be overbought.
Like and subscribe and comment my ideas if you enjoy them!
NZDUSD Will Go Down From Resistance! Short!
Take a look at our analysis for NZDUSD.
Time Frame: 4h
Current Trend: Bearish
Sentiment: Overbought (based on 7-period RSI)
Forecast: Bearish
The market is trading around a solid horizontal structure 0.599.
The above observations make me that the market will inevitably achieve 0.591 level.
P.S
Overbought describes a period of time where there has been a significant and consistent upward move in price over a period of time without much pullback.
Like and subscribe and comment my ideas if you enjoy them!
SILVER Will Go Lower! Sell!
Please, check our technical outlook for SILVER.
Time Frame: 1h
Current Trend: Bearish
Sentiment: Overbought (based on 7-period RSI)
Forecast: Bearish
The market is testing a major horizontal structure 11,161.4.
Taking into consideration the structure & trend analysis, I believe that the market will reach 10,315.0 level soon.
P.S
Please, note that an oversold/overbought condition can last for a long time, and therefore being oversold/overbought doesn't mean a price rally will come soon, or at all.
Like and subscribe and comment my ideas if you enjoy them!
CADCHF Will Go Up! Long!
Here is our detailed technical review for CADCHF.
Time Frame: 4h
Current Trend: Bullish
Sentiment: Oversold (based on 7-period RSI)
Forecast: Bullish
The market is approaching a key horizontal level 0.566.
Considering the today's price action, probabilities will be high to see a movement to 0.570.
P.S
The term oversold refers to a condition where an asset has traded lower in price and has the potential for a price bounce.
Overbought refers to market scenarios where the instrument is traded considerably higher than its fair value. Overvaluation is caused by market sentiments when there is positive news.
Like and subscribe and comment my ideas if you enjoy them!
AUDNZD Will Move Lower! Short!
Take a look at our analysis for AUDNZD.
Time Frame: 1h
Current Trend: Bearish
Sentiment: Overbought (based on 7-period RSI)
Forecast: Bearish
The market is approaching a significant resistance area 1.159.
Due to the fact that we see a positive bearish reaction from the underlined area, I strongly believe that sellers will manage to push the price all the way down to 1.156 level.
P.S
We determine oversold/overbought condition with RSI indicator.
When it drops below 30 - the market is considered to be oversold.
When it bounces above 70 - the market is considered to be overbought.
Like and subscribe and comment my ideas if you enjoy them!


