GBP/USD Forecast – Bullish Continuation SetupGBP/USD has broken out of the descending channel and is maintaining bullish momentum. I expect the price to move toward the 1.3725–1.3807 resistance zone, where we may see a corrective pullback. If this zone holds and structure remains bullish, the next target sits at the weekly order block near 1.4230, aligning with higher-timeframe supply.
Bias remains bullish unless price closes back below recent lows and re-enters the channel, which would invalidate the setup. For now, market structure favours continuation to the upside.
Targets:
Short-term: 1.3725–1.3807
Long-term: 1.4230
Invalidation: Break and close back below channel lows.
Swingtrade


Energizing gains – Initiating NHPC buy.Chart timeframe: Daily chart of NHPC.
Pattern formation: Broadening pattern observed.
Support zone: Currently taking support along the parallel channel in the ₹80–₹83 range.
Price outlook: Sustaining this support zone could lead to higher price levels.
Note: Continue monitoring price action for confirmation.
Thank You !!

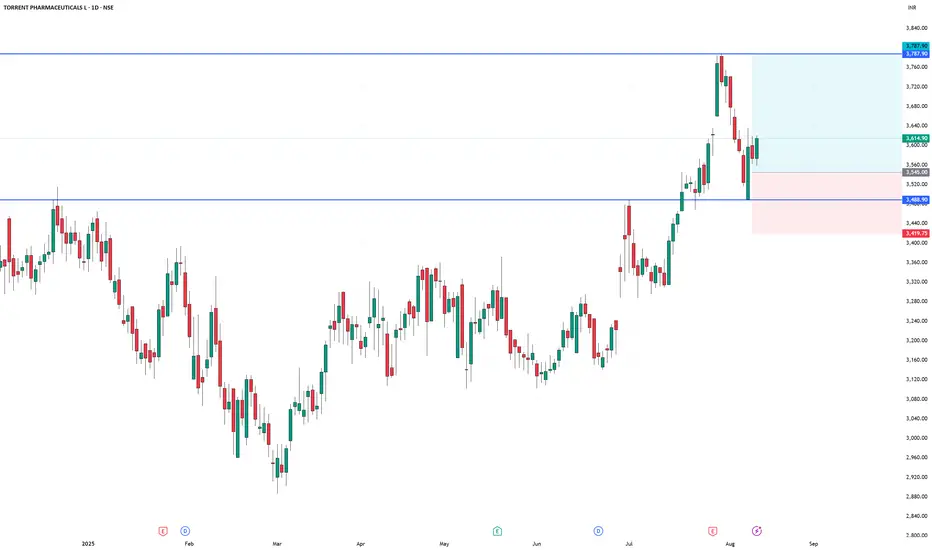
TORNTPHARM long setupTORNTPHARM long setup
Entry - 3545
Stop loss - 3420
Target - 3788
Risk Reward - 1:1.94
SUI – Ready to Drop from the $3.96 Supply WallSUI has rallied right into a key confluence area — the strong supply zone & bearish order block at $3.90–$4.00, which also aligns perfectly with the descending channel’s upper boundary.
📌 Bearish Scenario (preferred):
If price shows rejection at this zone and breaks below $3.85, a corrective move toward $3.55–$3.60 is highly probable, with potential extension toward $3.35 demand zone.
📌 Invalidation:
A 4H candle close above $4.05 would invalidate the short setup and open the door for a continuation toward $4.25+.
💡 Note: Confluence of channel resistance + supply OB + psychological $4 level makes this a high-probability short area. Watch for lower-timeframe BOS or liquidity sweep before entering.

FIGMA Grabbing Liquidity!!!
## ⚠️ FIG Swing Short Setup (2025-08-08) ⚠️
**Bias:** 📉 **Strong Bearish** — heavy put flow, weak trend, no momentum support.
**🎯 Trade Plan**
* **Ticker:** \ NYSE:FIG
* **Type:** PUT (SHORT)
* **Strike:** \$75.00
* **Entry:** \$4.80 (watch open, avoid chasing)
* **Profit Target 1:** \$7.20 (+50%)
* **Profit Target 2:** \$9.60 (+100%)
* **Stop Loss:** \$2.88 (-40%)
* **Expiry:** 2025-08-15
* **Size:** 1 contract
* **Confidence:** 75%
**📊 Key Notes**
* **C/P Ratio:** 0.45 → bearish options flow ✅
* Institutional bias heavily short ✅
* Trend falling, multi-timeframe returns flat ❌
* Volume: average — no strong push yet ⚠️
* Watch \$80 resistance for rejection trigger 🚨

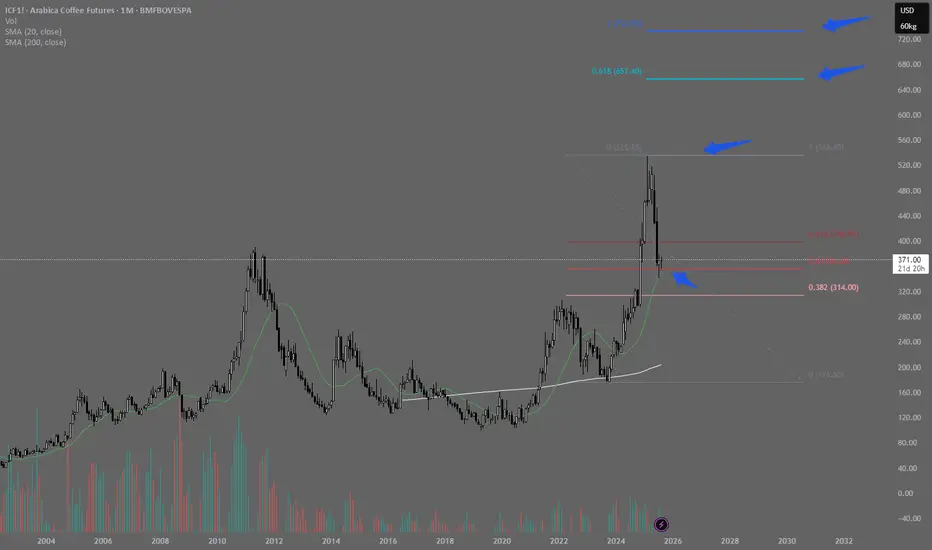
Correction Over? Coffee May Be Ready for Another Rally!After a strong rally and moving far from its moving averages, coffee futures have started a healthy and expected pullback.
As we can see, the 20-period moving average (green) stands out as a strong support level and a potential target for those who sold near the top — whether for a partial profit-taking (expecting a deeper correction) or a full exit.
The candle formed right on the 20MA clearly reflects this dynamic: positions being closed by some traders and opened by others.
This price zone offers a good buying opportunity, with a tight stop and a long target in favor of the prevailing uptrend.
The trade symmetry is favorable, further reinforcing interest in this region.
Initial targets would be the previous high, and if that level is broken, the Fibonacci projections for more ambitious upside moves.
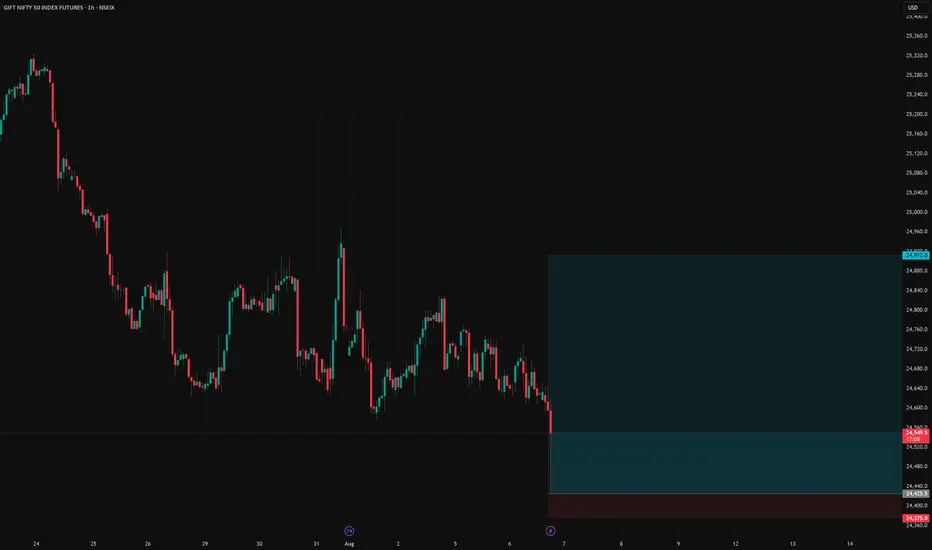
GIFT NIFTY long setupGift NIFTY long setup
Entry price - 24425.5
Stop loss - 24375
Target - 24912
Risk Reward - 1:9.6
RENDER Approaching Key Support – Swing Trade OpportunityRENDER is currently retracing and approaching a significant support zone, offering a potential long swing trade setup. This level has historically acted as a demand area, and price action around it could provide a favorable risk-to-reward entry.
💰 Entry Zone: $3.280 – $3.030
🎯 Targets:
• TP1: $4.00
• TP2: $4.500
🛑 Stop Loss: $2.950
Trade management will be key – look for bullish reversal signals like strong volume, bullish engulfing patterns, or RSI confirmation before entry. Maintain disciplined risk control with your stop loss below the key zone.
#RENDER #CryptoTrading #SwingTrade #Altcoins #TechnicalAnalysis #CryptoSetup #Bullish #SupportZone #CryptoSignals #RENDERUSDT #RiskReward #CryptoMarket

BTC – Pre-FOMC consolidation, bullish momentum, key zones__________________________________________________________________________________
Technical Overview – Summary Points
__________________________________________________________________________________
Momentum : Primary uptrend confirmed on all swing timeframes (daily to 1H). Active consolidation below major resistance (119650–120247), no capitulation or massive selling signals at this stage.
Major Supports / Resistances :
Main Supports: 116950, then 114732. Structural invalidation if daily close below 114K or low <110K.
Key Resistances: 119650–120247 (recent block), then 123218. Clean breakout >125K targets next stat zone at 141K.
Volumes : Transactional flows remain healthy, no anomalies or distribution events; normal volumes with a few impulsive bursts. No panic or selling climax detected.
Multi-timeframe behavior : Uptrend alignment from 1D to 2H; short-term divergence (MTFTI “Down” on 30m/15m/5m) indicates only breath/consolidation pre-macro event (FOMC).
__________________________________________________________________________________
Strategic Summary
__________________________________________________________________________________
Global Bias : Medium/long-term bullish bias, confirmed, with no behavioral excess or visible structural weakness.
Opportunities : Pullbacks to major supports (116950–114732) offer strategic accumulation. Potential for adding exposure on clear breakout above 125K with volume confirmation.
Risk Areas : Post-FOMC flushes, anticipated high volatility until Thursday morning, $115–123K range still active. Tactical stop loss below 114.5K, structural recalibration <110K.
Macro Catalysts : FOMC tonight (20:00 Paris): status quo expected, but markets highly sensitive to Powell’s statement. Widened spreads, max volatility expected within the following 2 hours.
Action Plan : Favor patience on breakout, accumulate on retracement, keep stops disciplined. Avoid aggressive scalping until post-FOMC volatility peak fades.
__________________________________________________________________________________
Multi-Timeframe Analysis
__________________________________________________________________________________
1D (Daily): Uptrend confirmed up to dense resistance zone 119800–123200. Solid momentum, no excess on Risk On / Risk Off Indicator or volume. Key Supports: 116950, 114732.
12H/6H/4H: Structured consolidation below 120247–119650. No behavioral warnings; markets strong, healthy liquidity. Accumulation-distribution rhythm without extremes.
2H/1H: Sideways, no sell-off or euphoria; potential consolidation before breakout. Major supports unchanged.
30min/15min: Noticeable short-term divergence (“Down”). Micro bearish setup, possible loss of short-term momentum before FOMC.
Summary: Broadly bullish swing trend with consolidation below resistance, reinforcement possible on breakout; short term fragile until macro moves (Fed) are digested.
Patience is key ahead of FOMC: prioritize accumulation on major pullback, keep stops disciplined, and avoid intraday over-trading unless clear exhaustion signals emerge.
__________________________________________________________________________________
Risk On / Risk Off Indicator: Strong Buy from 1D to 1H, intact sector support, positive structural bias.
ISPD DIV: Neutral across all timeframes: no excess, no behavioral climax.
On-chain/macro: 97% of holders still in profit; market absorbed stress test ($9B sell-off); only moderate euphoria, consistent with late bull phase but not exhausted.
Swing validation if >125K.
Tactical stop <114.5K; full capitulation <110K.
__________________________________________________________________________________

AUD/JPY: Fading the Rally at a Major Resistance ZoneWhile AUD/JPY has been in a clear uptrend, the rally is now approaching a significant technical ceiling where sellers have previously stepped in. We see a compelling opportunity for a counter-trend short, betting that this resistance level will hold and that the current bullish momentum is showing signs of exhaustion.
This trade is for those watching for a market turn, offering a well-defined risk-to-reward setup for a swing position.
🤔 The "Why" Behind the Short Setup
📰 The Fundamental Risk
The Australian Dollar is a "risk-on" currency, meaning it performs well when global markets are optimistic. The Japanese Yen, however, is a classic "safe-haven" asset that strengthens during times of uncertainty. With the upcoming high-impact Australian CPI data, any sign of economic weakness could disappoint the market, increase pressure on the RBA, and trigger a "risk-off" move that would benefit the Yen and send AUD/JPY lower.
📊 The Technical Ceiling
The chart tells a clear story. The price is currently testing a major resistance zone. Attempting to short near a strong ceiling like this provides a strategic entry to capture a potential trend reversal. We are essentially betting that the trend's multi-week momentum will stall and reverse from this key technical juncture.
✅ The High-Clarity SHORT Trade Setup
📉 Pair: AUD/JPY
👉 Direction: Short
⛔️ Entry: 96.716
🎯 Take Profit: 92.080
🛑 Stop Loss: 98.907
Rationale: This setup plays for a significant swing move. The wide stop loss is designed to withstand volatility from news events, while the deep take profit targets a full reversal back to major support levels seen earlier in the year.

Looking like an immediate buy on IBM! OptionsMastery:
🔉Sound on!🔉
📣Make sure to watch fullscreen!📣
Thank you as always for watching my videos. I hope that you learned something very educational! Please feel free to like, share, and comment on this post. Remember only risk what you are willing to lose. Trading is very risky but it can change your life!

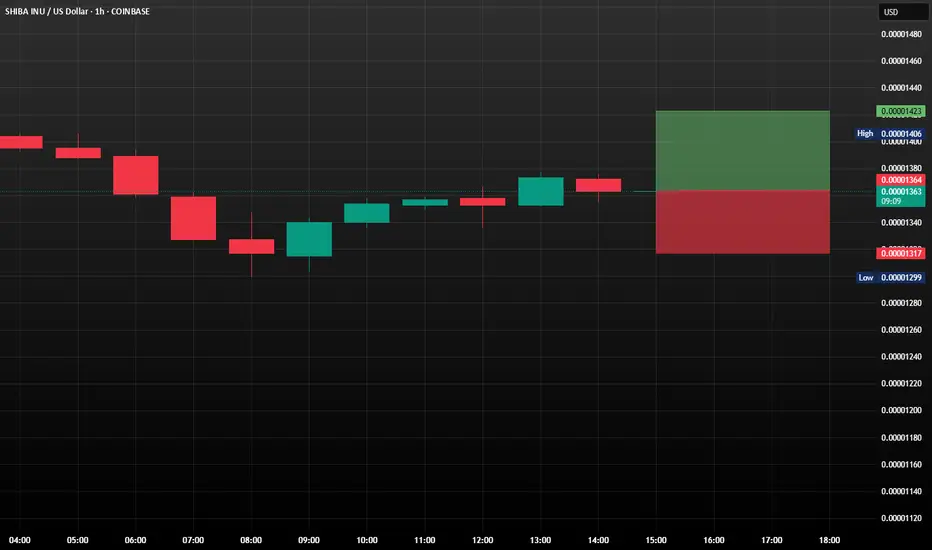
SHIB/USDT: A Fight for Recovery?SHIB/USDT is currently trading around $0.00001363, marking an approximately 11.5% drop over the past 24 hours. However, it's crucial to note that the price is successfully holding above the key support level of $0.00001373.
Recently, we've witnessed a significant increase in the activity of so-called "large holders" or "whales" concerning SHIB/USDT. Their netflow has reached a two-month high, signaling heightened interest. In the past 24 hours, addresses holding at least 0.1% of the total SHIB supply accumulated an impressive 4.66 trillion SHIB, representing an investment of a staggering $63.7 million. These major players clearly believe in the potential for a price recovery.
What's Next? Scenarios for SHIB/USDT
Bullish Scenario (Uptrend):
Should SHIB/USDT successfully bounce off the support level at $0.00001317, it would likely pave the way for further price appreciation. It could potentially reach $0.00001423. If this level solidifies as new support, it would mark a full recovery of today's losses and could initiate a new uptrend, provided that broader market conditions remain favorable. The investment by the whales would be crucial in this scenario.
Bearish Scenario (Downtrend):
However, if SHIB/USDT fails to hold above the support of $0.00001317 and falls below this level (likely due to profit-taking by other market participants), the popular "meme coin" could slip to $0.00001188. Such a development would invalidate the bullish thesis and further reduce investor confidence. The next few days will be critical for SHIB to demonstrate whether it can
maintain its current support levels.
#forex #SHIB #USDT #SwingTrade
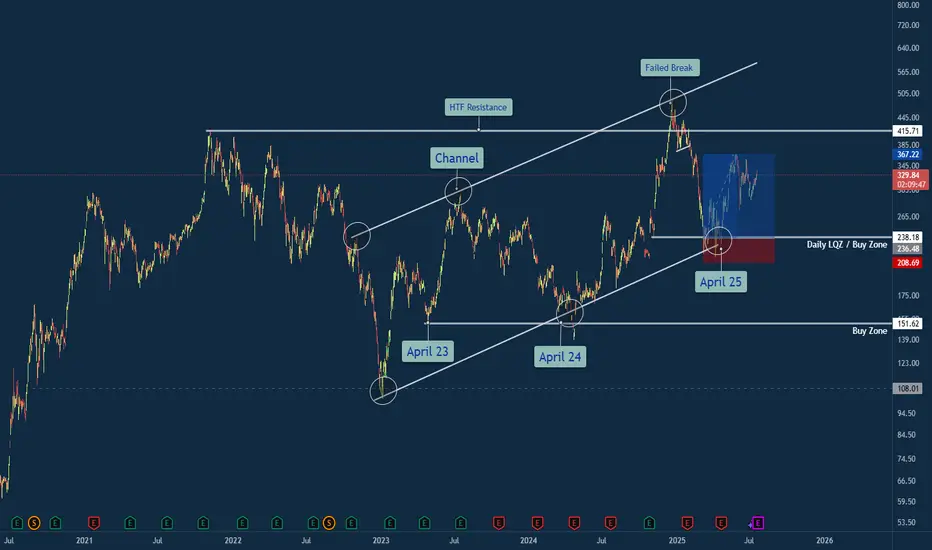
Tesla Trade Breakdown: The Power of Structure, Liquidity & ...🔍 Why This Trade Was Taken
🔹 Channel Structure + Liquidity Trap
Price rejected from a long-standing higher time frame resistance channel, making a false breakout above $500 — a classic sign of exhaustion. What followed was a sharp retracement into the lower bounds of the macro channel, aligning with my Daily LQZ (Liquidity Zone).
🔹 Buy Zone Confidence: April 25
I mapped the April 25th liquidity grab as a high-probability reversal date, especially with price landing in a confluence of:
Demand Zone
Trendline Support (from April 23 & April 24 anchor points)
Volume spike + reclaim of structure
🔹 Risk/Reward Favored Asymmetry
With a clear invalidation below $208 and targets at prior supply around $330+, the R:R on this trade was ideal (over 3:1 potential).
Lessons Reinforced
🎯 Structure Always Tells a Story: The macro channel held strong — even after a failed breakout attempt.
💧 Liquidity Zones Matter: Price gravitated toward where stops live — and then reversed sharply.
🧘♂️ Patience Beats Precision: The best trades don’t chase. They wait. This was one of them.
💬 Your Turn
How did you play TSLA this year? Were you watching the same channel? Drop your insights or charts below — let’s compare notes 👇
#TSLA #Tesla #SwingTrade #PriceAction #LiquidityZone #FailedBreakout #TechnicalAnalysis #TradingView #TradeRecap #ChannelSupport #SmartMoney
Why I Went Long on AMD Near the 2025 Lows🔍 Reason for the Trade
This wasn’t just a “buy the dip” setup — this was a calculated trade based on strong confluence:
✅ Multi-Year Demand Zone
Price returned to a massive support level that’s held since 2020. This zone had previously triggered multiple large bullish reversals.
✅ Falling Wedge Breakout
A textbook falling wedge pattern formed during the pullback. Once price broke out, the momentum confirmed a structural reversal.
✅ Risk/Reward Optimization
I positioned my stop just under key support, with targets set at prior structure highs. The setup offered a clean 2.5:1+ R/R ratio, perfect for swing conviction.
✅ Institutional Accumulation Area
The volume and wick rejections in this zone screamed smart money stepping in. It was a classic sign of fear-based selling into patient buyers.
🧠 Lessons Reinforced
- Wait for the Zone, Then Act: Patience paid off — the best trades come from the best levels.
- Structure Over Emotion: I trusted the technical, not the bearish headlines.
- R/R Always Wins: You don’t need to be right every time, but when you’re right — let it run.
#AMD #SwingTrade #TechnicalAnalysis #SupportAndResistance #WedgeBreakout #RiskReward #PriceAction #StockMarket #TradingView #TradeRecap

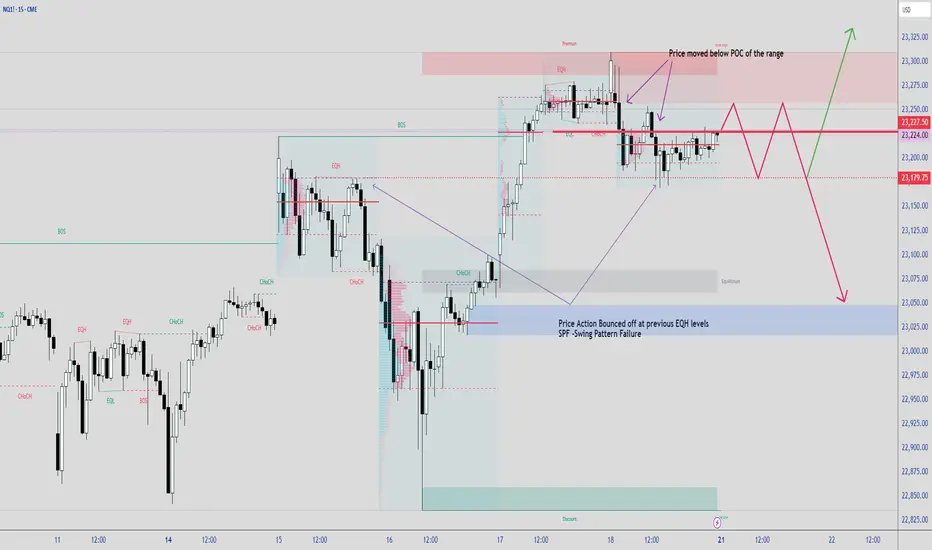
Using LuxAlgo SMC Free indicatorSometimes Indicators helps calculates the swing points without any effort especially during live trading.
POC is part of a tool called Volume Profile. In this case, Im using select Fixed Range VP to identify short term POC to see where PA can bounced from.
When markets moving sideways or in a Trading Range, PA tends to be choppy.
Nobody knows about the future, if they claimed to know, just run away. Here are some probabilities how PA would do next.
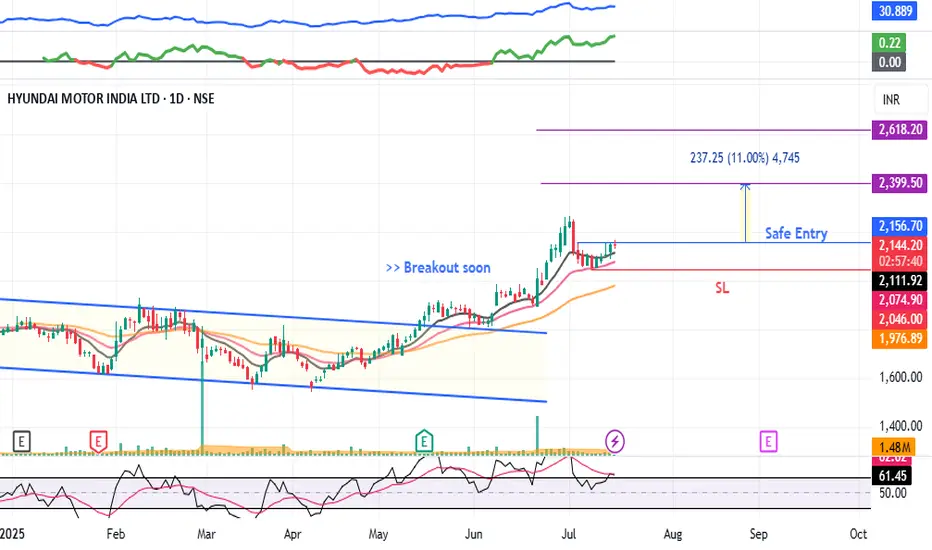
HYUNDAI - Swing Trade#HYUNDAI #swingtrade #trendingstock #momentumtrading #breakoutstock
HYUNDAI : Swing Trade
>> Breakout soon
>> Trending Stock
>> Volume Dried up
>> Good strength
>> Low Risk Trade ( RR - 1:2 or 1:3 )
Swing Traders can lock profit at 10% and keep trailing
Pls Boost, like and comment if u like the analysis
Disc: Charts shared are for Learning purpose, Take position only after consulting ur Financial Advisor or a SEBI Registered Advisor
L&T Finance – Cup & Handle Breakout After 8 Years!L&T Finance has finally broken out of a classic Cup and Handle pattern, reclaiming its 2017 all-time high after nearly 8 years of consolidation. Strong volume confirmation adds weight to this long-term bullish breakout. A must-watch for positional traders and investors looking for momentum in the NBFC space!

Hindustan Unilever Ltd. – Bullish Breakout with Strong MomentumHindustan Unilever opened the session with a gap-up accompanied by above-average volume, signaling strong buying interest right from the start. While the stock saw some early profit-booking, it quickly regained momentum and is currently trading near the day’s high—an encouraging sign of sustained demand.
Weekly Chart: The formation of a large bullish candle this week suggests aggressive buying and a potential shift in sentiment. This pattern indicates that the bullish momentum is likely to continue into the coming week.
Daily Chart: The stock has successfully broken out above multiple resistance levels, confirming a bullish breakout structure. The breakout is backed by volume, adding credibility to the move.
Trading Strategy:
Given the alignment of bullish signals on both the daily and weekly timeframes, a swing long position is warranted for the upcoming week. Traders may consider the following approach:
Entry: On a minor intraday pullback or a break above the current day’s high for confirmation
Stop-loss: Below the breakout level or this week’s low
Target: Next key resistance or a measured move based on the breakout range , approximately 10% from current levels
The technical setup reflects strong bullish momentum and suggests further upside potential in the near term.

AUD/USD: Short Setup to 0.6450This trade idea is rooted in a data-driven approach, leveraging a rare asymmetry in the economic calendar and specific quantitative models to identify a high-clarity opportunity.
📊 The Thesis by the Numbers
My model assigns clear probabilities to the potential scenarios for this week, based on the scheduled U.S. data releases.
60% Probability: Base Case (USD Strength). Triggered by a U.S. Core CPI reading at or above 0.3% MoM.
30% Probability: Alternative Case (USD Weakness).
10% Probability: Wildcard Scenario (Risk-On Rally).
🧠 The Data-Driven Rationale
This setup scored a -5 on my quantitative thesis model, indicating a strong bearish conviction. The core of this is the one-sided event risk. With Australia's calendar completely empty, the AUD is a sitting duck. Meanwhile, a volley of tier-one U.S. data (CPI, PPI, Retail Sales) is expected to confirm a robust economy. This fundamental divergence, combined with a technical picture of price coiling below long-term resistance, creates the conditions for a catalyst-driven drop.
⛓️ Intermarket & Statistical Edge
Further analysis of market correlations and forward-looking models reinforces the bearish bias.
🌐 Correlations: The positive correlation of AUD/USD with equities (SPY: +0.31) suggests that a strong USD report, which could pressure stocks, would create a direct headwind for the Aussie.
🎲 Monte Carlo Simulation: While the mean outcome is neutral, the model's 5th percentile for price is down at 0.6503 , highlighting the statistical risk of a significant downside move if the catalyst fires.
✅ The Trade Setup
📉 Bias: Bearish / Short
👉 Entry: Watch for a bearish reversal pattern on the 1H or 4H chart within the $0.6550 resistance zone.
⛔️ Stop Loss: A decisive daily close above the 0.6622 resistance level.
🎯 Target: 0.6458 (June low-day close).
Good luck, and trade safe.

GBP/USD: Path to 1.3200 on Policy DivergenceThis trade idea outlines a high-conviction bearish thesis for GBP/USD. The core of this analysis is a significant and growing divergence between the fundamental outlooks of the UK and US economies, which is now being confirmed by a bearish technical structure. We anticipate the upcoming UK economic data releases during the week of July 14-18 to act as a catalyst for the next leg down.
The Fundamental Why 📰
The primary driver for this trade is the widening policy and economic divergence. The UK is facing a triad of headwinds while the US economy exhibits greater resilience. This fundamental imbalance favors the US Dollar and is expected to intensify.
Dovish Bank of England: The BoE is clearly signaling a dovish pivot towards monetary easing in response to a weakening labor market and sluggish growth prospects. This contrasts with the Federal Reserve's more patient, data-dependent stance.
Widening Rate Differentials: The divergence in central bank policy is leading to a widening interest rate differential that favors the US Dollar.
Geopolitical Headwinds: Fiscal policy from the new UK government and ongoing trade tensions are creating additional headwinds for the Pound.
The Technical Picture 📊
Price action provides strong confirmation of the bearish fundamental thesis, showing a clear loss of upward momentum and the formation of a new downtrend.
📉 Death Cross: The 50-day moving average has crossed below the 200-day moving average, forming a "death cross," which is a strong bearish indicator.
📉 Key Level Lost: The price has recently broken and is holding below the critical 200-day moving average, a classic bearish signal.
📉 Bearish Momentum: Both the RSI (below 50) and the MACD (below its signal line and zero) indicate that bearish momentum is in control.
The Trade Setup 📉
👉 Entry: 1.3540 - 1.3610
🎯 Take Profit: 1.3200
⛔️ Stop Loss: 1.3665

USD/JPY: A High-Clarity Setup in a Coiling MarketFor weeks, the market has been choppy and difficult, grinding accounts down with indecisive price action. Many traders are getting stomped by the noise. This post is designed to cut through that chaos with a single, high-clarity trade idea based on a powerful fundamental story and a clean technical picture.
The focus is on the USD/JPY, where a major catalyst (US CPI) is about to meet a tightly coiling chart pattern.
The Fundamental Why 📰
Our entire thesis is now supported by both qualitative and quantitative analysis. The core driver is the profound monetary policy divergence between the U.S. and Japan, which manifests as a powerful Interest Rate Differential.
The Core Driver: The Bank of Japan maintains its ultra-easy policy while the Fed is in a "hawkish hold," creating a significant interest rate gap of over 400 basis points that fuels the carry trade.
Quantitative Validation: Our new analysis confirms this is the primary driver. We found a strong positive correlation of 0.54 between the USD/JPY exchange rate and this Interest Rate Differential. This provides a robust, data-backed reason for our long bias.
This creates a fundamental chasm between the two currencies, representing a compelling long-term tailwind for USD/JPY.
The Technical Picture 📊
The 4-hour chart perfectly visualizes the market's current state.
The Coiled Spring: Price is consolidating in a tight symmetrical triangle. This represents a balance between buyers and sellers and a build-up of energy. A breakout is imminent.
The Demand Zone: Our entry is not random. We are targeting a dip into the key demand zone between 144.50 - 144.80. This area is significant because it aligns with the 50-day moving average, a level that offers a more favorable risk/reward ratio.
The Underlying Conflict: It's important to note the long-term bearish "Death Cross" on the daily chart (50 MA below 200 MA). Our thesis is that the immense fundamental pressure—now validated by our quantitative study—will be strong enough to overwhelm this lagging technical signal.
The Plan & Setup 🎯
This is a conditional setup, and our analysis confirms the proposed levels are well-reasoned. We are waiting for the market to confirm our thesis before entering.
The Setup: 📉 Long (Buy) USD/JPY. We are looking for price to dip into our demand zone and then break out of the triangle to the upside.
Entry Zone: 👉 144.50 - 144.80. Watch for a 4H candle to show support in this area.
Stop Loss: ⛔️ 144.00. A break below this level would signal that the immediate bullish structure has failed and invalidates the trade thesis.
Take Profit: 🎯 149.50. This target is strategically set just below the major 150.00 psychological handle, a level where institutional orders are likely clustered.
This setup provides a clear, logical plan to engage with the market's next big move. It's all signal, no noise. Trade smart, and manage your risk.

EUR/USD: A High-Probability Short Setup at 1.1829At its core, this trade is driven by a powerful and growing divergence between the US and European economies. While technicals tell us where to trade, fundamentals tell us why we're trading.
1️⃣ The Interest Rate Gap: The U.S. currently offers significantly higher interest rates (4.25% - 4.50%) compared to the Eurozone (2.15%). This makes holding the US Dollar more attractive, creating natural downward pressure on the EUR/USD.
2️⃣ Central Bank Policy: The US Federal Reserve remains hawkish, focused on strength and fighting inflation. Meanwhile, the European Central Bank is dovish, signaling a willingness to keep conditions loose to support a weaker economy.
3️⃣ Labor Market Strength: The US enjoys a robust labor market with unemployment at just 4.1%, while the Eurozone's is significantly higher at 6.3%. This points to a stronger US economy.
In simple terms, the US economy is strong, and its central bank is acting like it. The Eurozone economy is weaker, and its central bank is acting accordingly. This fundamental imbalance is the fuel for a potential significant move down in EUR/USD.
The Technical Picture: The Wall at 1.1829
As you can see on the 4H chart, the price has run into a major wall of resistance at the 52-week high of 1.1829 . After a long uptrend, the momentum has stalled, and the price is now consolidating inside a symmetrical triangle . This coiling of price action often precedes a strong breakout.
Our strategy is not to guess the breakout, but to act on a high-probability retest of resistance. We are looking to enter a short position as the price pulls back towards the upper boundary of this triangle, anticipating a failure at resistance and a subsequent break to the downside.
The Actionable Trade Plan
This setup offers an excellent risk/reward profile.
📉 Asset: EUR/USD
👉 Entry (Limit Sell): 1.1780
⛔️ Stop Loss: 1.1850
🎯 Take Profit: 1.1600
📈 Risk/Reward Ratio: ~2.57:1
Trade safe and manage your risk.
