BTC/USD Bullish Reversal Setup from Demand Zonea potential bullish retracement setup on Bitcoin (BTC/USD) in the 1-hour timeframe. After a strong bearish move, price entered a highlighted demand zone, suggesting a possible short-term reversal. The projection shows a rebound from this support area toward Target 1 (118,472) and Target 2 (119,404), with a Stop Loss positioned below the recent swing low at 115,628.
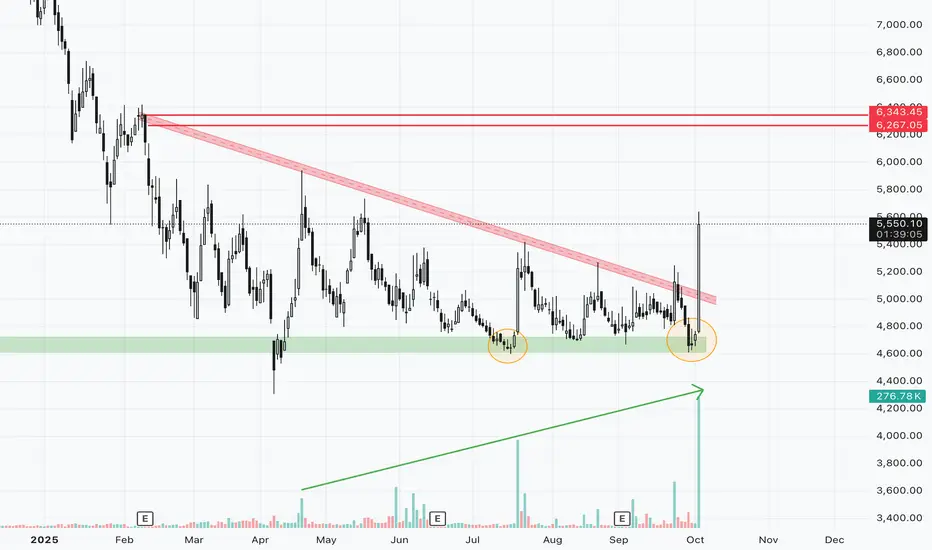
Swingtrading

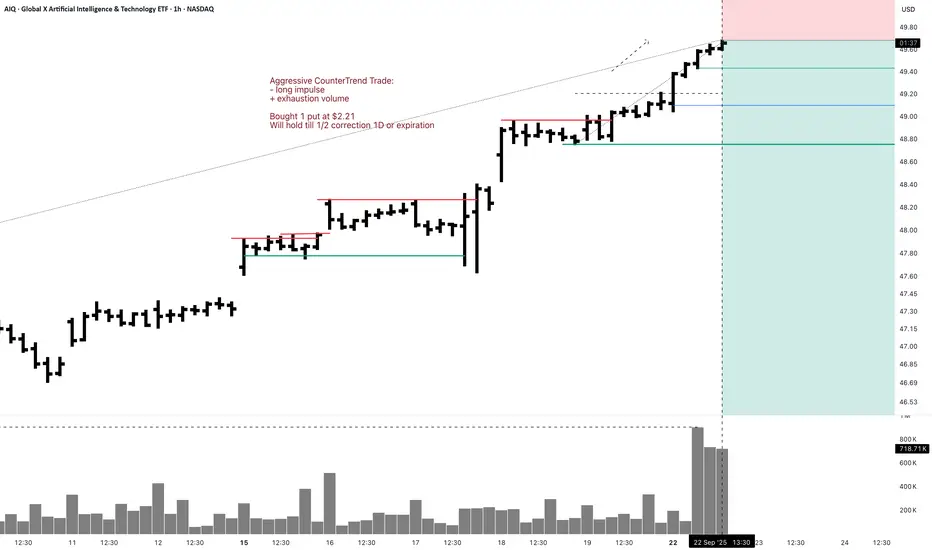
AIQ 1H Swing Aggressive CounterTrend TradeAggressive CounterTrend Trade:
- long impulse
+ exhaustion volume
Bought 1 put at $2.21
Will hold till 1/2 correction 1D or expiration
Daily CounterTrend
- long impulse
+ above expected range
+ exhaustion volume
Monthly CounterTrend:
- long impulse
+ SOS reaction bar
Yearly CounterTrend
"- long impulse
+ T1 level
+ resistance level
- far above T1"
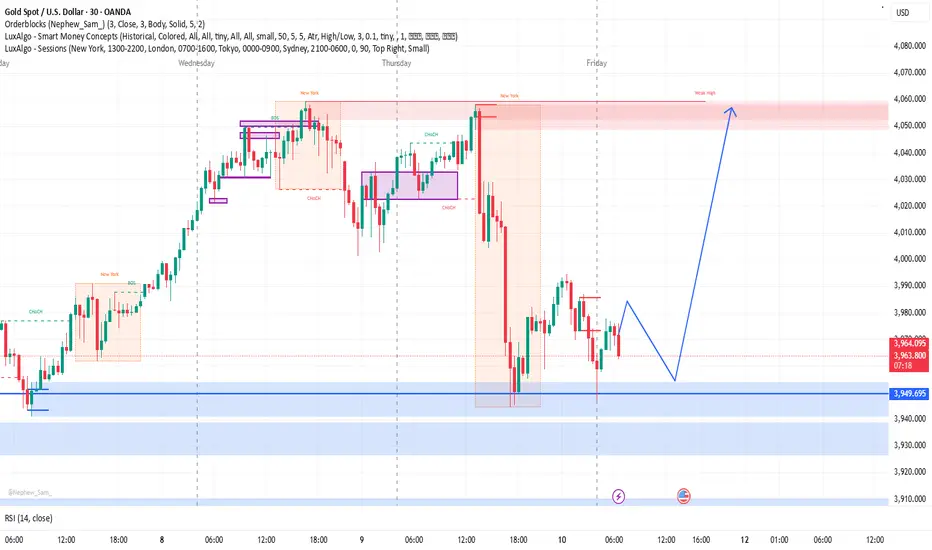
Gold Potential Reversal from Demand Zone on 30-Min ChartThe chart shows the 30-minute timeframe of XAU/USD (Gold Spot vs. U.S. Dollar) with a clear Smart Money Concepts (SMC) analysis using LuxAlgo indicators. The market recently experienced a sharp drop after hitting a resistance zone marked by an order block and a weak high near the 3,976 level. Currently, the price is retracing after tapping into a strong demand zone around 3,947–3,950, suggesting potential bullish interest. The projected blue line indicates a possible bullish move after a short-term retracement, aiming for a return to the previous high. The RSI at around 43 signals neutral momentum, supporting the possibility of either consolidation or a reversal from this key support area.
XAUUSD - Bullish Reversal Zone Forming Near 3945 | SMCGold (XAUUSD) is showing potential bullish signs after reacting from the previous day’s low at 3945.
Price tapped into the Fibonacci 0.5–0.618 retracement zone, aligning perfectly with demand imbalance on the 15-min timeframe.
Key Insights:
📉 Previous Day Low: 3945 acts as liquidity grab zone
🟨 Fib Confluence: 0.5–0.618 golden pocket
🔄 Expectation: Possible pullback → higher low → push toward 3990–4020
📈 Bullish confirmation above 3980
🚫 Invalid below 3940 (clean break of structure)
This setup aligns with Smart Money Concepts (SMC) — expecting a liquidity sweep + market structure shift before continuation.

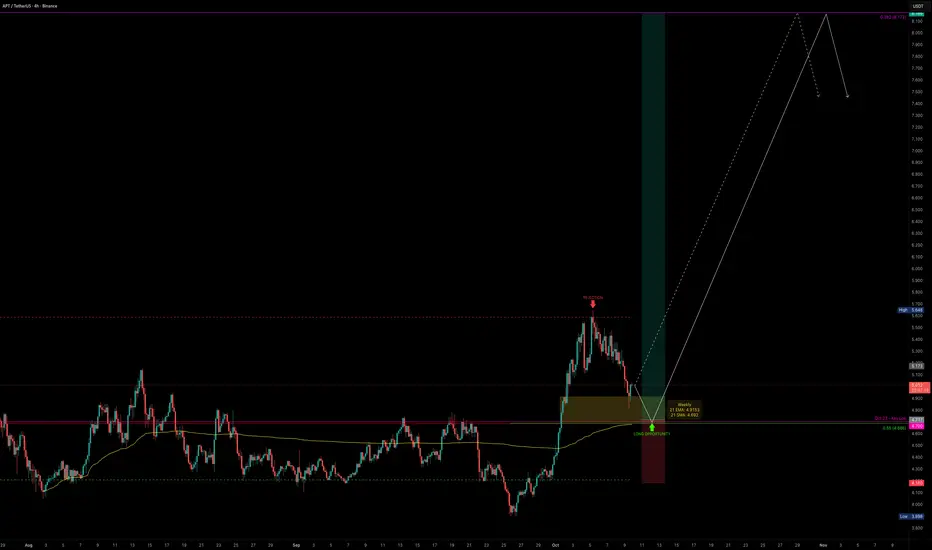
APT — 248 Days of Consolidation, Breakout PotentialAPT has been trading sideways for the past 248 days, building a massive base of consolidation. Things are starting to get interesting.
Recently, APT made its first real attempt to break above the yearly VWAP core (~$5.6) but got rejected, completing a 5-wave impulse right at this resistance zone. The rejection was no surprise: it lined up perfectly with the VAH of the 248-day trading range and the 4B market cap resistance at $5.69.
Now, after a strong impulse, we are in correction mode and this could set up the next major swing long opportunity.
🟢 Support Confluence Zone ($5.0–$4.5)
POC of 248-day range: $4.685
Anchored VWAP (from Aug low): sits right at the POC
Key Low (Oct 2023): $4.70
0.55 Fib retracement (of 5-wave impulse): $4.686
21 Daily EMA/SMA: $4.847 / $4.7
21 Weekly EMA/SMA: $4.915 / $4.69
200 4H EMA/SMA: $4.7 / $4.582
All confluences point to this being a critical support zone that bulls must defend.
🔴 Resistance Zone ($5.6–$5.7)
Yearly VWAP core (~$5.6)
VAH of 248-day range (~$5.6)
4B Market Cap resistance (~$5.69)
This zone remains the big wall to break. Once cleared with strong volume, upside potential opens significantly.
Freshly built (unpublished) Anchored VWAP Suite , which provides VWAP tracking:
Fair Value Trend Model :
Trade Setup
Long Entry: Ladder between $5.0–$4.5
Invalidation: Below VAL of range
Targets: $5.7 (major resistance), $7 (Fair Value), $8.172 (0.382 Fib)
Potential swing setup with R:R of 1:6+
Possible gain of +70% if structure holds and volume confirms breakout
Quick Take
APT is sitting at one of the most important support zones of the year. If this base holds, it sets up a high-probability swing long with great upside potential. All eyes are on whether bulls can reclaim momentum and finally break through the $5.7 wall.
🔍 Indicators used
Multi Timeframe 8x MA Support Resistance Zones → to identify support and resistance zones such as the weekly 21 EMA/SMA.
Fair Value Trend Model → Calculates a regression-based fair value curve
➡️ Available for free. You can find it on my profile under “Scripts” and apply it directly to your charts for extra confluence when planning your trades.
_________________________________
💬 If you found this helpful, drop a like and comment!
Bullish Retracement Setup on Gold (XAU/USD)a bullish retracement setup on Gold (XAU/USD) in the 30-minute timeframe. After a downward correction, price has bounced from a minor support zone and is now showing signs of recovery toward the previous resistance area (target zone). The setup features a defined entry zone, stop-loss below the support, and target at the resistance level—indicating a favorable risk-to-reward ratio for a long (buy) position.

Gold Retesting Support – Bullish Continuation ExpectedGold (XAU/USD) is showing strong bullish momentum after a brief consolidation around the support zone. Price is currently retesting the breakout level, indicating potential continuation toward the upper resistance area. The bullish engulfing candles and higher lows suggest sustained buying interest, favoring long positions above the support level.
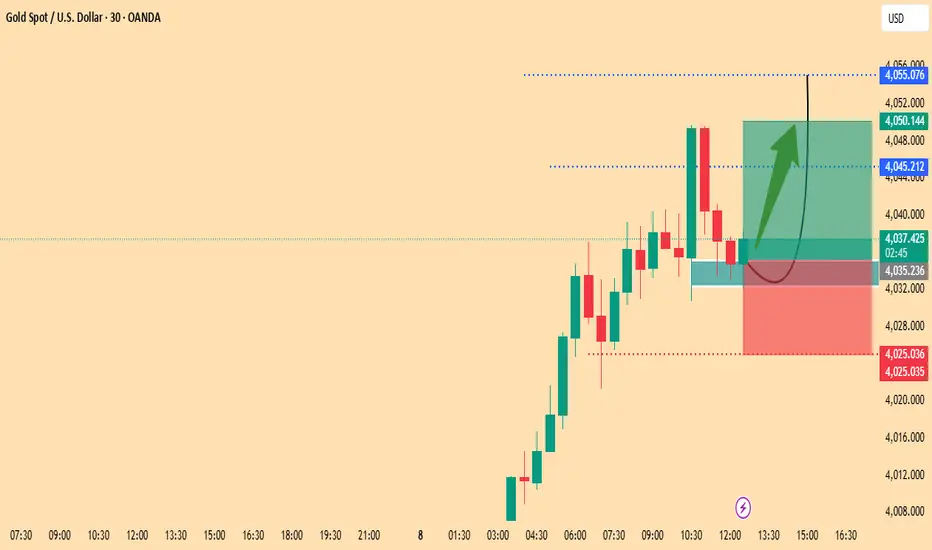
Gold (XAU/USD) – Bullish Channel Continuation SetupGold (XAU/USD) continues to trade within a strong ascending channel on the 30-minute chart, showing clear bullish momentum. Price action has respected the lower trendline support multiple times, confirming steady buying interest.
Key Levels:
Entry Zone: Around 4031
Target: 4051
Stop Loss: 4019
Technical Outlook:
Gold maintains a solid uptrend structure with consecutive higher highs and higher lows. The price is currently consolidating near mid-channel, preparing for a potential push toward the upper boundary and target zone around 4050+. As long as price holds above 4020, the bullish bias remains valid.
Trade Idea:
Buy on minor pullbacks within the channel, aiming for the upper resistance line near 4051. A break below 4020 would invalidate the setup.

Gold (XAU/USD) – Bullish Continuation Setup Toward $4,000 Target
You said:
Uploaded image
analyze this chart and give suitable chart
ChatGPT said:
This chart shows the Gold Spot (XAU/USD) on the 1-hour timeframe, and it outlines a potential long (buy) setup. Let’s break down the analysis:
🧠 Chart Overview
Instrument: Gold Spot / U.S. Dollar (XAU/USD)
Timeframe: 1 Hour
Broker Feed: OANDA
Current Price: ≈ 3,960.21 USD
Date: October 7, 2025
📊 Technical Analysis
1. Trend Context
The recent candles show higher lows forming after a small pullback — a sign of bullish continuation.
Price structure indicates accumulation around the 3,950–3,960 range before a potential push upward.
2. Support and Resistance
Support Zone: ~3,940.93
→ This acts as the base for the bullish setup; a break below may invalidate the trade.
Target / Resistance Zone: ~4,001.07
→ This is the projected take-profit zone, near a psychological level (4,000), which often acts as a strong barrier.
3. Trade Setup Summary
Entry Zone: Around 3,960.60 (current price)
Stop Loss: Around 3,935.12
Take Profit: Around 4,000.84
This gives an approximate Risk-to-Reward Ratio (RRR) of 1:2, which is a favorable setup for swing or intraday traders.
📈 Outlook
Bias: Bullish (buy)
Confirmation Needed: A break and close above 3,965 on the 1H chart with increasing volume.
Invalidation: A 1-hour candle close below 3,940 would suggest bearish momentum or a false breakout.

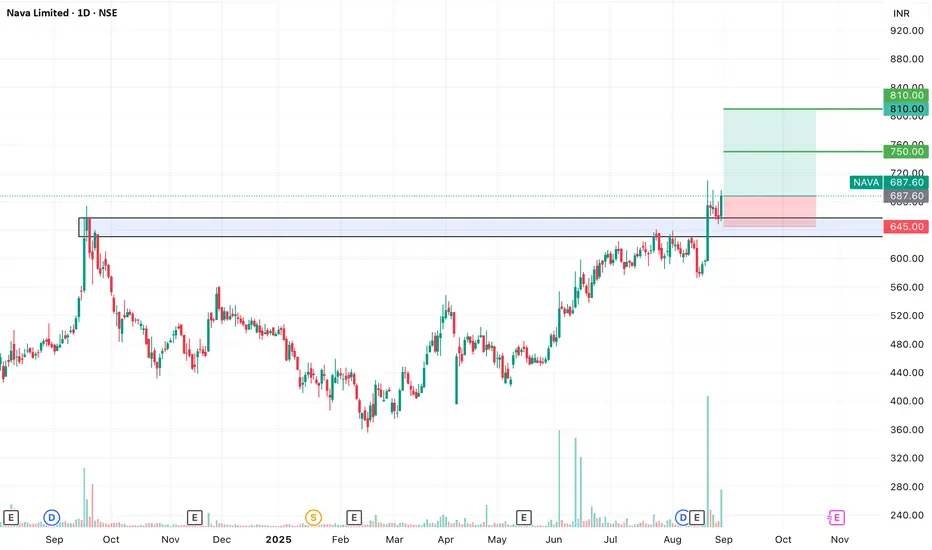
SWING IDEA - NAVA Nava Ltd , a diversified natural resources and energy company, is showing a promising swing opportunity with a breakout backed by strong technical signals.
Reasons are listed below :
Cup and Handle breakout, a strong bullish continuation pattern
Confirmed bullish price action post breakout
Bullish engulfing candle on the daily timeframe
Volume spike, confirming breakout strength
Trading near its 52-week high, showing momentum
Sustaining above 50 & 200 EMA on the daily chart
Target - 750 // 810
Stop loss - daily close below 645
DISCLAIMER -
Decisions to buy, sell, hold or trade in securities, commodities and other investments involve risk and are best made based on the advice of qualified financial professionals. Any trading in securities or other investments involves a risk of substantial losses. The practice of "Day Trading" involves particularly high risks and can cause you to lose substantial sums of money. Before undertaking any trading program, you should consult a qualified financial professional. Please consider carefully whether such trading is suitable for you in light of your financial condition and ability to bear financial risks. Under no circumstances shall we be liable for any loss or damage you or anyone else incurs as a result of any trading or investment activity that you or anyone else engages in based on any information or material you receive through TradingView or our services.
@visionary.growth.insights
Trade Idea: Short EUR/NZD (Swing TradeThis setup is a classic harmonic-driven short trade, executed on the H4 timeframe with a broader outlook extending into the D1 chart. The chart showcases a well-formed bearish harmonic pattern—likely a Gartley or Bat—anchored at points X, A, B, C, and D. The completion of the pattern at point D aligns with a key resistance zone, suggesting a potential reversal and bearish momentum ahead.
📉 Entry, Stop-Loss, and Target
- Entry Zone: Around 2.0070–2.0173, where price has recently tested the harmonic completion and shown signs of rejection.
- Stop-Loss (SL): 2.0135, placed just above the pattern’s invalidation point and recent swing high to protect against false breakouts.
- Target Zone: 1.9920 to 1.9956, which coincides with a clearly marked Demand Zone on the chart. This area has historically attracted buying interest and could act as a strong support level.
📊 Risk/Reward Profile
This trade offers a Risk/Reward ratio greater than 2, which is ideal for swing setups. With a relatively tight stop and a well-defined target zone, the trade balances risk prudently while aiming for a meaningful reward. The smaller green box within the setup visually confirms this favorable RR profile
🔍 Technical Confluence
- Bearish Harmonic Pattern: Suggests exhaustion of bullish momentum and a high-probability reversal.
- Demand Zone Target: Acts as a magnet for price, supported by historical buying pressure.
- Candlestick Structure: Recent price action shows rejection wicks and bearish candles near the entry zone, reinforcing the short bias.
- Timeframe Synergy: H4 chart provides precision for entry and SL, while the D1 chart supports the broader swing outlook.
🧭 Trade Management Tips
- Monitor price behavior as it approaches the demand zone—partial profit-taking near 1.9956 could be wise.
- If momentum accelerates, consider trailing the stop to lock in gains.
- Avoid over-leveraging; this setup is technically sound but still subject to macroeconomic volatility.

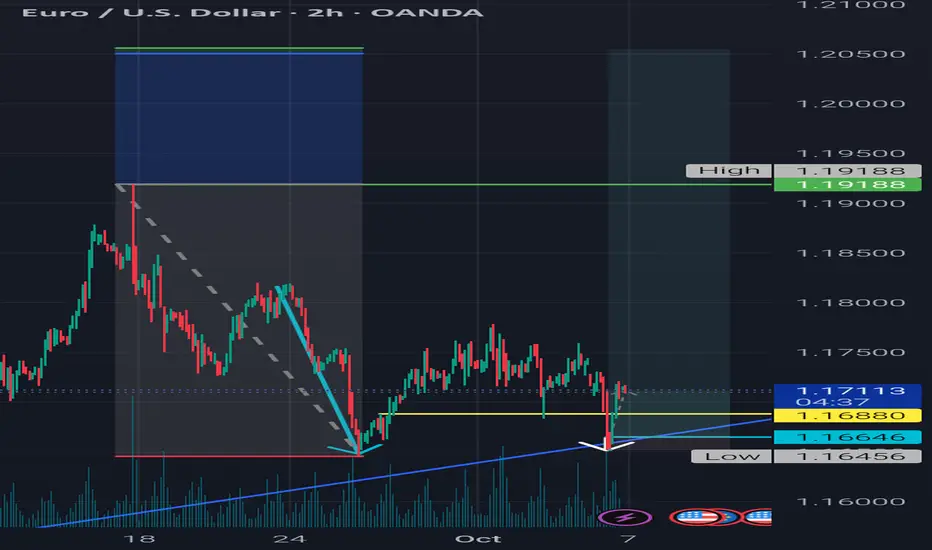
Momentum-Backed Retracement + Volume Retest | BadgerFX 📊 This setup establishes directional bias from the monthly chart (Current Bias: 📈 Bullish). The trade idea integrates momentum-driven retracements in line with this bias and validates continuation through structure and volume on the 15m.
📍 1.16880 confirmed the shift in structure, supported by volume, reinforcing alignment with the monthly trend. Final execution 🎯 relies on candlestick precision for entry timing.
⚠️ Disclaimer: The information shared here is for educational and entertainment purposes only and should not be considered financial advice.
BadgerFX 🦡 – Honey Badger Don’t Care
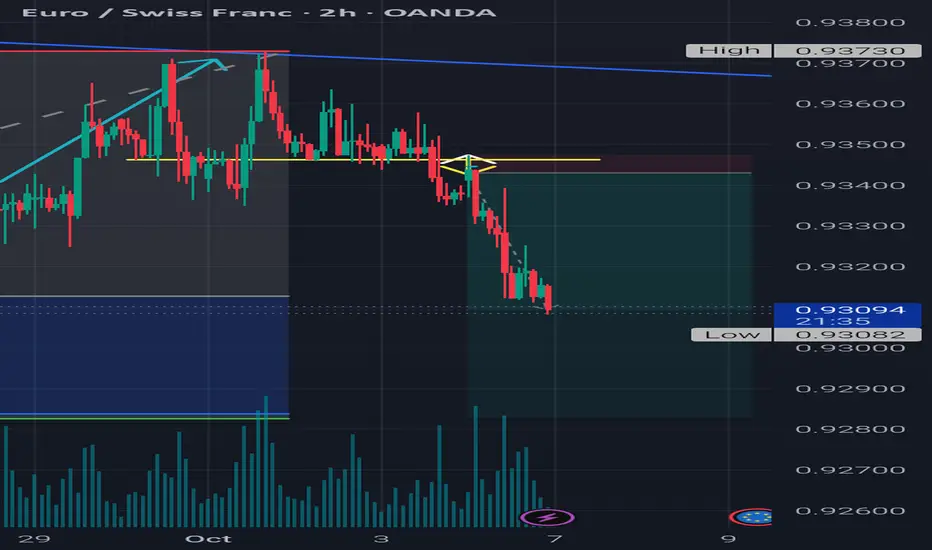
Momentum-Backed Retracement + Volume Retest | BadgerFX 📊 This setup establishes directional bias from the monthly chart (Current Bias: ). The trade idea integrates momentum-driven retracements in line with this bias and validates continuation through structure and volume on the 15m OANDA:EURCHF .
📍 0.93462 confirmed the shift in structure, supported by volume, reinforcing alignment with the monthly trend. Final execution 🎯 relies on candlestick precision for entry timing.
⚠️ Disclaimer: The information shared here is for educational and entertainment purposes only and should not be considered financial advice.
BadgerFX 🦡 – Honey Badger Don’t Care
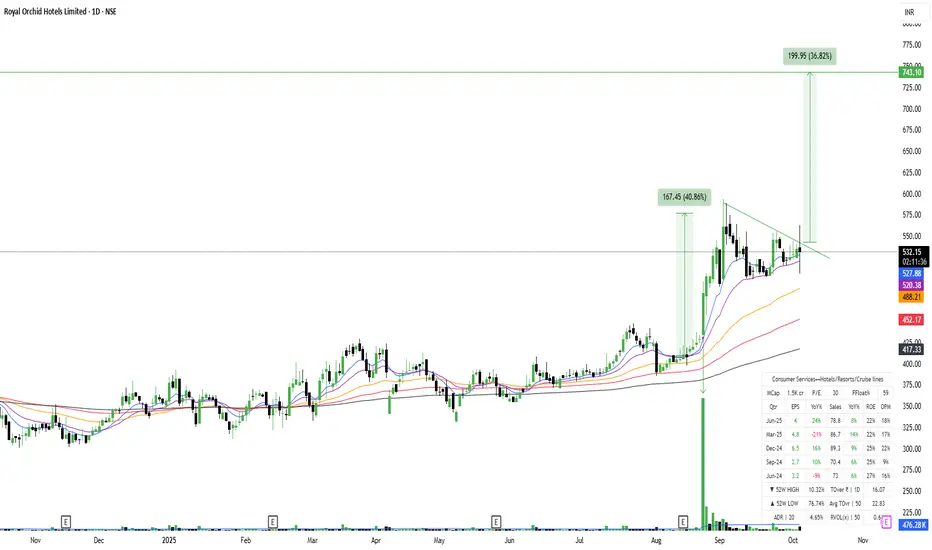
ROHLTD = Descending Triangle Breakout + Volume SurgBreakout from Descending Triangle with Volume Surge in Royal Orchid Hotels
NSE:ROHLTD
📈Pattern & Setup:
Royal Orchid Hotels has given a breakout from a descending triangle pattern on the daily chart. The price successfully closed above the downtrend line, supported by a visible surge in trading volume.
The setup indicates a shift in momentum from sideways to bullish, with strong support from the moving averages (20EMA, 50EMA, and 100EMA) all trending upward. The stock has been consolidating between 480–550 for weeks, and now this breakout confirms renewed buying interest.
📝 Trade Plan:
Entry: Current levels 528–532 look good for a fresh entry.
🚩Stop-Loss: 495 (below recent swing support).
🎯Targets:
Target 1 → 620 (previous swing high).
Target 2 → 743 (measured breakout target with nearly 37% upside).
💡Pyramiding Strategy:
1. Enter first lot near 530–535.
2. Add above 565 after volume confirmation, trail SL to 515.
3. Add final lot above 620, trail SL to 560.
Hold positions for a medium-term swing till 740 zone as long as the price sustains above 500.
🧠Logic Behind Selecting this Trade:
The stock displays a textbook breakout from a descending triangle after weeks of tight range movement — a sign of absorption and strength. The presence of rising EMAs beneath price further strengthens the bullish outlook.
The hospitality sector has shown strong tailwinds lately, and Royal Orchid’s structure aligns perfectly with the sectoral momentum.
Keep Learning. Keep Earning.
Let's grow together 📚🎯
🔴Disclaimer:
This is not an investment advice. Always do your own due diligence before making any trading or investment decision.
HINDALCO : Position initiated with 1% riskTook a position in Hindalco with a 1% risk allocation. With be targeting a 1rr move. The target may be adjusted depending on the overall market behaviour and price action in the coming days.
The stock has given a clean breakout and closed above its previous all-time high, following a well-defined basing formation. Volume activity shows contraction during the basing phase and expansion during the breakout, suggesting institutional participation. While the expansion is not highly explosive, there is a noticeable rise in activity during the breakout candle formation, confirming strength in the move.
From a fundamental perspective, Hindalco has maintained consistent growth in both EPS and Sales across the last few quarters, barring the recent June quarter which showed a temporary decline in line with broader market weakness. The data shows a clear upward trajectory overall.
Operational performance remains solid, with both ROE and OPM holding steady, reflecting healthy margins and efficient capital utilisation.
The broader market context also supports this bias. Nifty has regained strength after a brief dip below its EMA levels and is now trending upward with clear momentum. The index structure indicates a continuation bias, favouring long setups in fundamentally strong stocks.
📢📢📢
If my perspective changes or if I gather additional fundamental data that influences my views, I will provide updates accordingly.
Thank you for following along with this journey, and I remain committed to sharing insights and updates as my trading strategy evolves. As always, please feel free to reach out with any questions or comments.
Other posts related to this particular position and scrip, if any, will be attached underneath. Do check those out too.
Disclaimer : The analysis shared here is for informational purposes only and should not be considered as financial advice. Trading in all markets carries inherent risks, and past performance is not indicative of future results. It’s essential to conduct your own research and assess your risk tolerance before making any investment decisions. The views expressed in this analysis are solely mine. It’s important to note that I am not a SEBI registered analyst, so the analysis provided does not constitute formal investment advice under SEBI regulations.

Resistance retest complete?This retest represents a retracement back to the previous lower high — a key structural point in the trend. Given the current market momentum and weakening reaction at that level, there’s a strong likelihood that this lower high will be broken, potentially signaling a shift in trend or continuation of bullish pressure beyond that point.

Weekly Market Wrap: Nifty, BankNifty & S&P 500 OutlookNifty closed the week at 24894, gaining 240 points from the previous week. The index made a high of 24904 and a low of 24587, once again respecting the range I mentioned last week — 25050–24250.
From the week’s low of 24587, we’ve seen a sharp bounce back toward 24900, exactly as projected.
Nifty Outlook for Next Week
For the coming week, I expect Nifty to trade between 25300–24500.
A breakout or breakdown beyond this range could bring some real fireworks
Bullish Scenario:
If Nifty sustains above 24900/24950 on Monday, we could see a rally toward 25300, supported by strength in Banking, Financials, and Metal sectors.
Bearish Scenario:
Below 24750, bears might get an opening to drag Nifty toward 24500 — though, as of now, that looks less likely unless global sentiment weakens.
⚠️ Caution:
While short-term momentum looks positive, the monthly and weekly charts of Nifty still lack strong bullish confirmation. Those waiting to capture a big 800–1000-point breakout move should be patient until we see a clear bullish crossover on higher timeframes.
Sector Spotlight: Metals
As mentioned last week, Metals continued to shine, with the Metal Index up 4% this week!
It also gave an all-time high weekly close above 10220, a key breakout level.
If it sustains above 10220 next week, the index can rally another 4% toward the next major resistance at 10709.
👉 Keep your eyes on metal stocks hitting new all-time highs (ATHs) — momentum could stay strong here.
BankNifty Update
BankNifty is forming a W pattern on the weekly timeframe — a strong bullish reversal formation.
Stay alert for potential breakouts in leading banking stocks, as they might fuel the next leg of the rally.
Global Cues – S&P 500
The S&P 500 gave an all-time high close at 6715, up 72 points from last week.
If it sustains above 6700, expect a move toward 6780.
For investors already long — move your trailing SL to 6560 to protect profits.
For those waiting to enter — 6568/6570 offers a better risk–reward entry zone.
Key Takeaways
✅ Nifty range for next week: 25300–24500
✅ Bulls need 24950+ for continuation; bears only active below 24750
✅ Metals remain the sector leader
✅ BankNifty W pattern could fuel the next upmove
✅ S&P 500 remains in a strong uptrend — global sentiment supportive

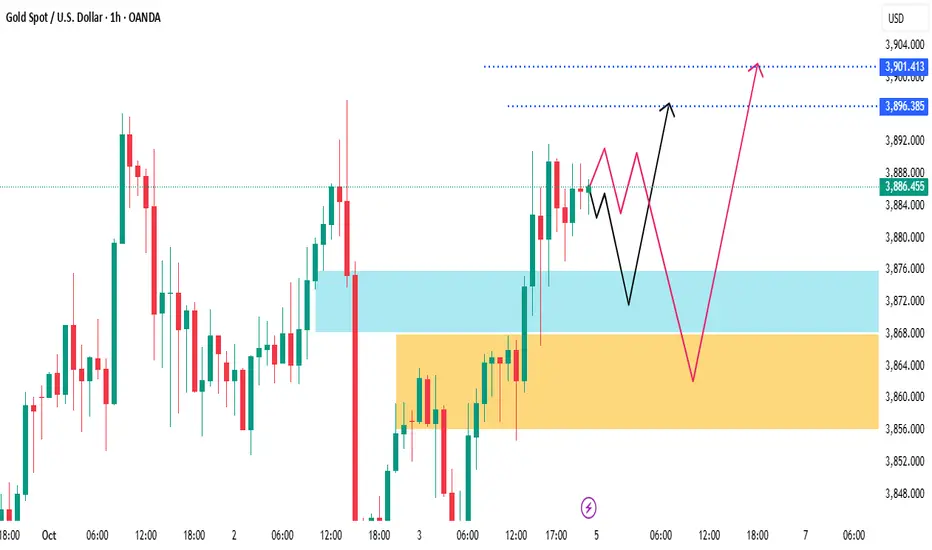
Gold Price Setup: Pullback Before Breakout ?🔎 Key Elements Identified:
Current Price: $3,886.455
Zones:
Blue Zone (~$3,872–$3,880): Minor support zone — recent breakout retest area.
Orange Zone (~$3,856–$3,868): Strong demand zone — deeper retracement area.
Resistance Targets:
$3,896.385: Local resistance.
$3,901.413: Extended upside target.
🛠️ Price Projections:
Black Path (Shallow Pullback):
Small dip into blue zone.
Reversal and break above $3,896 → Target: $3,901.
Red Path (Deeper Pullback):
Deeper drop into orange demand zone (~$3,860).
Strong bullish reversal expected → Same final target: $3,901+.
Looking for a daytrade on BBAI! OptionsMastery:
🔉Sound on!🔉
📣Make sure to watch fullscreen!📣
Thank you as always for watching my videos. I hope that you learned something very educational! Please feel free to like, share, and comment on this post. Remember only risk what you are willing to lose. Trading is very risky but it can change your life!

AJMERAThis stock has breakout small resistance level so further up move will come up to all time high
and this is just for educational purpose

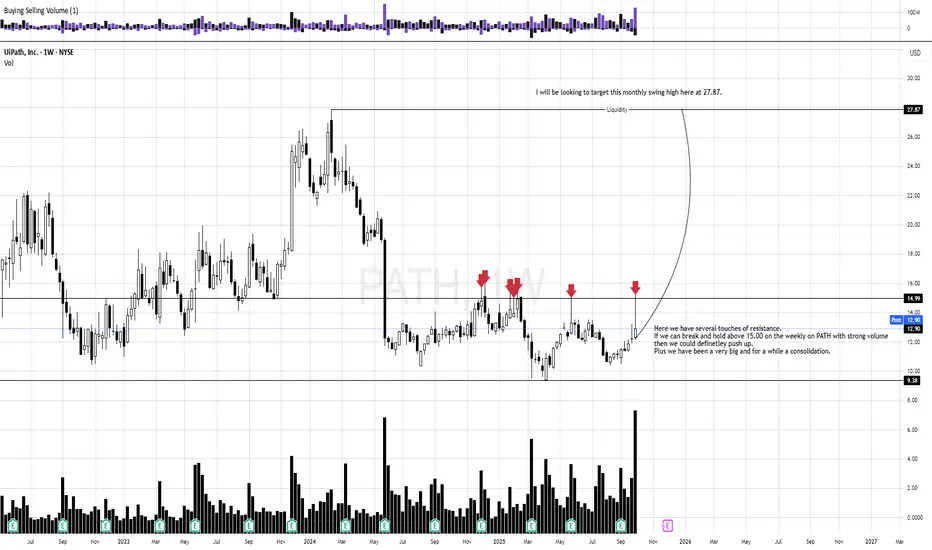
PATH breakout potential?Please reference to the photo why I am looking for a breakout, what my criteria's are and where I will be looking to target. Thank you as always for checking out my post!
Gold (XAU/USD) Bullish Reversal Setup with Short-Term ?✅ Trade Setup Summary:
Trade Type: Long (Buy)
Entry: Around $3,860.17
Stop Loss: $3,850.01
Take Profit Levels:
TP1: $3,870.32 (minor resistance)
TP2: $3,872.93 (next significant resistance)
TP3: $3,875.01 (potential breakout target)
TP4 (Extended): $3,880.01 (final target zone)
🔍 Technical Observations:
Reversal Pattern: After a steep drop, the price is showing signs of a bullish reversal with a series of higher lows.
Support Level: The $3,850.01 area acted as a strong support zone.
Bullish Momentum: Green candles dominating the recent session show buyers regaining control.
Resistance Zones: Blue dotted lines indicate key resistance levels where price may face selling pressure.
Risk-Reward Ratio: The current setup offers a favorable risk-reward, especially if price breaks $3,870.
📌 Conclusion:
This is a bullish short-term trade setup in Gold, targeting a move toward the previous resistance levels after a recovery from the $3,850 support zone. Confirmation of bullish momentum above $3,870 could open the door for further upside.

OrissaMine Positional Swing candidateChart Analysis:
The stock has formed a flat base pattern and is now showing a breakout with strong volumes, indicating strength in the move. The weekly chart structure also supports the bullish outlook. A long position can be considered around the 5400–5450 zone.
Key Levels:
•Entry: 5400–5450
•Targets: 5750 / 5930 / 6130 / 6300
•Stop-loss (short term): Daily close below 5200 (strict SL for smaller targets)
•Stop-loss (positional 3–4 months): Daily close below 4700
Disclaimer:
I am not SEBI registered. This analysis is for educational purposes only and not investment advice. Please do your own research before trading or investing.