GBPUSD overhead supply keeps pressure, downside targets in focusGBPUSD once again tested the main supply zone around 1.3740, from where the market has repeatedly reversed lower. On the daily chart, the pair shows a series of lower highs, and the close below local support signals growing seller pressure.
The first downside target is near 1.3350, where initial profit-taking may occur. The next area is 1.3175, a stronger support level established earlier in the year. If bearish momentum develops further, 1.2900 becomes the key downside target to watch.
From a fundamental perspective, the pound remains under pressure due to Bank of England policy uncertainty, weak UK economic data, and the relatively hawkish stance of the Federal Reserve supporting the dollar. As long as the market trades below 1.3740, the bias remains toward the downside.
Swingtrading

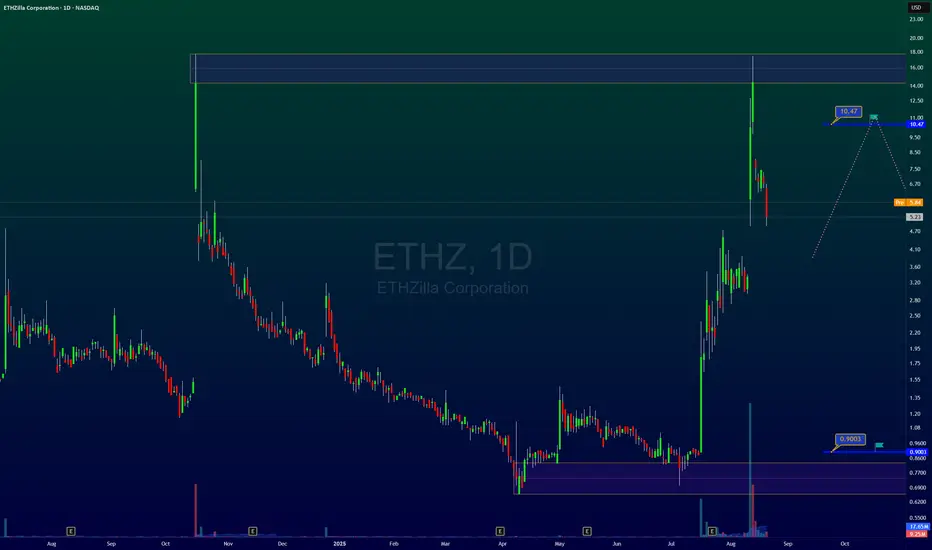
ETHZ and time to save 1900% profitAfter the excellent 19-fold growth in the company's shares and the correction, if you do not exit, it will return to the specified ceiling range, and this time you will have a very good opportunity to save profits and exit, or enter a short position and re-enter at the bottom range and this time buy 19 times more shares.
Stay with me and be profitable
Do you have any questions? Ask me in the comments
Don't forget to introduce me to your friends so that we can all profit together?
What do you have in mind that I should analyze for you? Comment for me.
TTD crashIn the long term, this stock is in a side cycle and after seeing the top, it starts moving towards the bottom and goes through the natural market cycle, but very fast and intense.
The first support area for this stock is $48-50 and if it encounters strong buyers, it will move towards $69 and after correction to $125-127.
But if the bottom area is broken correctly, the target of this big and fast drop will be a price return to 19.
Be with me to enter and exit on time
Every boost and follow is a double motivation to continue

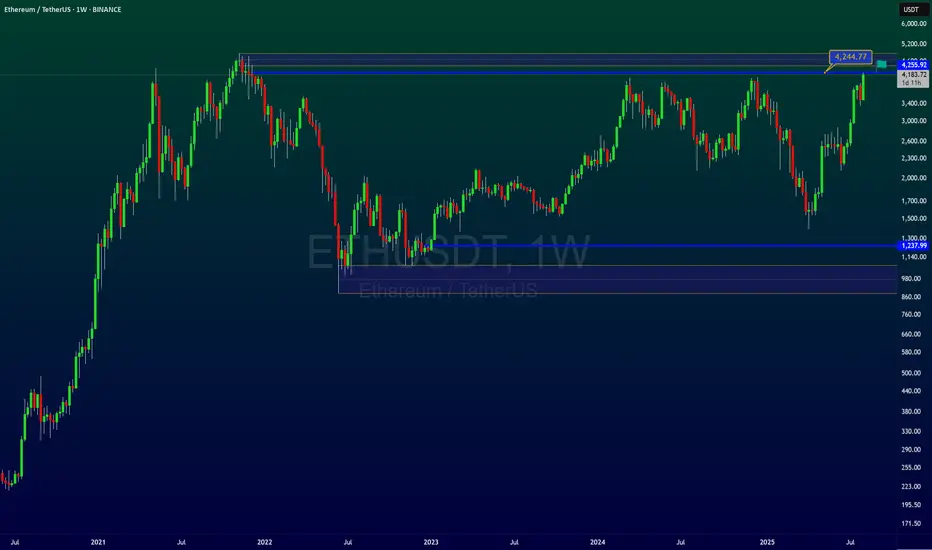
ETH all time high or reverse????Ethereum has returned to the top after a long time and is on the verge of breaking the top, but in my opinion this will not happen. Of course, it is possible to see new prices, but then it will enter a correction and this will happen in the next move that will start in the future.
So we should wait for a very good entry with a cheap and lower price.
Stay with me and boost me after introducing me to your friends.
AVAX — 220-Day Range Broken, Next Stop $35?After 220 days of consolidation, AVAX has finally broken out of its trading range. The key resistance at $27 was cleared, and price quickly pushed into the $30 psychological level, where it faced rejection. Currently, AVAX is consolidating just below, around $29.
So, what’s next? Now all eyes are on the retest to confirm $27 as the new launchpad.
Support Confluence (Long Entry Zone)
3M/Quarterly level: $27.71 → major support
0.382 Fib retracement: $27.65 (low $23.87 → $30)
0.5 Fib retracement: $26.93 → perfectly aligned with $27 zone
Swing High: $27.38 → could be retested
4H 21 EMA: $27.71
4H 21 SMA: $27.41
Weekly VWAP: $27.41
Fair Value Gap (FVG): imbalances in this zone
📌 With all these layers of confluence, the $27.7–$27.4 zone is the ideal long entry area.
Resistance Confluence (Take Profit Zone)
0.5 Fib retracement of the entire downtrend: $35.22
15B Market Cap resistance: $35.5
Yearly Open: $35.7 → major target
3M/Quarterly level: $35.71
TPO resistance cluster: $35.22–$37.28
📌 Together, these levels form a stacked resistance zone at $35–$37, making it both the ideal take-profit area and a potential short setup.
Zoomed-Out View:
TPO Chart Reference:
🟢 Long Trade Setup
Entry Zone: $28.0 → $27.4 (DCA best approach)
Stop-Loss: Below $26 (to be adjusted after reversal confirmation)
Take Profit: $35
Potential Gain: +25%
R:R: 1:4+
Technical Insight
After 220 days of sideways compression, the breakout above $27 marks a shift in market structure.
A retest of this level would validate it as new support and provide a high-probability swing long setup.
The $35–$37 zone, reinforced by the yearly open at $35.7, stands out as the major resistance cluster, making it both the ideal profit target and a potential reversal area.
Key Levels to Watch
Support Zone: $28–$27
Resistance Zone: $35–$37
🔍 Indicators used
DriftLine — Pivot Open Zones → For identifying key yearly/monthly/weekly/daily opens that act as major S/R reference points
Multi Timeframe 8x MA Support Resistance Zones → to identify support and resistance zones such as the 4H 21 EMA/SMA.
➡️ Available for free. You can find it on my profile under “Scripts” and apply it directly to your charts for extra confluence when planning your trades.
_________________________________
💬 If you found this helpful, drop a like and comment!

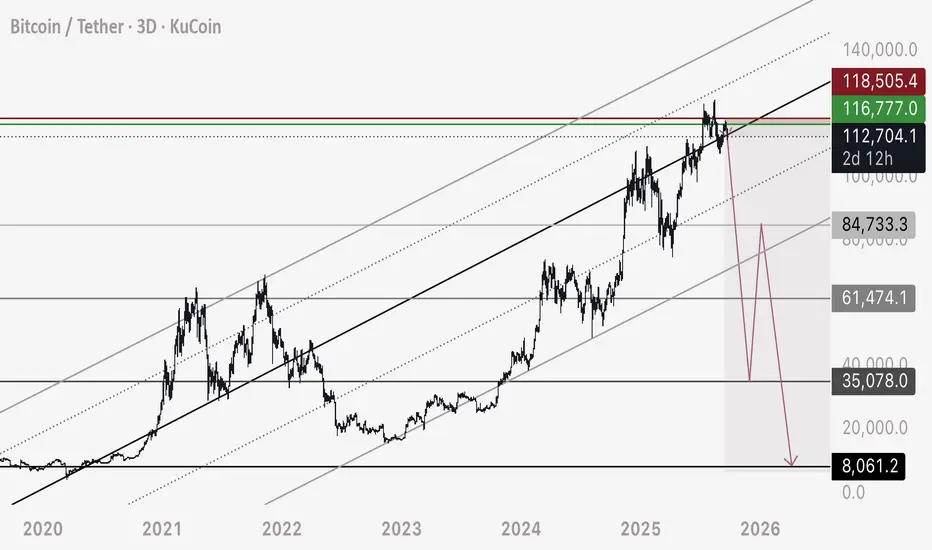
BTC - Short Initiated from Channel Breakdown Short Update going to plan.
Updated numbers and anticipated 3 wave corrective drop marked on chart.
113,000 to 35,000 (SHORT)
35,000 to 84,000-85,000 (LONG)
84,000 to 8,000 (SHORT)
For my personal trade I will be closing roughly 80% of short at 40,000-45,000
I will then look for a hold and rise from the 35,000 region to validate that we will see this corrective move. I believe there is a high probability of this - reasons I will detail more as the trade progresses. Chart would be too messy if I included all information on future confluences and pivot points.
If I see this rise occur, I will hold the 20% original short - and hedge with a long as well to 80,000 - 35,000 to 80,000
The reason the market is dropping is once again:
1. The significance of DXY breaking down a major multi month bearish channel
2. The fact that this is a bearish retest on BTC HTF - not a bull market or bull pattern
3. There is a mass amount of liquidity held in open longs in Bitcoin - we need to see a severe deleveraging of these low zones to remain bullish
Happy trading - please see related linked ideas.
GBPJPY: Bearish Outlook Explained 🇬🇧🇯🇵
GBPJPY formed a bearish imbalance candle on Friday,
breaking a solid rising trend line and forming a confirmed
Change of Character CHoCH.
The broken trend line and horizontal structure compose
a significant supply area now.
With a high probability, the price will drop lower from that.
Goal - 199.0
❤️Please, support my work with like, thank you!❤️
I am part of Trade Nation's Influencer program and receive a monthly fee for using their TradingView charts in my analysis.

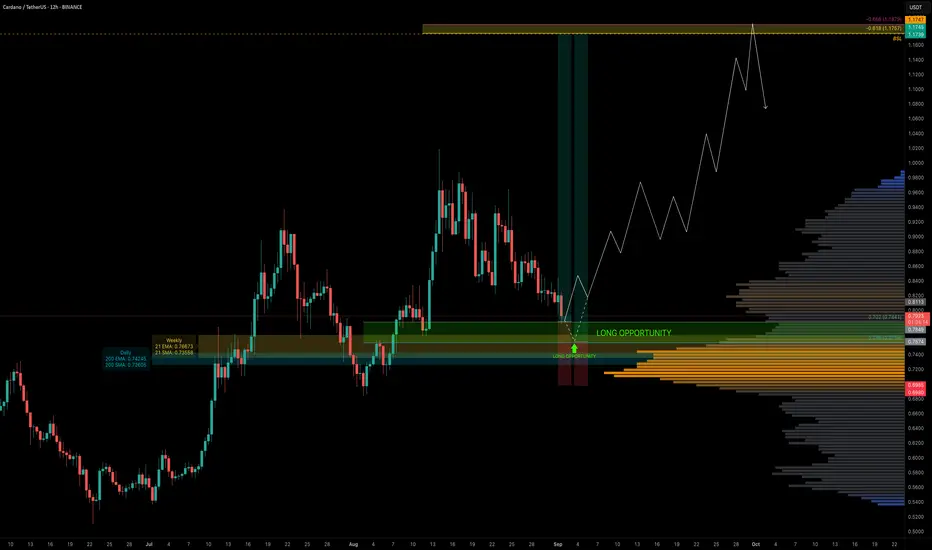
ADA — Fib Harmony With EMA/SMA SupportADA has been in a downtrend for the past 18 days and is now approaching a cluster of key support levels. Today, price tapped the 0.702 Fib retracement ($0.7841) — an optimal area for long entries.
The main focus, however, is the 0.786 Fib retracement, which aligns with a liquidity pocket and multiple layers of confluence, making it the most ideal entry zone.
🧩 Confluence at 0.702–0.786 Fib Zone
0.702–0.786 Fib retracement → prime long entry range
Liquidity pocket → sitting around the 0.786 Fib
200 EM ($0.7424) / 200 SMA ($0.726) (daily)
21 EMA ($0.766) / 21 SMA ($0.735) (weekly)
Pitchfork lower support line → intersecting the zone
0.618/0.666 Fib Speed Fan → adding another support layer
🟢 Long Trade Setup
Entry Zone: 0.702–0.786 Fib retracement
Best Entry: Around the 0.786 Fib
Stop-Loss: Below $0.70 (to be adjusted after seeing more price action)
Target (TP): $1.1757 (–0.618 Fib, in confluence with key high & buy-side liquidity at $1.1747)
Potential Move: +50%
R:R: ~1:4.5 up to 1:7 (depending on entry)
Technical Insight
ADA is testing deeper retracements within its current downtrend, the 0.702–0.786 Fib zone combines structural, dynamic, and liquidity-based confluence.
The added support of the weekly 21 EMA/SMA strengthens this area as a pivotal level for bulls to defend.
If held, this zone could fuel a swing long setup with great upside potential.
The $1.1747–$1.1757 zone is both a high-confluence take-profit area and a potential short opportunity, given the liquidity resting above that level.
🔍 Indicators used
LuxAlgo — Liquidity Sentiment Profile (Auto-Anchored)
Multi Timeframe 8x MA Support Resistance Zones → to identify support and resistance zones such as the weekly 21 EMA/SMA
➡️ Available for free. You can find it on my profile under “Scripts” and apply it directly to your charts for extra confluence when planning your trades.
_________________________________
💬 If you found this helpful, drop a like and comment!
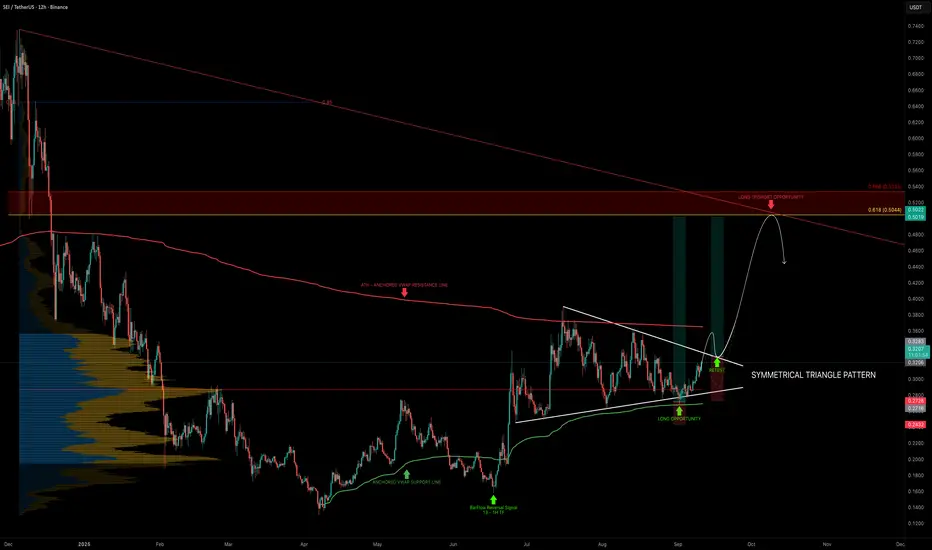
SEI — Triangle Pattern Breakout Ahead?SEI has been consolidating in a symmetrical triangle for the past 78 days, now reaching the apex, signaling that a big move is coming soon.
Price has been trading between two anchored VWAPs:
From the $0.13 low → acting as support (currently ~$0.27)
From the ATH → acting as resistance (currently ~$0.365)
The POC of the 280-day trading range sits at $0.287, a key pivot level to watch.
Support Confluence
Anchored VWAP (from $0.13 low): ~$0.27 (long entry zone already tested)
POC (280-day range): $0.287 → key stop-loss reference
Symmetrical triangle breakout retest: ~$0.33 → potential re-entry after breakout
Fib Speed Resistance Fan 0.618: ~$0.27 → reinforcing support at the anchored VWAP
Resistance Confluence
0.618 Fib retracement: $0.5044 → aligns with $0.5 key level
3B Market Cap resistance: ~$0.505
Fair Value Gap (FVG): sitting around $0.5
Trend-Based Fib Extension 1.0: $0.5 → major target confluence
🟢 Long Trade Setup
Entry Zone: Retest around $0.33 after breakout
Stop-Loss: Below $0.287 (POC), to be adjusted after seeing a clear reversal sign.
Target (TP): $0.50
Potential Gain: ~+50%
Timeframe: Could take ~1 month to play out
Technical Insight
SEI has been compressing for over two months, and volatility is about to expand.
The ideal entry at $0.27 (anchored VWAP support) has already triggered.
The next opportunity lies in a triangle breakout + retest around $0.33.
The $0.50 level stands out as a high-confluence target, combining Fib levels, market cap, FVG, and extension symmetry.
_________________________________
💬 If you found this helpful, drop a like and comment!
EURUSD: wedge narrowing with downside targets in sightOn the daily chart, EURUSD has formed a rising wedge pattern, and the current price action indicates readiness for a decline. Attempts to hold above 1.1800 have failed, pressure has increased, and last week’s close can be viewed as a potential false breakout.
The first downside target is at 1.1413, where a strong support level lies. Further targets may shift to 1.0750 and 1.0480 levels that have accumulated significant volume over the past few months. A full breakdown of the wedge would give momentum to the bearish scenario and increase pressure on the euro.
From a fundamental perspective, the picture remains mixed: the 200 EMA capping from above and the sideways movement in the dollar index confirm the likelihood of euro weakness, but every pullback continues to be aggressively bought, preventing a collapse. If the dollar gains additional support from US macroeconomic data or Federal Reserve policy, the bearish scenario will become dominant.

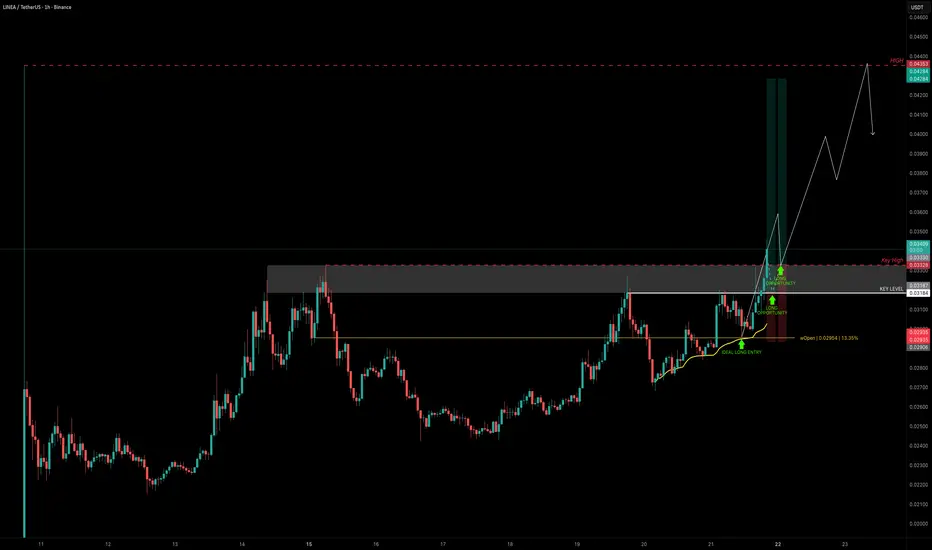
LINEA — $0.033 Key Break Could Unlock Big UpsideLINEA is starting to look interesting. Currently trading around $0.032 (~500M market cap), this level acts as resistance that needs to be broken for bullish continuation.
Earlier today, we already had a clean long setup from $0.03 support, in confluence with the weekly open ($0.02954) and anchored VWAP (yellow line), which held and gave a solid bounce.
Next Long Setup Idea
Entry 1: Watch for a breakout above the key high at $0.03328, then retest for confirmation.
Entry 2: Alternatively, a hold above $0.032 could offer a safer re-entry.
Stop-Loss: Below $0.03 support for now.
Targets
TP1: $0.036
TP2: $0.04
TP3: $0.043
Final Target: $0.065 (aligns with 1B market cap resistance)
This setup could yield:
+30% gain if exited around $0.043
+100% potential if momentum drives price into the $0.065 zone
Quick Take
A breakout and retest of $0.03328 would open the path toward the $0.036–$0.043 zone. If momentum continues, the 1B market cap resistance at $0.065 becomes a realistic macro target.
🔍 Indicators used
DriftLine — Pivot Open Zones → For identifying key yearly/monthly/weekly/daily opens that act as major S/R reference points
➡️ Available for free. You can find it on my profile under “Scripts” and apply it directly to your charts for extra confluence when planning your trades.
_________________________________
💬 If you found this helpful, drop a like and comment!
AEVO — 230 Days of Accumulation, Breakout AheadAEVO has been consolidating for the past 230 days in what looks like a Wyckoff accumulation between the 100M–150M market cap range. AEVO is now on the verge of breaking its long-term bear trend.
🟢 Long Setup Idea
Entry Zone: $0.13–$0.12
Stop-Loss: Below $0.11
Target: ~$0.35
Key Resistance Levels
Yearly Dynamic VWAP → $0.1384 → current resistance / key S/R zone
Anchored VWAP (Dec 7, 2024 high at $0.6549) → ~$0.17 → key resistance in confluence with the key highs → A clean break above this = bullish
150M Market Cap → $0.164 → major breakout level
Once cleared, significant upside potential opens up.
Higher Timeframe Targets
$0.35 Zone → Primary long target (POC of the 2024 trading range, yearly Open at $0.3614, 0.5 Fib retracement of the downtrend at $0.359)
$0.43 Zone → 0.618 Fib retracement of the downtrend, in confluence with the 400M market cap
$0.50 Zone → Anchored VWAP resistance + psychological level
$0.53 Zone → 0.786 Fib retracement
$0.55 Zone → 500M market cap resistance
Key Levels
Support → $0.12–$0.13
Resistance → $0.1606–$0.17 → $0.35 → $0.43–$0.55
🔍 Indicators used
DriftLine — Pivot Open Zones → For identifying key yearly/monthly/weekly/daily opens that act as major S/R reference points
➡️ Available for free. You can find it on my profile under “Scripts” and apply it directly to your charts for extra confluence when planning your trades.
_________________________________
💬 If you found this helpful, drop a like and comment!

BTC and correction Bitcoin entered a price correction and after seeing the range ahead, I expect to buy and in this move I expect the risk-free previous purchases to be activated with a medium-term view and I will enter the purchase at cheaper prices.
In every market move, before paying full attention to the analyses of others and prominent people, only pay attention to the reality of the market and the price trend.
Preserving capital is much more important than making profits.
Be with me and grow your account, slowly and steadily.
Boost me and introduce me to your friends so that everyone can profit together.

Weekly Market Outlook – Nifty, BankNifty & S&P 500Nifty ended the week on a positive note, closing at 25,327 – up 213 points from last week’s close. This week’s price action was once again perfectly aligned with my projected range of 25,500 – 24,700, making a high of 25,448 and a low of 25,048.
Nifty Outlook for Next Week:
I expect Nifty to trade within 25,700 – 24,900. A break below 24,900 could open the doors towards 24,600 / 24,400.
Sector Strength Check:
Looking at the monthly time frame, none of the major indices look particularly strong right now. On the weekly chart, strength is visible only in selective sectors like Consumption, FMCG, Metals, and a few Auto stocks.
⚠️ Caution: Until we see strength coming back in at least 3–4 major indices, it’s better to stay selective and avoid aggressive long positions.
BankNifty Analysis:
BankNifty has staged a sharp V-shaped recovery, but I am not fully convinced with this move.
Support to watch: 55,000 – a break below this can take it down to 54,700 / 54,600.
Resistance to watch: Above this week’s high of 55,835, it can test 56,000 / 56,400.
Expected Range: 56,400 – 54,550
India VIX Alert:
India VIX is currently near its support zone, which signals possible volatility ahead – so stay cautious.
Global Markets – S&P 500:
S&P 500 once again gave an all-time high close at 6,671 (+80 points WoW).
Breakout Levels: Above 6,671, we could see 6,689 / 6,780 / 6,930 / 6,959 (key level).
Investors holding long positions should keep a trailing SL at 6,450 to protect profits.

USDCHF SWING SELL PROJECTIONUSDCHF (1D TF)
While the lower timeframes are currently in an uptrend, be prepared for a potential higher timeframe bearish move later this week around the 0.80200–0.80500 daily supply zone. Wait for a clear shift in market structure before selling, with targets near the daily or nearby low at 0.79000.

EURNZD: Confirmed Break of Structure?! 🇪🇺🇳🇿
EURNZD broke and closed above a key daily horizontal resistance,
setting a new higher high higher close with a confirmed BoS.
With a high probability, the market will grow more.
Next resistance - 2.0128
❤️Please, support my work with like, thank you!❤️
I am part of Trade Nation's Influencer program and receive a monthly fee for using their TradingView charts in my analysis.
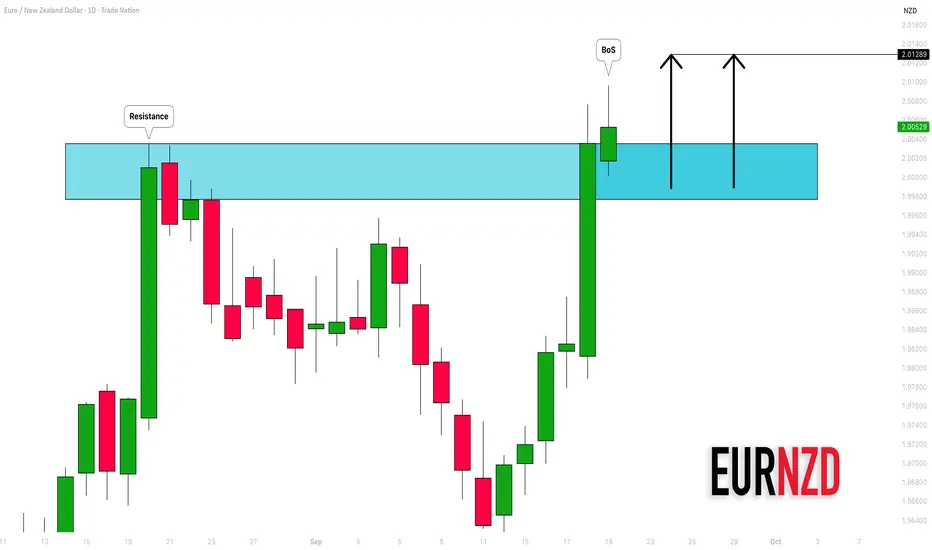
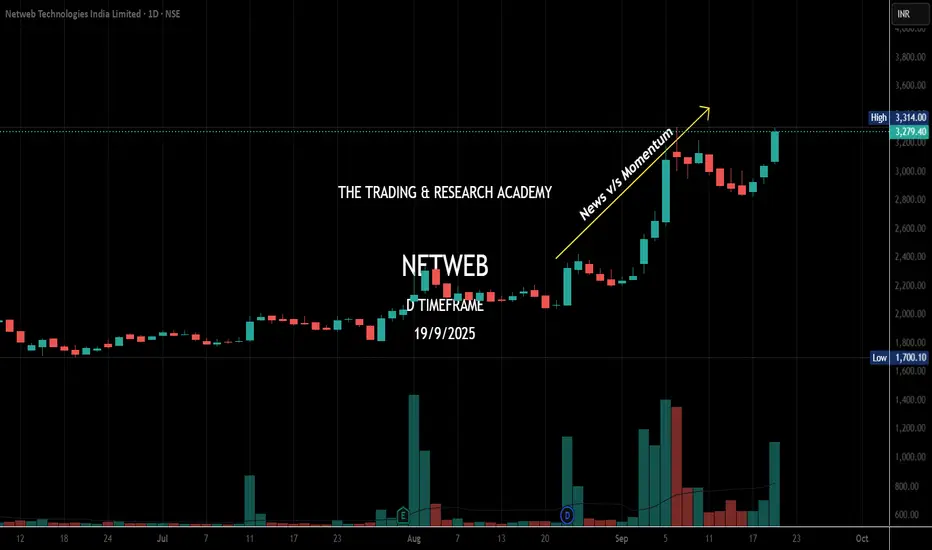
CHART SPEAKS- NETWEB TECHIn my chart speaks series, i have been writing about the charts which are rallying high & corresponding news hits the market later. It means the price is leading the news! This has started happening often lately.
THE NETWEB NEWS CAME TODAY & SEE THE CHART MOVING EARLY THIS MONTH!
Netweb technologies: Co secures rs. 450 crore order for Tyrone Ai GPU accelerated systems from leading Indian tech distributor
EURJPY: Important Demand Zone Ahead 🇪🇺🇯🇵
EURJPY updated the high on a daily, breaking and closing
above a key horizontal resistance cluster.
A broken structure and a rising trend line compose a significant
contracting demand zone now.
I will expect a bullish trend continuation from that and a move to 174.9.
❤️Please, support my work with like, thank you!❤️
I am part of Trade Nation's Influencer program and receive a monthly fee for using their TradingView charts in my analysis.

The best trade is the one where you can’t lose anymore.ALAB is up +122%. 🚀
Most traders would still be asking: Do I hold? Do I sell?
But here’s the beauty of risk management: once a position doubles, you don’t have to play that game anymore.
I pull out my original capital.
What’s left running is pure profit.
Risk = zero.
Upside = unlimited.
From this moment forward, the market is paying me to hold.
Even if ALAB crashes to zero tomorrow, I’ve already won.
This is how you transform trades from stressful bets into risk-free holds.
Not by predicting the future… but by structuring the trade so the downside disappears.
That’s how you play this game for the long run.
What would you do?
👉 Hold 100% indefinitely?
👉 Bank 100% and walk away?
Drop your choice in the comments — I want to see how you think.
👉 Follow for more setups & insights into trading with precision, not prediction.

CHFJPY: Strong Bullish Pattern 🇨🇭🇯🇵
CHFJPY is currently updating the All-Time High, breaking
a neckline of a cup & handle pattern.
Looks like an uptrend is going to continue.
Next resistance - 186.85
❤️Please, support my work with like, thank you!❤️
I am part of Trade Nation's Influencer program and receive a monthly fee for using their TradingView charts in my analysis.

PEPE ANALYSIS🔮#PEPE Analysis 💰💰
#PEPE is trading in a symmetrical triangle in a daily time frame and if it breakouts with high volume then we can see a bullish momentum in #PEPE. Before that we will see little bit bearish movement towards its support zone and than a bullish movement.
🔖 Current Price: $0.00001091
⏳ Target Price: $0.00001413
⁉️ What to do?
- We can trade according to the chart and make some profits in #PEPE. Keep your eyes on the chart, observe trading volume and stay accustom to market moves.💲💲
#PEPE #Cryptocurrency #Pump #DYOR

DRIFT — No More Drifting, Breakout ImminentDRIFT has been trading sideways in a 226-day range, capped by resistance at $0.75. The POC of this entire range sits at $0.6, and price is currently trading above it at $0.62.
Volume spikes within the range show solid participation, and the structure is starting to resemble a Head & Shoulders formation with a neckline at $0.75 that needs to break.
Bullish Confluence (Support Zone)
Trading above:
21 Daily EMA ($0.593) / SMA ($0.592)
21 Weekly EMA ($0.577) / SMA ($0.549)
200 Daily EMA ($0.5828) / SMA ($0.5483)
Monthly Open → $0.5888
0.618 Fib retracement of current move → $0.5987 (long trigger)
Clear invalidation: below weekly 21 SMA ($0.549) / daily 200 SMA ($0.5483)
Resistance Confluence (Target Zone $1.3–$1.38)
nPOC of the end 2024 / early 2025 trading range → $1.3
0.786 Fib retracement → $1.2935
0.382 Fib retracement of entire downtrend → $1.3056
0.618 Fib retracement of smaller wave → $1.3677
Yearly Open → $1.3664
500M Market Cap → $1.38
📌 This creates a resistance cluster between $1.3–$1.38, an ideal take-profit zone and potential short opportunity.
🟢 Long Setup Idea
Entry: $0.62–$0.60 (ladder in near confluence with Fib + support levels)
Stop: Below $0.55 (weekly 21 SMA/ daily 200 SMA invalidation)
Targets:
TP1: $1
TP2: $1.3
Potential Gain: +115%
Quick Take
If $0.75 breaks, DRIFT could move quickly toward $1.3–$1.38, a zone stacked with resistance and confluences, the perfect place to secure profits/look for a short setup.
Key Levels
Support: $0.62–$0.60 (Fib + POC + EMAs)
Resistance: $0.75 neckline, then $1.3–$1.38 (confluence cluster)
🔍 Indicators used
LuxAlgo — Liquidity Sentiment Profile (Auto-Anchored)
DriftLine — Pivot Open Zones → For identifying key yearly/monthly/weekly/daily opens that act as major S/R reference points
Multi Timeframe 8x MA Support Resistance Zones → to identify support and resistance zones such as the weekly 21 EMA/SMA.
Fair Value Trend Model → Calculates a regression-based fair value curve
➡️ Available for free. You can find it on my profile under “Scripts” and apply it directly to your charts for extra confluence when planning your trades.
_________________________________
💬 If you found this helpful, drop a like and comment!

Short AUDJPY – Momentum Reversal Play📉 **Forex Trading Idea: Short AUDJPY – Momentum Reversal Play**
The AUDJPY pair presents a compelling short opportunity, driven by a confluence of macro momentum and technical precision. Fundamentally, the Australian Dollar (AUD) is under pressure amid weakening commodity demand and dovish central bank tones, while the Japanese Yen (JPY) is gaining strength as risk sentiment shifts and safe-haven flows intensify. This divergence sets the stage for a strategic short position.
Technically, AUDJPY has approached a key resistance zone between **97.81 and 98.12**, where price action has historically stalled. This area aligns with a potential exhaustion of bullish momentum, making it an ideal entry for a reversal trade. Traders should monitor for bearish candlestick patterns or momentum divergence within this zone to confirm entry.
The trade targets are well-defined: **TP1 at 97.38** captures the initial retracement, while **TP2 at 96.95** aims for a deeper correction aligned with previous support levels. A **stop loss at 98.40** provides a disciplined exit above the resistance zone, maintaining a favorable risk-reward ratio.
This setup suits both day traders and swing traders, depending on execution and holding strategy. The trade thesis hinges on AUD weakness and JPY strength, supported by technical resistance and momentum indicators. As always, traders should remain vigilant for macroeconomic news or central bank commentary that could impact currency flows.
In summary, this AUDJPY short is a tactical play on momentum reversal, offering a clean setup with defined levels and a strong narrative. Patience and precision will be key to capitalizing on this opportunity.
