United Postal Service | UPS | Long at $92.00The United Postal Service NYSE:UPS finally closed out the last remaining price gap on the daily chart (since 2020) and entered my "crash" simple moving average zone. With a P/E of 15x, earnings forecast growth of 8.12% per year, and a dividend over 6%, NYSE:UPS "may" be a good buy and hold through these tumultuous economic/trade war times. I wouldn't place a continued price drop near $75-$85 out of the question, but I'm not in the game of calling bottoms.
At $92.00, NYSE:UPS is in a personal buy zone. Word of caution: if this stock really tanks due to trade issues and massive recession, $50s...
Targets:
$108.00
$120.00
$133.00
Tariffs

Review and plan for 9th January 2026 Nifty future and banknifty future analysis and intraday plan.
Stocks analysed.
This video is for information/education purpose only. you are 100% responsible for any actions you take by reading/viewing this post.
please consult your financial advisor before taking any action.
----Vinaykumar hiremath, CMT

DXY SINGLING DANGER! UPTADE! Bad things happen when the dollar gets too strong....
Well, "the bad thing" now seems to be the dollar itself crashing lower.
What a difference 2 months can make!
Waging economic war against our allies, pulling military defense from allies, isolationism has not been working as expected. In fact, Trump has overplayed his cards, and his tactics are backfiring.
CAUTION is in order!!
Target not reached! Forced on me.
As mentioned back on January 18, 2025, when the dollar gets this strong, bad things happen.
As you can now all see, bad things did happen. Markets are crashing, and we are headed for an economic depression!
WARNING!

$INTC - Best in the sector against Trump tariffsIntel is a semiconductor technology giant, renowned for its x86 processors that dominate the CPU segment, top revenue in Q2 2025 came from PC chips (Client Computing Group, ~$7.9B) and server/AI chips (Data Center & AI, ~$3.9B) . Other revenue includes foundry services ($4.4B) and legacy businesses ($1.1B).
But, for the last 4 years the company has experienced one disaster after another:
- Loss of Market Share & Intensified Competition vs AMDs Ryzen and NVIDIA AI GPUs has been major drivers for last 4 years of decline.
- Gross margin dropped to around 38–39% in 2024—a steep fall from pre‑pandemic levels above 60%, while NVIDIA maintained margins above 75%.
- Intel perpetually lagged in transitioning to advanced nodes (7 nm, 5 nm), resulting in costly delays and reduced competitiveness .
- Credit rating downgrade: In August 2025, Fitch downgraded Intel’s credit rating from BBB+ to BBB (negative outlook) due to weak demand and deteriorating profitability . S&P had already downgraded Intel to BB+, and Moody's also cut its rating in 2024 .
Recent events and price action show its time for a buy at these prices.
- Spin-off of Network & Edge (NEX) group: Intel announced the spin-off of its Network and Edge Group (NEX) into an independent entity focused on critical communications and networks, seeking external investors while retaining a major stake .
- Workforce reduction and factory cancellations: Intel confirmed layoffs of ~24,000 employees (~15% of workforce) and cancellation of chip plant projects in Germany and Poland . New CEO Lip-Bu Tan plans to cut the headcount to ~75,000 by year-end 2025 .
- Executive departures and internal reorganization: Three corporate VPs (Kaizad Mistry, Ryan Russell, Gary Patton) announced retirement from manufacturing operations amid deep restructuring . Intel also cut its manufacturing capacity planning and engineering teams as part of an efficiency-driven reorganization .
- Recent key products/services: Intel launched new Xeon 6 CPUs for AI workloads (e.g. Xeon 6776P) and is preparing Panther Lake CPUs (PCs) for 2025 . It also began 18A node production in Arizona and sold part of its Mobileye stake (~$922M) to boost liquidity .
Price/sales: Intel (0.80), AMD (10.3), NVIDIA (29.6), QCOM (3.68)
Wrap-Up
Intel's last four years have been marked by a series of structural, competitive, and strategic challenges—ranging from manufacturing delays to margin erosion and intense pressure from rivals like AMD and NVIDIA. Yet, the tide may be turning. With decisive actions like major cost-cutting initiatives, new AI-focused products, and progress in advanced node production, Intel is signaling a strategic pivot. Trading at a deep discount relative to peers based on the price-to-sales ratio, the stock reflects much of the past negativity. For investors seeking a long-term turnaround play in the semiconductor sector, now could be the moment to re-evaluate Intel’s potential.
Let’s see if this chip giant can turn the corner. Cheers!
Pablin

DXY Has 99 Problems, Getting Above 100 Is One!Here we have TVC:DXY on the Weekly Chart.
Now clearly outlined we can see there is a very valuable level here @ 99-100 that the USD:
- Used as Resistance from 2015 til the Bullish Breakout in April 2020
- Used as Support from 2023 til the Bearish Breakdown in April 2025
Fundamentally is a very sketchy scenario because with the Shutdown causing lack of important data needed, The Federal Reserve is making Interest Rate cuts. This weakens the Dollar because it makes it less favorable to Foreign Investing.
On the flip side, Consumers Dollars are able to stretch further allowing them to purchase more but unfortunately we still combat the inflated prices on goods. Companies have the ability to get there raw ingredients cheaper, resume hiring processes, etc.
The slow creeping rise in Inflation has the Federal Reserve in a position to want to be ready to potentially Hike Rates when the Inflation, they believe, from the Tariffs will hit but as of yet, the recent CPI numbers came out not as hot as they thought, possibly playing into the reason for making the latest cut.
Nevertheless, by the last FOMC meeting, it would seem that there is a chance that was the last cut this year that may be made, if:
- Inflation continues to rise
or
- Continued softening labor market

US vs China: should we be worried?Another ''Buy the rumor''? What EVERY trader should have in mind amid US-China Trade talks:
1. Beijing balks at enforcement or verification terms
China could reject U.S.‑demanded mechanisms for monitoring compliance, such as agricultural purchase tracking or fentanyl control checkpoints.
Past talks collapsed over the same issue, the U.S. insisting on verification, China citing sovereignty .
If Beijing signals “framework only, no enforcement,” Washington may treat it as stalling and re‑activate the 155 % tariff threat for Nov 1 .
2. Rare‑earth or tech export retaliation
China still holds leverage through critical‑mineral exports. If it re‑tightens rare‑earth or semiconductor‑material shipments, Washington could impose new export controls on Chinese tech, reigniting escalation.
That “supply‑chain weaponization” was what caused the early‑October market sell‑off and would likely repeat—hurting metals, EV, and chip stocks first.
3. Unexpected Trump pivot under political pressure
Analysts warn that Trump tends to shift abruptly when domestic optics change.
A new social‑media statement accusing Beijing of backsliding could nullify the deal narrative overnight .
Morgan Stanley’s Mike Wilson noted that any such reversal could trigger a 10–15 % equity correction due to “positioning unwind and tariff risk repricing” .
4. National‑security or Taiwan language slips
The framework explicitly avoids defense issues, but if Trump or Xi reference Taiwan or South China Sea policy during press remarks, it could politicize the summit and freeze trade clauses .
5. Market complacency and over‑positioning
Even with a signed “mini‑deal,” markets may have already priced it in.
JPMorgan research warns that a “buy‑the‑rumor, sell‑the‑news” reaction is likely if investors had pre‑emptively rotated into cyclicals .
Thin liquidity plus leveraged optimism could amplify any disappointment.
Bottom line:
Unless both leaders explicitly confirm a tariff suspension and avoid new geopolitical flashpoints, markets remain only one headline away from reversal. The biggest red flags to watch this week are (1) a stalled verification clause, (2) talk of renewed tech or rare‑earth restrictions, or (3) Trump implying that tariffs will still “go forward pending review.” Any of these could instantly shift sentiment from optimism to a fresh wave of selling.
#trade #correction #economy #finance #us #china #tariff #bitcoin #crypto #stocks #equities #trading

Bitcoin Daily Analysis – October 22, 2025🟠Bitcoin remains in a phase of uncertainty, with market sentiment heavily influenced by global macro events. Developments around interest rate decisions, U.S.–China tariff policies, and ongoing geopolitical tensions in the Middle East could all play a decisive role in shaping Bitcoin’s next move.
🕰️ In this phase, patience is the key to success — avoid rushing into large positions until we see clearer confirmation of trend direction and market risk appetite.
🎯 Until the broader trend becomes more defined, traders can take advantage of short-term long and short triggers on lower timeframes, while maintaining strict risk management and discipline.
Disclaimer:
This content is for informational purposes only and does not constitute financial or investment advice. © DIBAPRISM
Larry D.Kohn

Crude Oil Outlook: Pressure Mounts as 2025 Lows Come Into ViewCrude oil prices are tracing another plunge back to yearly lows amid mounting oversupply, weak demand, and tariff concerns. New 2025 lows may be reached in the short-term horizon, aligning with the lower boundaries of a 3-year down trending channel
From a weekly time frame perspective, crude oil is facing the lower border of a three-year descending channel extending from the 2022 highs. The $55 support currently holds as the 2025 low, but a clean break below it could extend losses toward the $49 zone, aligning with the channel’s bottom boundary — a potential area of support. If this level fails, a deeper selloff could extend toward the $37 region.
On the upside, should prices recover above the $58 mark, a bullish rebound may extend toward $60, $63, and $66, respectively. However, for a sustainable bullish outlook on crude, a breakout above both the three-year downtrend and the $70 resistance is required.
Looking closely at the daily RSI, it is nearing oversold levels last seen in April 2025, suggesting that downside momentum could be approaching exhaustion.
In line with the recent movements of U.S. indices, will we see another dip-and-rebound scenario on crude oil — not identical, but perhaps reminiscent of April 2025?
- Written by Razan Hilal, CMT

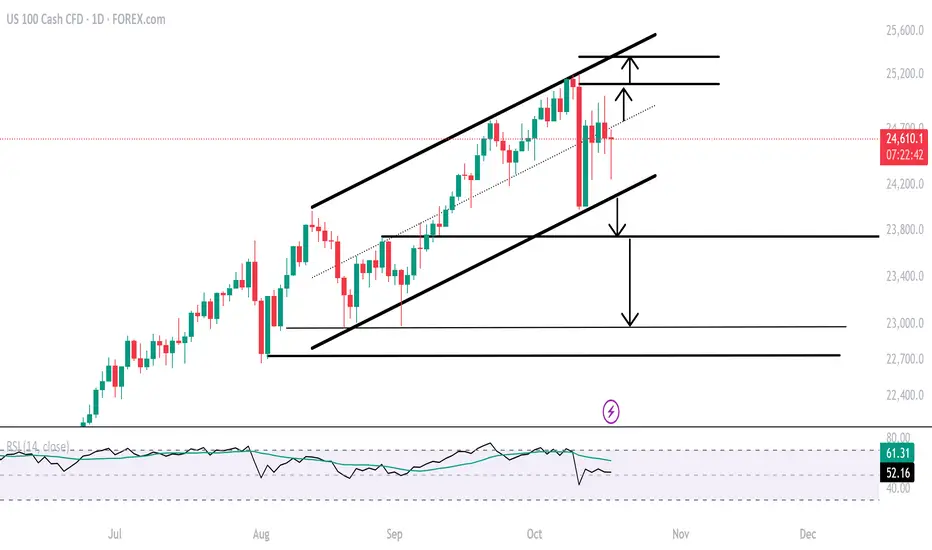
Nasdaq Outlook: Is the Correction Over?Despite the ongoing AI sector growth, the index remains under pressure alongside the broader risk-off sentiment. It is once again facing the 24,000 support and the August–October trendline. The daily RSI is leaning near the neutral 50 level, suggesting that a sustained break below 24,000 could extend the decline by another 1,000 points, testing key supports near 23,700, 23,100 and 22,700 — potentially offering another “buy-the-dip” opportunity.
On the upside, if the Nasdaq manages to hold above 24,000 and, more importantly, close above 24,800 — the mid-zone of the ascending channel respected since August 2025 — prices could advance toward the upper boundary, aligning with levels 25,000 and 25,300, marking new record highs.
- Written by Razan Hilal, CMT
BTC USA-CHINA Tariff War IndecisionTwo scenarios outlined for BTC as price moves lower due to China-US tariff war. Wait for close confirmation to proceed with long scenario. Shorts have already been triggered (Invalidation is close above resistance).
GGs

Post Flash-Crash BTC Despite such a large sell-off event, has the outlook on BTC actually changed? Structurally BTC remains very much rangebound with two clearly definable halves of the range. That is until Fridays move off the back of a Tariff Tweet from President Trump causing a liquidation event similar to that of April earlier this year and the Covid crash of 2020.
Bitcoin was less effected when compared to altcoins as is usually the case, some majors dropping as much as 80% in a single 1h candle! An entire bear market in an afternoon. Bitcoin on most exchanges fell roughly 20% on the news and eventually found support at range lows ($100,000), a significant amount of this drop got bought up and so BTC finds itself hovering around range midpoint.
To me this is a no trade zone initially, there is no clear directional bias that is actionable at this time but I am looking for clues as to where price may be going next:
- Should BTC stay above midpoint the next clear resistance level is 0.75 ($117,605). On the lower time frames the trend is bearish, 0.75 would be a good place for the bears to defend.
- A loss of the midpoint would open the door to backfilling the wick, this could get ugly as on the higher time frames a new lower low and price acceptance lower would signal a bearish shift in structure. Calls for "the top is in" will get much louder and so will the 4 year cycle theory comparisons.
- A V-shaped recovery and move straight to the highs would be max pain after such a brutal move down. Although IMO it's the least likely I would not rule it out.
ETH 15M Analysis - Key Triggers Ahead | Day 33☃️ Welcome to the cryptos winter , I hope you’ve started your day well.
⏰ We’re analyzing ETH on the 15-Minutes timeframe .
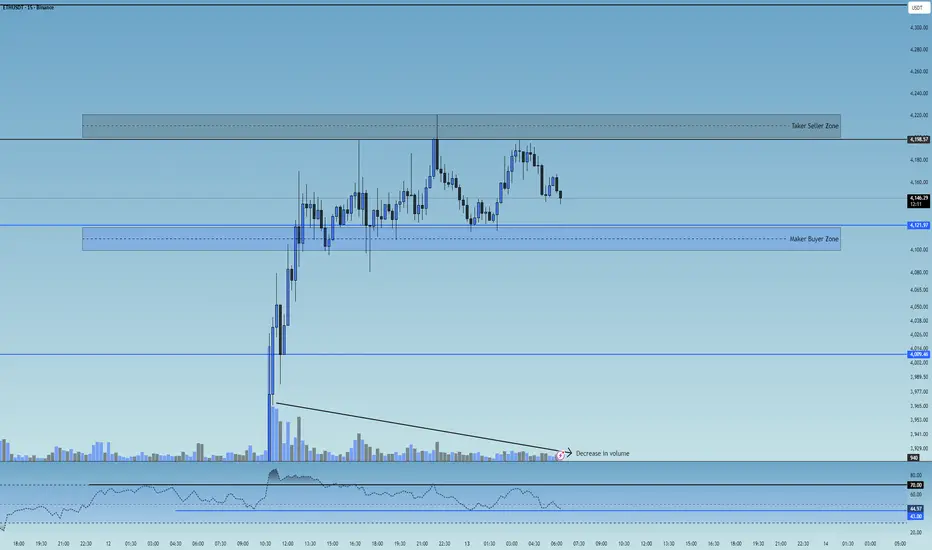
👀 On the 15-minute timeframe for Ethereum, we can see that after an impressive 10% rally, ETH showed one of the strongest recoveries in the market compared to other major coins — managing to climb above $4,100 and form a new trading range early in the week. Currently, Ethereum is consolidating within a range between $4,200 (top) and $4,121 (bottom). A breakout from this range could create either a long or short setup. Keep in mind that following this strong bullish move, trading volume has started to decline inside this range.
🧮 Looking at the RSI oscillator, we can see that after the recent surge, ETH’s momentum is now fluctuating between 43 and 70. A breakout above or below this RSI range would likely increase volatility and accelerate Ethereum’s next move — potentially with fewer candles but stronger momentum.
🕯 The size and volume of recent candles during Ethereum’s rally have been exceptional. Major buyers and institutional players have added substantial ETH positions to their portfolios. The large, high-volume bullish candles leading up to the current range reflect Ethereum’s strong momentum. Now, while the price is oscillating inside the range with reduced volume, a clear volume expansion is expected once the range breaks.
🧠 As Ethereum remains trapped inside this trading range, a breakout will require increased volume and RSI confirmation beyond the defined thresholds. This setup gives us two potential scenarios:
↗️ Long scenario: If Ethereum breaks above $4,200, which acts as a taker-seller resistance, and RSI pushes above 70 (Overbought zone), ETH could launch another bullish leg early in the week — showing an even stronger recovery compared to the rest of the market.
📉 Short scenario: If Ethereum breaks below $4,121, which is a maker-buyer support, and RSI drops under 43 toward the Oversold zone, it could continue its downward correction. However, given ETH’s strong bullish momentum, this bearish scenario would likely require negative market fundamentals to fully play out.
❤️ Disclaimer : This analysis is purely based on my personal opinion and I only trade if the stated triggers are activated .
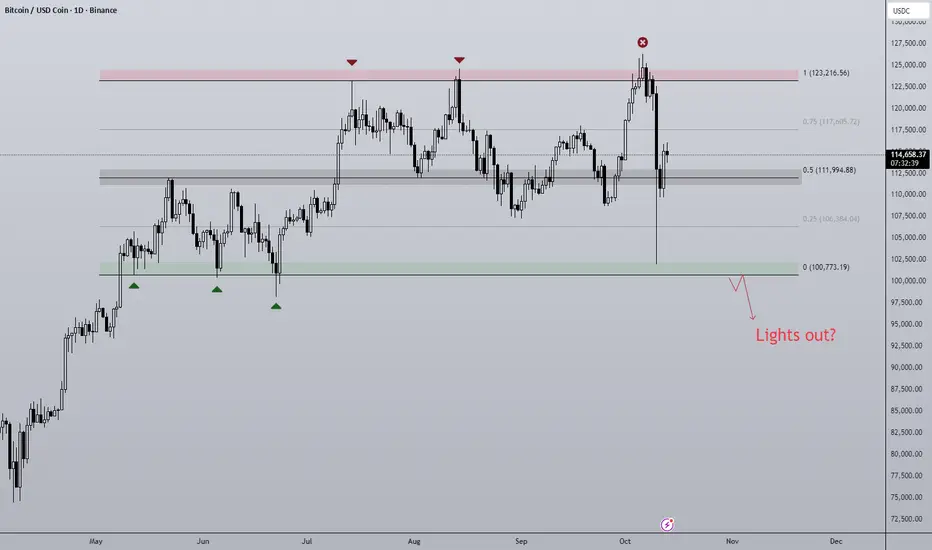
13/10/25 Weekly OutlookLast weeks high: $126,237.39
Last weeks low: $102,038.44
Midpoint: $114,137.92
Well that was an interesting week... A small reminder that when Trump talks about tariffs the markets move, and move fast!
From All-Time-High at the beginning of the week to a -19.2% move, a single hourly candle had -10.56% drawdown alone!
What can be learnt from this? Despite all the technical analysis in the world, if the President of the United States makes an announcement it can shift the market greatly causing a leverage unwind via liquidations that cascade aggressively. Although these large scale crashes are rare, they are inevitable in this market and this will not be the last of its kind.
This week will be very interesting because generally we do see a lot of backfilling the wick which would mean revisiting the key S/R level at 0.25 ($108,000). The bulls would not want to see price acceptance under this level or IMO this is the beginning of a bearish shift in HTF structure. This potential shift in structure would also line up with the 4 year cycle theory as October marks the end of the bull market.
On the other hand, the bounce from the low has been strong, although still some way off the origin of the dump a lot of ground has been recovered. In the past these liquidation events have marked local lows in the market and serve as a launchpad for the next leg up. I do think it's too early to tell if that is the case this time around, I am in no rush to position either way until at least Mondays range is established.
The altcoin market took a far worse turn, majors sinking as much as 80% in a single move! This week will be important to learn what projects are truly supported/fundamentally sound by how they recover.
Projects such as: ZEC, TAO, ANYONE and BNB have all closed higher than their original price before the crash, other projects may never recover.
Good luck this week everybody!

BTC 15M Analysis - Key Triggers Ahead | Day 55☃️ Welcome to the cryptos winter , I hope you’ve started your day well.
⏰ We’re analyzing BTC on the 15-Minutes timeframe .
👀 On the 15-minute timeframe for Bitcoin, we can see that after breaking out and consolidating above the $114,351 zone, BTC began moving upward and is now trading within a 15-minute range. A breakout from this range could trigger the next move. The top of this trading range sits at $115,715 and the bottom at $114,750 — breaking and holding beyond either level could start a strong leg for Bitcoin as the new week begins.
🧮 The RSI oscillator on the 15-minute timeframe shows Bitcoin currently moving within a range capped at 64 on the top and 42 on the bottom. A breakout from this RSI range could significantly increase buying or selling momentum, adding fuel to Bitcoin’s next move.
🕯 The size, volume, and count of green candles have increased since the flash crash, and institutions like BlackRock, World Liberty, and Trump-aligned funds have been averaging solid buy positions. With rising buying volume, Bitcoin could break through its ticker-seller resistance at $115,715 and continue its bullish move following the recent dramatic flash crash.
🔍 Despite concerns like the ongoing U.S.–China economic (tariff) war, the market remains in a risk-off mode on higher timeframes. If entering trades, we aim to manage capital across multiple entries — for example, allocating only 0.25% risk per position or averaging in gradually.
🧠 Two trading scenarios are considered for Bitcoin, both offering clear opportunities for structured entries.
↗️ Long scenario (breakout above the range):
If Bitcoin breaks above $115,715 with rising buy volume and RSI crossing above 64, it could initiate another strong bullish leg toward higher resistance levels.
📉 Short scenario (breakdown below the range):
If the micro-buyer support at $114,750 — a key demand zone — breaks, Bitcoin may extend its correction downward. This move should coincide with RSI losing the 42 level and increasing sell volume. Note: in short positions, take profits quickly and maintain tight risk-to-reward control.
❤️ Disclaimer : This analysis is purely based on my personal opinion and I only trade if the stated triggers are activated .

S&P 500 Faces Earnings Test Amid Shutdown Fog and Tariff FearsStocks Face Earnings Test as S&P 500 Heads for Worst Shutdown Performance Since 1990
The S&P 500 slipped on Friday, just two days after hitting a record high, as renewed tariff fears and the ongoing U.S. government shutdown weighed on sentiment.
This week marks a key test as major Wall Street banks open the third-quarter earnings season, potentially offering direction amid what analysts call a “vacuum of government data” due to the shutdown.
On Wednesday, the S&P 500 logged its 33rd record close of 2025, even as the shutdown that began October 1 dragged on. But Trump’s threat of a “massive increase” in tariffs on Chinese imports erased gains, leaving the index down 2% since the shutdown began — its worst such stretch since 1990, per Dow Jones Market Data.
The delay of key reports like CPI inflation data has added “fog” to the market, making it harder to gauge the impact of tariffs on core prices. Still, analysts expect solid Q3 results, especially from banks, with FactSet’s John Butters noting a rare increase in EPS estimates — the first since late 2021.
Volatility Returns — But Will Investors Buy the Dip?
October, historically the most volatile month, lived up to its reputation.
Friday’s drop left traders debating whether it was triggered by Trump’s post or simply profit-taking after record highs.
S&P 500 – Technical Outlook Merging with Fundamentals
The price dropped sharply by $165 within just six hours, reflecting strong volatility driven by both technical factors and fundamental uncertainty.
From now on, market movements are expected to remain highly sensitive, especially as third-quarter earnings season begins this week — a phase that could significantly influence the indices amid the ongoing U.S. government shutdown.
Technically, a short-term correction is expected toward 6550 – 6577 before renewed bearish pressure resumes.
However, if the price closes a 4H candle below 6484, it would confirm continuation of the bearish trend toward 6450 and 6425, with further downside potential toward 6347 and 6283.
On the other hand, as long as the price trades above 6506, buyers may attempt to correct the move upward toward 6550 – 6577.
A sustained break below 6484, however, would clearly reestablish the bearish momentum.
Pivot Line: 6506
Support Levels: 6450, 6425, 6348
Resistance Levels: 6550, 6570, 6620
Summary Expectation:
Next likely direction — bearish continuation, possibly after a minor corrective pullback toward 6,570 – 6,600, unless buyers reclaim control above 6,620.

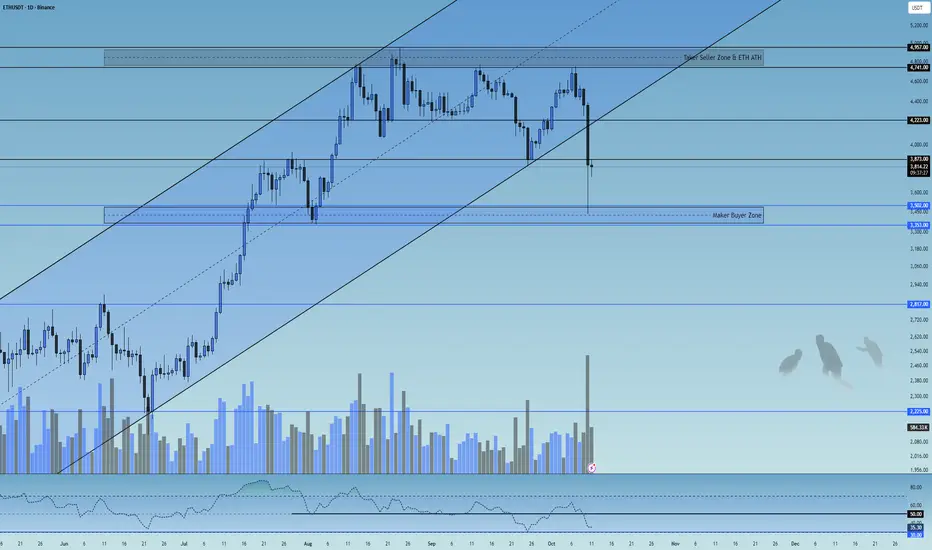
ETH 1D Analysis - Key Triggers Ahead | Day 32☃️ Welcome to the cryptos winter , I hope you’ve started your day well.
⏰ We’re analyzing ETH on the 1-Day timeframe .
👀 On the Ethereum daily timeframe, we can see that after the historic economic war between the U.S. and China, Ethereum broke its ascending channel with a high-volume whale candle and has now managed to stabilize below this channel. Currently, Ethereum is in a critical decision-making zone, with two key resistance levels at $3,873 and $4,223.
A break and confirmation above these zones, especially $4,223, could lead to a bullish continuation; otherwise, a breakdown below the channel support may trigger a deep correction and cause Ethereum to enter a risk-off phase on the higher timeframe (weekly).
🧮 Looking at the RSI oscillator, after crossing down from the 50 level, it is now heading toward the 30 and oversold region. These two zones — 50 and 30 — are our key RSI levels, and when volatility crosses these zones, it can be accompanied by a significant increase in trading volume.
🕯 The recent daily candle of Ethereum has shown a massive amount of sell volume, with an open around $4,400 and a close below $3,900 (ignoring the shadow). This indicates strong selling pressure — if buyers fail to hold Ethereum above $4,200, we could see further correction and selling pressure ahead.
🧠 Currently, there’s no specific trigger for Ethereum, but a trading range will likely form in this zone until the end of the week.
A break of either the top or bottom of this range across multiple timeframes could give us a potential long or short position.
❤️ Disclaimer : This analysis is purely based on my personal opinion and I only trade if the stated triggers are activated .
BTC 1D Analysis - Key Triggers Ahead | Day 54☃️ Welcome to the cryptos winter , I hope you’ve started your day well.
⏰ We’re analyzing BTC on the 1-Day timeframe .
👀 After the start of the trade war between the United States and China, news was released about a 100% tariff imposed by the United States on China. The crypto market experienced an unbelievable heavy drop (flash crash) last night, which from a technical point of view was completely unexpected and caused the biggest financial loss in the history of crypto.
👍 On the Bitcoin chart and in the daily timeframe, we can see that it is inside a very strong ascending channel, which even with last night’s drop has not closed below its channel body. Currently, Bitcoin is ranging with support at the bottom of the channel, and since it’s the weekend, the market volume has decreased sharply, and we are in a state of uncertainty until the new week’s open.
💡 Note that Bitcoin has not yet entered a trend reversal for the start of its heavy drop. The reversal zone that I specified in the analysis is between $108,960 and $107,521. With a break and confirmation below this zone, Bitcoin can experience a deeper correction and end its long-term primary trend and enter a secondary trend. We can also consider this zone as a distribution area.
Also note that Bitcoin’s return inside the channel has been supported by strong buyers, which has caused this uncertainty. In summary, Bitcoin has a very important resistance in the $114,351 zone, and with a break and confirmation above this area, it can move upward and turn the flash crash into a continuation move. In the continuation of the analysis, we will also use indicators and volume to reach the best conclusion.
🧮 In the RSI oscillator, we can see that after the selling pressure and increase in volatility, it moved downward and easily crossed the 50 zone. We have now defined two key RSI zones:
Zone 50 can be our long trigger area.
Zone 37, where if volatility passes below this level, Bitcoin can move toward the oversold area in its daily timeframe and experience a deeper correction.
🕯 First, let’s talk about volume — the selling pressure was so strong that it pushed the Bitcoin price near $102,000, and then it faced support from buyer makers (those who buy with market-type orders), which brought the price back above $110,000. The size of Bitcoin’s recent candle has been very strong and large, showing the great power of the sellers. With the increase in selling volume and continuation of the tariff war, the market can enter a risk-off state in higher timeframes, and investors may sell their Bitcoins, putting more selling pressure on BTC.
🧠 With the intensification of the tariff war between the U.S. and China, Bitcoin may start its secondary trend after weeks and months of bullish movement, but we still can’t make a definite decision about this issue. So we are waiting for the break of the defined zones in the analysis to make the best decision. Last night’s event was truly painful — a big experience and lesson for all of us that if we can manage our capital, we can have the best results relative to the market. However, last night will be remembered as the biggest financial loss in crypto history.
❤️ Disclaimer : This analysis is purely based on my personal opinion and I only trade if the stated triggers are activated .

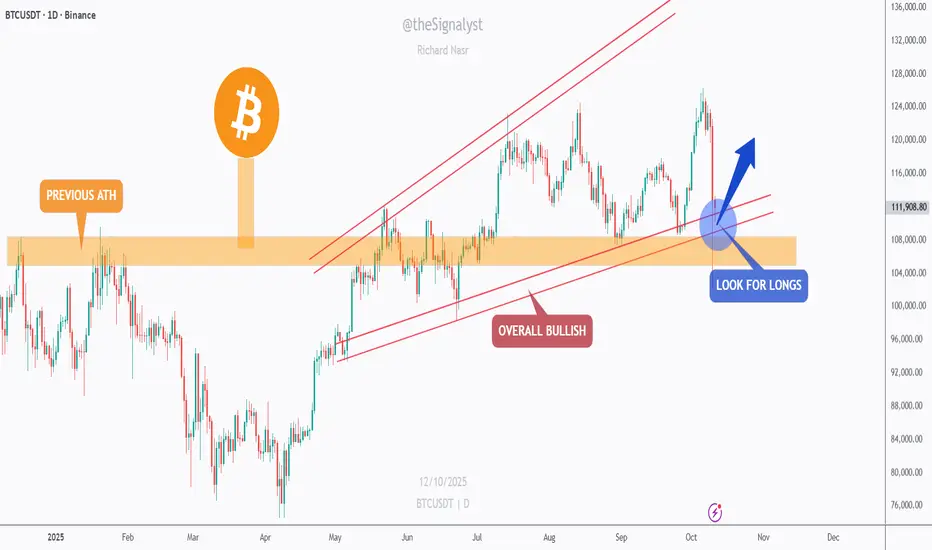
BTC – Bulls Still in Control, As Long As the Intersection Holds!CRYPTOCAP:BTC is retesting a major confluence zone, the intersection of the rising red trendline and the previous ATH structure around $110K–$112K.
This zone has acted as a strong pivot multiple times, and as long as it holds, the overall bullish trend remains intact.
Bullish scenario: Look for trend-following longs near the current intersection, targeting the upper red trendline around $125K.
Bearish invalidation: A daily close below $107K would break the confluence and signal a potential shift in momentum.
📈 The structure is still clean, a healthy correction within an ongoing bullish cycle.
⚠️ Disclaimer: This is not financial advice. Always do your own research and manage risk properly.
📚 Stick to your trading plan regarding entries, risk, and management.
Good luck! 🍀
All Strategies Are Good; If Managed Properly!
~Richard Nasr
EURUSD LONGI have maintained a buy position for quite a while, based on last week's performance, the bullish momentum is slowing down. Going forward the bulls will depend on a new catalyst. The fed officials have maintained a divergent rate cut rhetoric while at the same the US government is experiencing a shutdown. These has made traders to remain cautious. This week we have quite a number of events lined up, including FOMC and NFP. Any negative news towards the dollar while at the same time ECB's Christine Largade maintaining a stability will mean a retest for the pair towards the years high around 1.19200. Better news for the dollar will mean on lower time frames reversal and higher time frames deeper retracements.

Global Market Participants: Players Shaping the World Economy1. Understanding Global Market Participants
A market participant refers to any individual, institution, or entity that engages in buying, selling, or investing in financial instruments such as stocks, bonds, currencies, derivatives, or commodities. Their participation drives market activity, facilitates capital allocation, and ensures continuous price formation through demand and supply.
Global market participants can broadly be divided into institutional participants and non-institutional (retail) participants. Institutional participants dominate the market due to their large capital base and sophisticated strategies, while retail participants add diversity and depth.
2. Categories of Global Market Participants
a) Central Banks
Central banks are the most influential entities in the financial world. They control a nation's monetary policy, manage foreign exchange reserves, and stabilize the currency and financial system. Examples include the U.S. Federal Reserve, European Central Bank (ECB), Bank of Japan (BoJ), and Reserve Bank of India (RBI).
Key functions:
Setting benchmark interest rates.
Controlling money supply to influence inflation and growth.
Managing exchange rate stability.
Acting as a lender of last resort during crises.
Regulating the banking sector.
Central banks’ decisions can cause global ripple effects. For instance, a rate hike by the U.S. Fed can strengthen the U.S. dollar, attract global capital inflows, and pressure emerging market currencies.
b) Commercial Banks
Commercial banks are vital intermediaries between savers and borrowers. They accept deposits, provide loans, and participate actively in money markets, foreign exchange markets, and credit markets.
Their roles include:
Facilitating trade finance and foreign exchange transactions.
Managing corporate treasury operations.
Participating in interbank lending.
Investing in sovereign bonds and other assets.
Commercial banks also engage in proprietary trading and market-making, providing liquidity to the market.
c) Investment Banks
Investment banks specialize in capital market operations, helping companies raise funds through IPOs, bond issuances, or private placements. They also provide advisory services for mergers and acquisitions (M&A), portfolio management, and structured finance.
Major global players like Goldman Sachs, Morgan Stanley, and J.P. Morgan play crucial roles in shaping global capital flows.
Core functions:
Underwriting securities.
Advising on mergers and acquisitions.
Asset securitization.
Providing derivatives and risk management solutions.
Investment banks are considered the "architects" of global finance, linking capital seekers and investors across continents.
d) Institutional Investors
Institutional investors are large organizations that invest on behalf of clients or members. They include mutual funds, pension funds, insurance companies, and sovereign wealth funds.
Examples:
BlackRock and Vanguard (mutual funds)
CalPERS (pension fund)
Norwegian Sovereign Wealth Fund
Allianz and AIA Group (insurance firms)
Importance:
They manage trillions of dollars, often determining global market trends.
They are long-term investors, influencing corporate governance.
Their actions impact asset allocation, market liquidity, and volatility.
Institutional investors’ investment decisions are data-driven, often guided by macroeconomic conditions, risk models, and diversification strategies.
e) Hedge Funds
Hedge funds are privately managed investment vehicles that use sophisticated strategies to generate high returns. They often employ leverage, short selling, arbitrage, and derivatives trading to exploit market inefficiencies.
Examples: Bridgewater Associates, Renaissance Technologies, and Citadel.
Their significance:
Hedge funds enhance market efficiency by arbitraging mispriced assets.
They take contrarian or speculative positions.
Their rapid trading strategies can amplify market volatility, especially in times of stress.
Hedge funds are major players in currency, commodity, and derivatives markets, frequently setting trends that influence other investors.
f) Corporations and Multinational Companies
Large corporations are key participants, especially in foreign exchange and commodity markets. They engage in international trade, requiring them to manage currency exposure and input cost fluctuations.
For example:
A U.S.-based company exporting to Europe may hedge against a weakening euro.
An airline company may hedge fuel costs using futures contracts.
Corporations also issue bonds or equities to raise capital, becoming integral to capital market operations. Their strategic financial management contributes to overall market stability and liquidity.
g) Sovereign Wealth Funds (SWFs)
SWFs are state-owned investment funds that invest surplus revenues (often from oil exports or trade surpluses) into global assets like stocks, bonds, infrastructure, and real estate.
Examples:
Norway’s Government Pension Fund Global
Abu Dhabi Investment Authority
China Investment Corporation
Role in markets:
Provide long-term, stable capital inflows.
Invest counter-cyclically during market downturns.
Promote cross-border investments and global diversification.
SWFs are crucial in stabilizing markets, especially during economic downturns, as their investment horizon spans decades.
h) Retail Investors
Retail investors — individual participants — are the foundation of market democratization. They invest through stock exchanges, mutual funds, ETFs, and online trading platforms.
Characteristics:
Smaller investment size.
Motivated by wealth creation, savings, or speculation.
Increasingly active through mobile trading apps and social trading platforms.
Retail investors have gained immense power in recent years, driven by digitalization and financial literacy. Events like the GameStop short squeeze (2021) demonstrated how retail participation can disrupt institutional dominance.
i) Brokers and Market Makers
Brokers facilitate transactions between buyers and sellers, while market makers continuously quote buy (bid) and sell (ask) prices to provide liquidity.
Roles:
Ensuring price discovery and efficient order execution.
Offering leverage and margin trading to clients.
Acting as intermediaries for foreign exchange and derivatives trading.
With algorithmic trading, many market-making activities are now automated through high-frequency trading (HFT) systems.
j) Regulatory Bodies and Exchanges
Although not direct investors, regulators and exchanges are crucial participants ensuring market integrity, transparency, and stability.
Examples:
U.S. SEC (Securities and Exchange Commission)
FCA (UK)
SEBI (India)
Financial exchanges: NYSE, NASDAQ, LSE, NSE, and CME.
Regulators safeguard investor interests, while exchanges serve as platforms for price discovery, trading, and clearing.
3. The Interconnectedness of Global Market Participants
Modern financial markets are highly interconnected. A decision by one participant — such as the Federal Reserve’s rate change — can ripple through global markets, influencing bond yields, equity valuations, and currency rates worldwide.
For example:
Central banks influence the cost of capital.
Institutional investors allocate funds globally, affecting capital flows.
Corporations react by adjusting hedging or investment strategies.
Retail investors respond through short-term trading or portfolio rebalancing.
This web of interactions defines the global financial ecosystem, where every participant indirectly shapes the behavior of others.
4. Technological Evolution and Market Participation
Technology has dramatically reshaped how participants interact. The rise of algorithmic trading, blockchain, AI analytics, and fintech platforms has made markets more efficient but also more complex.
Key transformations:
Automation: AI-based trading systems execute millions of trades per second.
Accessibility: Retail investors can trade global markets via mobile apps.
Transparency: Blockchain enables auditable and secure transactions.
Data-driven decisions: Big data helps institutions forecast market trends.
These innovations have lowered entry barriers but also increased systemic risk due to automation and cyber vulnerabilities.
5. The Role of Market Participants During Crises
During crises like the 2008 Global Financial Crisis or COVID-19 pandemic, the coordination between participants becomes critical.
Central banks injected liquidity and cut rates.
Governments implemented fiscal stimulus.
Institutional investors rebalanced portfolios toward safer assets.
Retail investors used market dips as buying opportunities.
Such coordinated yet diverse actions reflect how the global market’s resilience depends on its participants’ adaptability.
6. Challenges and Risks for Market Participants
Despite advances, participants face persistent challenges:
Volatility and uncertainty: Driven by geopolitical events and rate changes.
Currency fluctuations: Affect cross-border investments and trade.
Regulatory tightening: Especially after financial crises.
Technological risks: Cyberattacks and algorithmic malfunctions.
Liquidity risks: Especially during sudden market stress.
Participants must balance risk and reward using advanced hedging, diversification, and compliance strategies.
7. The Future of Global Market Participation
The next decade will redefine global participation patterns through:
Sustainable investing (ESG): Institutions prioritizing environmental and social factors.
Decentralized finance (DeFi): Blockchain enabling peer-to-peer trading.
Cross-border digital assets: Cryptocurrencies becoming mainstream.
AI-driven trading ecosystems: Enhancing efficiency but raising ethical concerns.
The blend of traditional and digital participants will create a hybrid global market that is more inclusive, transparent, and data-centric.
8. Conclusion
Global market participants are the lifeblood of the international financial system. Each plays a distinctive yet interconnected role in maintaining liquidity, enabling capital formation, and ensuring efficient price discovery. From central banks that dictate monetary policy to individual traders executing positions on mobile apps, every participant contributes to the constant pulse of global finance.
As globalization deepens and technology evolves, the diversity and complexity of market participants will continue to expand. Understanding their functions, interrelations, and influences is not just essential for traders or economists — it’s vital for anyone seeking to grasp how modern finance truly operates.
In essence, the story of global markets is the story of its participants — dynamic, interdependent, and constantly evolving in pursuit of opportunity, stability, and growth.

Review and plan for 29th September 2025Nifty future and banknifty future analysis and intraday plan.
This video is for information/education purpose only. you are 100% responsible for any actions you take by reading/viewing this post.
please consult your financial advisor before taking any action.
----Vinaykumar hiremath, CMT

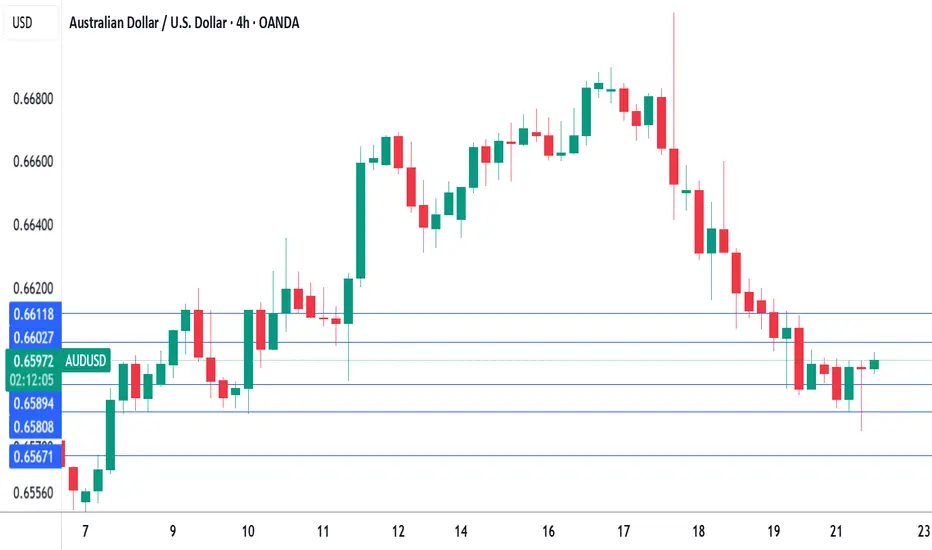
RBA's Bullock says inflation under control, Aussie steadyRBA Governor Bullock testified before a parliamentary committee on Monday. Bullock said that inflation was in a "very good position" as higher interest rates had curbed demand. Still, she warned that there inflation risks remained on "both sides".
Bullock was less positive about the geopolitical environment, warning that the significant change in the global trading system which had created massive uncertainty. The Reserve Bank was particularly concerned about the impact of US tariffs on China, Australia's largest trading partner.
Bullock warned that the financial markets had not priced in the risks of the tariffs, which could affect financial stability if the the domstic economy was significantly affected by the tariffs.
The RBA is expected to hold the cash rate at 3.6% at next week's meeting, after lowering rates by a quarter-point in August. The markets have priced in a 10% likelihood of a rate cut at the upcoming meeting, with an 86% likelihood of a cut in November.
There are no US economic releases today but investors will be keeping a close eye on Fedspeak, with five FOMC members scheduled to deliver public remarks. New Fed Governor Miran, who voted for a 50-bp cut at the September 17 meeting, is expected to give a detailed explanation of his view in today's speech.
At last week's meeting, the Fed signaled that more rate cuts were coming and the markets have priced in an October cut at 90%, according to CME's FedWatch. The Fed appears to have shifted to a more dovish stance after maintaining rates since December 2024 until lowering rates last week.
AUDUSD tested support at 0.6589 and 0.6580 earlier. Next, there is support at 0.6567
There is resistance at 0.6602 and 0.6611
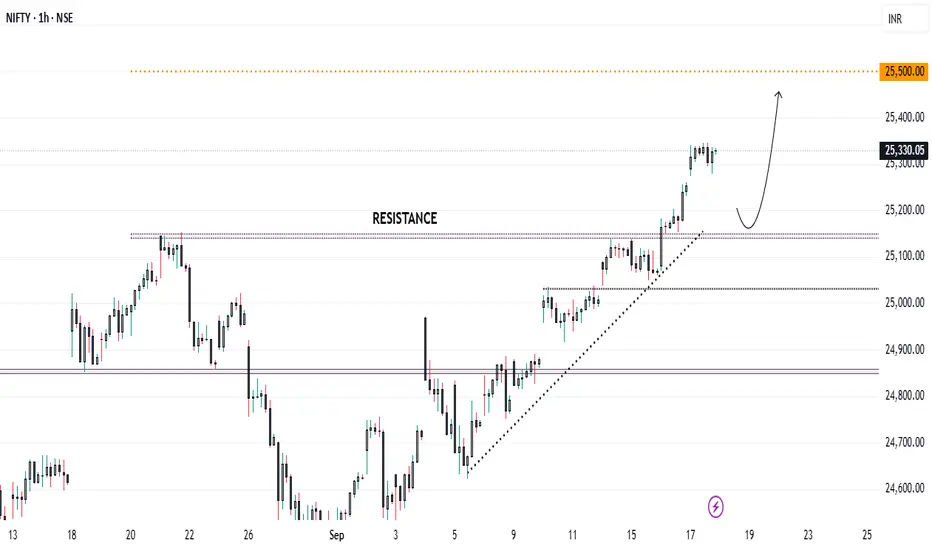
NIFTY Technical Outlook: Breakout Backed by Trade Talk Optimism.NIFTY has successfully broken the resistance level of 25,150 and is holding steady above it. A retest of this level could provide a good entry opportunity, with the next target at 25,550.
The market is maintaining a steady uptrend, largely supported by optimism around the resumption of trade talks between India and the USA. Hopes of a potential trade deal are fueling positive sentiment.
However, traders should remain cautious — any delay or setback in negotiations could quickly trigger downside pressure. If you plan to take a position, it’s wise to manage risk carefully, trade with smaller quantities, and keep positions light.