TradeCityPro | Bitcoin Daily Analysis #258👋 Welcome to TradeCityPro!
Let’s move on to the Bitcoin analysis, today the market is going through a correction.
⏳ 4-hour timeframe
On the 4-hour timeframe, after Bitcoin reached the 94478 resistance, it entered a corrective phase and its bullish momentum decreased significantly.
✔️ In the first corrective leg, price retraced to the 0.382 Fibonacci level, and since then it has retraced down to the 0.618 level.
💥 The 0.618 Fibonacci area overlaps with 90373, forming a strong PRZ. If Bitcoin’s next bullish wave is going to start, price can build a bottom here and begin its upward move.
✨ If the correction extends further, the next support is 89040. If this level is also lost, price can move down toward the main low at 86855, in which case the entire bullish move we had so far becomes a fakeout.
🔔 If price finds support right here at 90373, we can open a long position after the structural break that Bitcoin creates. The main confirmation for the start of the next bullish wave will be the break of 94478.
🎲 For a short position, I will wait until price stabilizes below 90373, and then I will look for a trigger.
❌ Disclaimer ❌
Trading futures is highly risky and dangerous. If you're not an expert, these triggers may not be suitable for you. You should first learn risk and capital management. You can also use the educational content from this channel.
Finally, these triggers reflect my personal opinions on price action, and the market may move completely against this analysis. So, do your own research before opening any position.
TCP

TradeCityPro | RAY Near Resistance, Watching for Breakout👋 Welcome to TradeCityPro!
In this analysis, I want to review the RAY coin for you — one of the DeFi projects in the Solana ecosystem, which has a market cap of $313 million and is ranked 130th on CoinMarketCap.
🗓 Daily TimeFrame
This coin has a downtrend on the 4-hour timeframe that continued down to the 0.883 area, and it is currently in a corrective phase.
💥 During this correction and price consolidation, a range box between 0.883 and 1.242 has formed, and price has been moving sideways between these two levels.
✔️ After price was supported at 0.883, buying volume increased, and the price gained a strong bullish momentum.
⭐ At the moment, RAY is interacting with the 1.242 resistance, and breaking this level will be the first trigger for a long position.
💡 I personally will open a long position after the break of 1.242. The next resistance area is 1.675.
✨ If price gets rejected from 1.242, it can move downward again, and in this case, breaking the triggers 0.996 or 0.883 will give us short positions.
🧮 Since this coin has been in a downtrend previously, breaking 0.996 and 0.883 can continue the downtrend, and strong bearish momentum will enter the market with the break of these levels.
⛏ But for the market to become bullish, for now we don’t have much bullish momentum, and we need more confirmations.
📝 Final Thoughts
Stay calm, trade wisely, and let's capture the market's best opportunities!
This analysis reflects our opinions and is not financial advice.
Share your thoughts in the comments, and don’t forget to share this analysis with your friends! ❤️

TradeCityPro | Bitcoin Daily Analysis #257👋 Welcome to TradeCityPro!
Let’s move on to Bitcoin analysis. The strong bullish trend of Bitcoin is still continuing.
⏳ 1-hour timeframe
Bitcoin is still continuing its bullish trend, and yesterday, after breaking 93,149, it continued its move up to 94,478.
🔔 At the moment, after a pullback to the 93,149 area, Bitcoin is once again moving toward 94,478.
📊 Buy volume has not increased significantly yet, and in my opinion, if the price is going to break 94,478, buy volume also needs to increase.
🧮 For now, we can consider the break of 94,478 as a trigger for opening a long position. In my opinion, as long as the price stays above 93,149, this trigger is a very good one for long positions.
⛏ However, if the price consolidates below 93,149, we will get confirmation of the end of the bullish wave, and in that case, Bitcoin can correct down to lower areas such as 91,585 and 91,118.
💥 For a trend change, after the price consolidates below 93,149, we can get confirmation of a bearish trend in Bitcoin by forming lower highs and lower lows based on Dow Theory.
❌ Disclaimer ❌
Trading futures is highly risky and dangerous. If you're not an expert, these triggers may not be suitable for you. You should first learn risk and capital management. You can also use the educational content from this channel.
Finally, these triggers reflect my personal opinions on price action, and the market may move completely against this analysis. So, do your own research before opening any position.

TradeCityPro | Bitcoin Daily Analysis #256👋 Welcome to TradeCity Pro!
Let’s move on to Bitcoin analysis. The market trend has started, and long triggers are being activated one after another.
⏳ 1-hour timeframe
Yesterday, Bitcoin made another bullish leg, and after breaking 89,040 and 90,373, it also activated the next trigger at 91,585.
✔️ At the moment, the zone Bitcoin has reacted to is 93,026, but the main resistance is located at 94,157.
📊 So far, we have had three entry points on Bitcoin, all of which are in profit, and from now on, any new entry on Bitcoin will be much riskier.
⚡️ For now, we can move our stop-losses up to the previous low at 91,118, and for taking profit, the next suitable zone would be 94,157.
↗️ For a new position, we can consider the break of 93,026 as a trigger, but the key point is that we have a major resistance at 94,157, which lies before Bitcoin reaches its target and can prevent this bullish wave from continuing, pushing the price into a correction.
🎲 For this reason, in my opinion, the 93,026 trigger is not very attractive and is quite risky, and personally, until 94,157 is broken, I won’t open any new positions on Bitcoin using another trigger.
🔽 As for short positions, the situation is completely clear: for now, we need to wait until a trend change occurs and a bearish structure is formed, and only then look for short triggers.
❌ Disclaimer ❌
Trading futures is highly risky and dangerous. If you're not an expert, these triggers may not be suitable for you. You should first learn risk and capital management. You can also use the educational content from this channel.
Finally, these triggers reflect my personal opinions on price action, and the market may move completely against this analysis. So, do your own research before opening any position.

TradeCityPro | Bitcoin Daily Analysis #255👋 Welcome to TradeCity Pro!
Let’s move on to Bitcoin analysis. The market has finally started a trend and can give us trading opportunities.
⏳ 1-hour timeframe
On Bitcoin, we had two entry points. The first was the break of 89,040, and the second was the break of 90,373.
⚖️ If you opened a position with either of these triggers, your position is now in profit and you can take profit.
💥 At the moment, Bitcoin is dealing with the 91,585 zone, and given the bullish momentum present in the market, the probability of breaking this level is high.
✨ In case 91,585 breaks, we can open a long position. This trigger will be riskier compared to the previous triggers we had.
💡 For now, Bitcoin’s trend on the LWC has turned bullish, and this trend can continue. However, if the move turns out to be a fake and price stabilizes below 90,373, we can take confirmation of a bearish shift in price.
📊 In that case, we can look for short triggers, but until then, I am not focusing on short positions for now.
❌ Disclaimer ❌
Trading futures is highly risky and dangerous. If you're not an expert, these triggers may not be suitable for you. You should first learn risk and capital management. You can also use the educational content from this channel.
Finally, these triggers reflect my personal opinions on price action, and the market may move completely against this analysis. So, do your own research before opening any position.

TradeCityPro | AAVE at Key Support, Waiting for Trend Trigger👋 Welcome to TradeCityPro!
In this analysis, I want to review the AAVE coin for you. One of the popular DeFi projects, which with a market cap of $2.52 billion, is ranked 36th on CoinMarketCap.
🗓 Daily timeframe
On the daily timeframe, AAVE started a downtrend after stabilizing below the 261.98 zone, and with the bearish structure it had, it dropped down to the 144.61 level.
🎲 There is a support zone between 144.61 and 157.43, which the coin has currently been supported from, and it could start its upward move from this area.
✨ The main resistance that price is currently dealing with is 202.53, and as long as price does not stabilize above it, a bullish trend will not begin.
🎯 So, for a long position or spot buying, the trigger we have on this coin is 202.53.
↗️ However, if the downtrend continues and a lower high below 202.53 is formed, we can open a short position with the break of 144.61.
⚡️ The next support that AAVE currently has is 124.79, and price could drop to this zone in the next bearish leg.
📝 Final Thoughts
Stay calm, trade wisely, and let's capture the market's best opportunities!
This analysis reflects our opinions and is not financial advice.
Share your thoughts in the comments, and don’t forget to share this analysis with your friends! ❤️

TradeCityPro | Bitcoin Daily Analysis #254👋 Welcome to TradeCity Pro!
Let’s move on to Bitcoin analysis. The market is finally starting its move.
⏳ 1-hour timeframe
After Bitcoin broke the 89,040 zone yesterday and managed to stabilize above it, it has now reached its main resistance.
✨ This main resistance is located at 90,373, and so far, on this timeframe, the price has touched it twice.
💡 After reaching 90,373, volume has decreased and the price is currently resting.
💥 However, if volume increases again, given the bullish momentum that has entered the market, the probability of breaking 90,373 increases.
✔️ So, with the break of 90,373, we can open a long position.The next resistance zone for Bitcoin will be 93,789.
🧩 But if Bitcoin gets rejected from 90,373, we can open positions using trend change and Dow Theory triggers.
⭐ The triggers we currently have as the main triggers for Bitcoin turning bearish are the 87,345 and 86,855 zones.
❌ Disclaimer ❌
Trading futures is highly risky and dangerous. If you're not an expert, these triggers may not be suitable for you. You should first learn risk and capital management. You can also use the educational content from this channel.
Finally, these triggers reflect my personal opinions on price action, and the market may move completely against this analysis. So, do your own research before opening any position.

TradeCityPro | Bitcoin Daily Analysis #253👋 Welcome to TradeCity Pro!
Happy New Year — let’s move on to the first Bitcoin analysis of 2026!
⏳ 4-hour timeframe
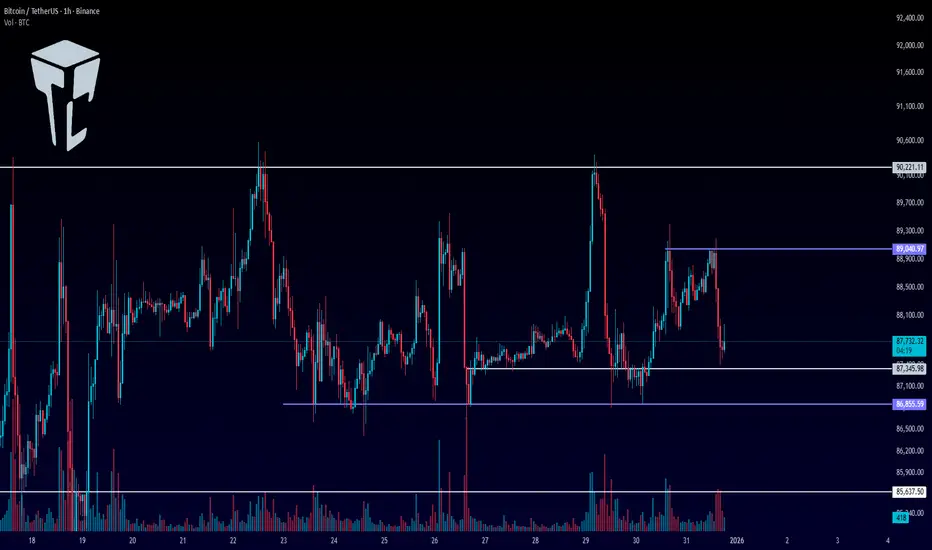
Since mid-December, Bitcoin has formed a small range box inside its larger range box.
✨ The top of this range is 90,221 and the bottom is 86,855, and since we are in the Christmas and New Year period with low volume, the price has not broken this box yet.
✔️ The main triggers for Bitcoin to start a trend are the break of 93,789 or 84,509, and if these zones break, the price can begin a long-term trend.
📊 However, we also have two other triggers, which are 86,855 and 90,221.
🔔 If 86,855 breaks, bearish momentum will enter the market, and Bitcoin can move toward 84,509 or even 82,214.
💥 For a bullish move, breaking 90,221 can bring bullish momentum into the market, and with its break, the price can move toward 93,789.
🎲 Overall, the market is still ranging and Bitcoin is not offering many clear positions, but it’s important to stay behind the chart, because if a move starts, we can catch a very good profit on future positions.
❌ Disclaimer ❌
Trading futures is highly risky and dangerous. If you're not an expert, these triggers may not be suitable for you. You should first learn risk and capital management. You can also use the educational content from this channel.
Finally, these triggers reflect my personal opinions on price action, and the market may move completely against this analysis. So, do your own research before opening any position.

TradeCityPro | ATOM Testing Support as Bears Dominate👋 Welcome to TradeCityPro’s first analysis of 2026!
In this analysis, I want to review the ATOM coin for you. One of the DeFi projects in the Osmosis ecosystem, which with a market cap of $937 million is ranked 63rd on CoinMarketCap.
⏳ 4-hour timeframe
On the 4-hour timeframe, this coin has a bearish trend and has now entered a correction and ranging phase, preparing to start its next move.
✨ The main support level we have on ATOM is 1.834. However, the price has also formed another support at 1.916, which it has previously touched several times and has now reached again.
✔️ After the previous bearish wave ended, the price corrected upward, and after reaching 2.103, bearish momentum entered the market again.
🧮 Currently, the price is sitting on the 1.916 support. Given the bearish momentum and the increasing selling volume, the probability of breaking 1.916 has increased.
⚡️ With the break of 1.916, we can open a short position.The main trigger for confirming ATOM turning bearish is the break of the 1.834 level.
⛏ However, if the price gets supported from this area and moves upward, breaking 2.103 will give us the first confirmation of ATOM turning bullish.
📈 Personally, I prefer to only open short positions on ATOM for now, since it has a strong bearish trend, and for long positions, we can use other coins that have bullish structures.
📝 Final Thoughts
Stay calm, trade wisely, and let's capture the market's best opportunities!
This analysis reflects our opinions and is not financial advice.
Share your thoughts in the comments, and don’t forget to share this analysis with your friends! ❤️

TradeCityPro | Bitcoin Daily Analysis #252👋 Welcome to TradeCity Pro!
Let’s move on to Bitcoin analysis. The market is still ranging — even on New Year’s Eve!
⏳ 1-hour timeframe
Bitcoin is still inside the range box it has been in over the past period and is fluctuating within this zone.
✔️ A high that formed for Bitcoin yesterday, which was tested twice, is the 89,040 area, and we can use it as a trigger today.
⚖️ If 89,040 breaks, we can open a very risky long position.The main trigger is still the break of 90,221.
✨ For shorts, our triggers have not changed compared to before.The breaks of 87,345 and 86,855 are both suitable triggers for short positions.
💥 The main short trigger on Bitcoin is 85,637.Given the low volume, I think until the Christmas holidays are over, the market won’t have any major moves. However, it’s very important to stay behind the chart so that we can open positions if the main triggers get
❌ Disclaimer ❌
Trading futures is highly risky and dangerous. If you're not an expert, these triggers may not be suitable for you. You should first learn risk and capital management. You can also use the educational content from this channel.
Finally, these triggers reflect my personal opinions on price action, and the market may move completely against this analysis. So, do your own research before opening any position.
TradeCityPro | TON Range Tightens, Breakout Probability Rising👋 Welcome to TradeCity Pro!
In this analysis, I want to review the TON coin for you. One of the popular crypto projects that belongs to the Telegram platform, and with a market cap of $4 billion, it is ranked 26th on CoinMarketCap.
⏳ 4-hour timeframe
This coin has formed a range box on the 4-hour timeframe, and like most altcoins, it is currently ranging.
⚡️ The bottom of the range box is at 1.45 and the top of the box is at 1.68, and for several days now, volume inside this box has been increasing.
📊 This increase in volume indicates the presence of traders in this coin, and if volume continues to increase, the probability of a range breakout will rise.
✔️ Currently, most of the volume is buy volume, and the probability of breaking the 1.681 resistance has increased.
⭐ The higher low that the price has formed is at 1.562, and as long as the price stays above this level, we can expect that if 1.681 breaks, an upward bullish move will start.
🎲 However, if the price gets rejected from 1.681 and moves downward, breaking 1.562, then with the break of 1.45, we can open a short position.
📝 Final Thoughts
Stay calm, trade wisely, and let's capture the market's best opportunities!
This analysis reflects our opinions and is not financial advice.
Share your thoughts in the comments, and don’t forget to share this analysis with your friends! ❤️

TradeCityPro | Bitcoin Daily Analysis #251👋 Welcome to TradeCity Pro!
Let’s move on to Bitcoin analysis. Bitcoin is still ranging, and the longer this ranging continues, the higher the probability of a move starting.
⏳ 1-hour timeframe
Yesterday, Bitcoin was supported from the support zone that had formed between 86,855 and 87,355, and currently, with increasing volume, it is moving upward.
✔️ Yesterday, with the break of 87,345, we could open a risky short position on Bitcoin, but the price was supported from 86,855 and started an upward move.
✨ Currently, the price is still inside the same range box between 86,855 and 90,221, with the difference that volume has increased with the start of the new week.
🔔 Bitcoin’s triggers have not changed yet, and we can still open a short position with the break of 86,855 and a long position with the break of 90,221.
🧩 For now, whatever trigger the market gives, I open short-term positions with it and take profits quickly.
🎯 If, along with the break of triggers, volume also increases, the probability of the move continuing increases, and we can open long-term positions as well by breaking the next triggers.
❌ Disclaimer ❌
Trading futures is highly risky and dangerous. If you're not an expert, these triggers may not be suitable for you. You should first learn risk and capital management. You can also use the educational content from this channel.
Finally, these triggers reflect my personal opinions on price action, and the market may move completely against this analysis. So, do your own research before opening any position.

TradeCityPro | BNB Testing Breakout After Trendline Break👋 Welcome to TradeCity Pro!
In this analysis, I want to review BNB, one of the most popular crypto coins, which belongs to the Binance exchange and with a market cap of $117 billion is ranked 4th on CoinMarketCap.
⏳ 4-hour timeframe
On the 4-hour timeframe, this coin has formed a range box between the zones 810.64 and 913.25.
✔️ A descending trendline was formed after the price was rejected from 913.25, and now after the price has touched it several times, this trendline has been broken.
⭐ The trigger for breaking this trendline is the 869.51 level, and the price has reacted to it once so far.
💡 If 869.51 breaks, an upward move will begin and the price can start moving toward the 913.25 zone.
💥 Breaking the 913.25 level will give us confirmation of BNB turning bullish. So, with the break of this zone, the price can start its bullish trend, and it is better to definitely have a long position after it breaks.
✨ On the other hand, if the price gets rejected from 869.51, we can open a short position by breaking the 828.45 and 810.64 zones.
🧩 Breaking 810.64 will be the main confirmation for the start of a bearish trend.
📝 Final Thoughts
Stay calm, trade wisely, and let's capture the market's best opportunities!
This analysis reflects our opinions and is not financial advice.
Share your thoughts in the comments, and don’t forget to share this analysis with your friends! ❤️

TradeCityPro | Bitcoin Daily Analysis #250👋 Welcome to TradeCity Pro!
Let’s move on to Bitcoin analysis. Today is the first day of the week, and with the start of the new week, Bitcoin has shown some volatility today.
⏳ 1-hour timeframe
Yesterday, we had two temporary resistance zones on Bitcoin that the price did not react to at all, and with a sharp move it went toward 90,221, and then after getting rejected from this zone, it again dropped sharply down to 87,345.
📊 The volume of both moves was high, but the number of strong red candles was much higher, so it can be said that the selling power is stronger.
✔️ On the other hand, the market momentum is currently bearish, and if the 87,345 or 86,855 zones break, the price can move downward.
⚡️ So, the break of 87,345 can be used as a risky short trigger, and the break of 86,855 as a more reliable short trigger.The main trigger for Bitcoin turning bearish is still 85,637.
💡 But if Bitcoin gets supported from this area between 87,345 and 86,855, the price can move back toward 90,221, and if this zone breaks, it can start a bullish move.
⚖️ So, with the break of 90,221, we can open a long position.Breaking this zone will be the first confirmation of Bitcoin turning bullish.
❌ Disclaimer ❌
Trading futures is highly risky and dangerous. If you're not an expert, these triggers may not be suitable for you. You should first learn risk and capital management. You can also use the educational content from this channel.
Finally, these triggers reflect my personal opinions on price action, and the market may move completely against this analysis. So, do your own research before opening any position.

TradeCityPro | Bitcoin Daily Analysis #249👋 Welcome to TradeCity Pro!
Let’s move on to Bitcoin analysis. Today is the last day of the week, and the market is still ranging.
⏳ 1-hour timeframe
Bitcoin is still ranging, and yesterday it formed a new low.
✔️ The previous low on Bitcoin was at the 86,855 zone, which the price was supported from, and now it has formed a higher low at 87,345.
💡 The resistance zones above the price are 88,376 and 89,199.
⚡️ These zones do not have strong supply and demand significance, and if the market trend is going to start, in my opinion they won’t be able to stop the price movement.
🎯 The main zones right now are 85,637 and 90,221.As long as the price is between these two zones, any position we open is risky and profits should be taken quickly.
✨ We will get confirmation of the start of the next Bitcoin move with stabilization below 85,637 or above 90,221.Breaking these two zones are triggers that I try to open positions with.
⚖️ Until then, we can open short-term, very low-risk positions.with breaks of 87,345 and 86,655 for shorts, and with breaks of 88,376 and 89,199 for longs.
❌ Disclaimer ❌
Trading futures is highly risky and dangerous. If you're not an expert, these triggers may not be suitable for you. You should first learn risk and capital management. You can also use the educational content from this channel.
Finally, these triggers reflect my personal opinions on price action, and the market may move completely against this analysis. So, do your own research before opening any position.

TradeCityPro | LINK Compressing in Triangle, Breakout Ahead👋 Welcome to TradeCity Pro!
In this analysis, I want to review LINK, one of the RWA projects, which with a market cap of $8.78 billion is ranked 12th on CoinMarketCap.
⏳ 4-hour timeframe
On the 4-hour timeframe, LINK has a support zone near the $12 area, and together with a descending trendline, it has formed a descending triangle.
🎯 The trigger for breaking this triangle to the downside is the break of the $12 support zone, and 12.16 will be the first short trigger.
⚡️ However, if the triangle breaks to the upside, we can open a long position using the 12.80 trigger. In this case, the price can move toward 14.65.
📊 The volume on this coin has been decreasing for about a week and is gradually getting lower. If the breakout of either trigger is accompanied by increasing volume, the new trend can continue.
💥 Overall, since the price is currently between 12.16 and 14.65, the market does not have strong momentum, and for this reason, we can open both long and short positions.
📝 Final Thoughts
Stay calm, trade wisely, and let's capture the market's best opportunities!
This analysis reflects our opinions and is not financial advice.
Share your thoughts in the comments, and don’t forget to share this analysis with your friends! ❤️

TradeCityPro | Bitcoin Daily Analysis #248👋 Welcome to TradeCity Pro!
Let’s move on to Bitcoin analysis. After a few days without posting an analysis, let’s take a look at Bitcoin and see what the market has been doing during this time.
⏳ 4-hour timeframe
On the 4-hour timeframe, Bitcoin hasn’t shown any major difference compared to our previous analysis and is still inside the same large range box between 84,500 and 93,789.
✔️ Since Bitcoin has been inside this box for a long time, additional support and resistance levels have also formed within the range.
💡 Currently, the price has formed a smaller range between 86,555 and 90,018, and it is fluctuating between these two zones with very low volume.
⭐ Since Bitcoin’s previous low was recorded at 84,500, if the price gets supported at 86,555 and forms a higher low compared to 84,500, the probability of breaking 90,018 will increase significantly.
🎯 If 90,018 breaks, bullish momentum can enter the market, and if this momentum comes along with increased volume, Bitcoin can also break the next resistance zones such as 93,789 and 96,476.
⚡️ With the break of 93,789, we can get confirmation of Bitcoin turning bullish. But before that, any long position that gets opened, I personally take profits quickly, because there is no strong momentum in the market.
🔔 For short positions, the triggers we currently have are 86,855 and 84,500.Price stabilization below 84,500 will confirm Bitcoin turning bearish.
❌ Disclaimer ❌
Trading futures is highly risky and dangerous. If you're not an expert, these triggers may not be suitable for you. You should first learn risk and capital management. You can also use the educational content from this channel.
Finally, these triggers reflect my personal opinions on price action, and the market may move completely against this analysis. So, do your own research before opening any position.

TradeCityPro | Bitcoin Daily Analysis #247👋 Welcome to TradeCity Pro!
Let’s move on to Bitcoin analysis; the market hasn’t changed much since yesterday and is still ranging.
⏳ 1-Hour Timeframe
Bitcoin is still in the range box between 89,849 and 90,590, and just like yesterday, it is fluctuating between these two zones today.
✔️ Today, the probability of movement during the New York session is high because Bitcoin is in a very small compression, and breaking this compression from either side can give us a position.
📊 Volume has decreased even further since yesterday, and this is another sign that a move is close. So, if volume enters and triggers are activated, a sharp move in Bitcoin could begin.
⭐ Today, we can open a short position after breaking the 89,849 zone.
🎲 The main short trigger is still 88,890, and breaking 89,849 will be the precursor to that.
↗️ For a long position, breaking 90,590 is a good trigger.We will get the main confirmation of Bitcoin turning bullish after a stabilization above 92,942 and 94,167.
💧 Today, any movement Bitcoin makes in either direction, if accompanied by increased volume, could continue.
✨ But if we see volume divergence, the likelihood of a fakeout increases.
❌ Disclaimer ❌
Trading futures is highly risky and dangerous. If you're not an expert, these triggers may not be suitable for you. You should first learn risk and capital management. You can also use the educational content from this channel.
Finally, these triggers reflect my personal opinions on price action, and the market may move completely against this analysis. So, do your own research before opening any position.

TradeCityPro | FET Testing Key Range, Bears in Control for Now👋 Welcome to TradeCity Pro!
In this analysis, I want to review FET, one of the AI projects, which with a market cap of $558 million is ranked 80th on CoinMarketCap.
⏳ 4-hour timeframe
On the 4-hour timeframe, this coin is ranging between the zones 0.2321 and 0.2652.
💥 The overall trend for FET is currently bearish, but the price is now ranging between these two zones and forming a new structure.
⚡️ After the last time the price reached 0.2652, it got rejected, and volume started decreasing, and it is still decreasing.
✔️ The bottom of the range can also be considered as a support zone. Breaking this zone would be a very good trigger for a short position, and the price could move towards 0.2021 after breaking this level.
🎲 The middle line of the range is at 0.2472, and breaking this level will give us a early long trigger.
✨ The next level we can open the main long position after breaking is 0.2652.
📝 Final Thoughts
Stay calm, trade wisely, and let's capture the market's best opportunities!
This analysis reflects our opinions and is not financial advice.
Share your thoughts in the comments, and don’t forget to share this analysis with your friends! ❤️

TradeCityPro | CRVUSDT Altcoin Ready to Move!👋 Welcome to TradeCityPro!
Let’s move on to today’s whale-favored coin, CRV, which is widely used by Ethereum whales for governance voting and participation in key decision-making processes.
🌐 Bitcoin Overview
Before we begin, let me remind you once again that at your request, we’ve moved the Bitcoin analysis section to a dedicated daily report — allowing us to analyze Bitcoin’s trend, dominance, and overall market sentiment in greater depth each day.
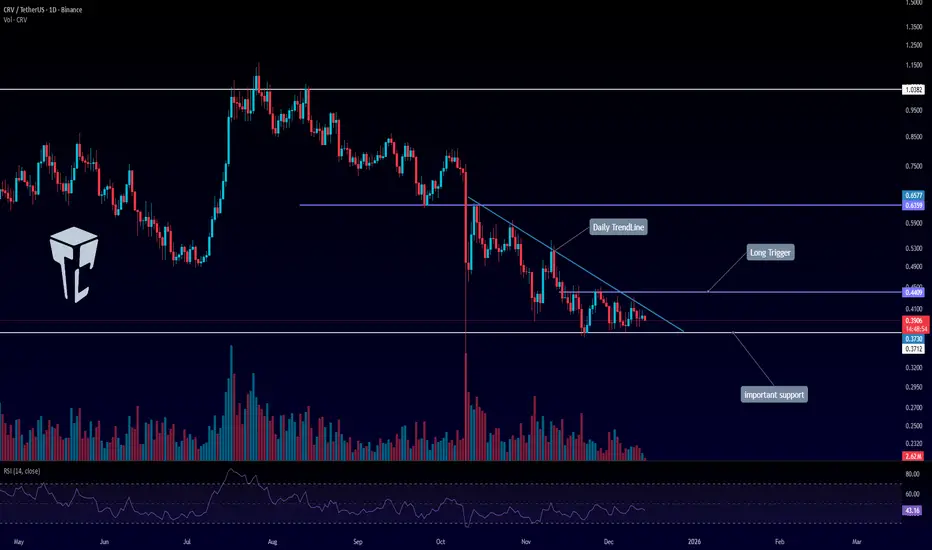
On the daily timeframe, after getting rejected from $1.03, we saw a corrective move and price settled calmly on the $0.6359 support.
After breaking this support, price moved down toward the $0.3712 support, and we are currently forming lower highs, which has resulted in the formation of a reversal-type trendline.
For long positions, if the daily trendline is broken and the $0.4409 trigger is activated, we can look to open a long position on the breakout of this level.
For short positions, our entry triggers are clearly defined on the chart.
With a break below $0.3730, we can open a short position, and a rejection from the trendline can also provide an early short trigger.
📝 Final Thoughts
Stay calm, trade wisely, and let's capture the market's best opportunities!
This analysis reflects our opinions and is not financial advice.
Share your thoughts in the comments, and don’t forget to share this analysis with your friends! ❤️
TradeCityPro | Bitcoin Daily Analysis #246👋 Welcome to TradeCity Pro!
Let’s move on to Bitcoin analysis. The market has been ranging for a few days, but it still gives positions, and if we stay behind the chart, we can make profits from the market.
⏳ 1-hour timeframe
On the 1-hour timeframe, Bitcoin has formed a range box between the 88890 and 94167 zones, and for several days it has been moving between these two areas.
✔️ Currently, near the bottom of the box, the price has created a smaller range between 89849 and 90590, and since today is Saturday and volume is low, it is ranging between these two zones.
💥 If the price exits this box, the next move can continue toward either the top or the bottom of the main box.
🔔 That means with a break of 89849, the move can continue down toward 88890.
🎲 But if 90590 breaks, I will wait for a higher low and higher high to form above this zone, and then I will enter a long position.
⛏ The next resistance zones for Bitcoin are 92942 and 94167.
🧩 We get confirmation of Bitcoin turning bullish with a break of 94167. In that case, an upward move in higher cycles can begin.
⭐ On the other hand, if the price stabilizes below 88890, it can move again toward the 84000 support.
❌ Disclaimer ❌
Trading futures is highly risky and dangerous. If you're not an expert, these triggers may not be suitable for you. You should first learn risk and capital management. You can also use the educational content from this channel.
Finally, these triggers reflect my personal opinions on price action, and the market may move completely against this analysis. So, do your own research before opening any position.

TradeCityPro | XLM Trapped in Range, Awaiting Breakout Trigger👋 Welcome to TradeCity Pro!
In this analysis, I want to review XLM, one of the DeFi and RWA coins, which with a market cap of $7.72 billion is ranked 15th on CoinMarketCap.
⏳ 4-hour timeframe
On the 4-hour timeframe, this coin has formed a large range box, and for several weeks it has been moving inside this range.
✔️ The bottom of this box is at 0.22826, and the top of the box is at 0.25960, and currently the price is moving in the middle of this box.
📊 A smaller range box has also formed inside the main box, which is between the zones 0.23593 and 0.2467.
⛏ If either 0.23593 or 0.2467 breaks, we can open a short-term position with low risk. However, the main triggers are the break of the main box’s support and resistance.
⭐ So for a short position, the main trigger is 0.22826, and the early trigger is 0.23593.
⚖️ For a long position, breaking 0.2596 is the main trigger, and breaking 0.2467 is the early trigger.
📝 Final Thoughts
Stay calm, trade wisely, and let's capture the market's best opportunities!
This analysis reflects our opinions and is not financial advice.
Share your thoughts in the comments, and don’t forget to share this analysis with your friends! ❤️
