$ETSY LONGS @ $40Price is approaching "covid" levels. Mitigating orders from the sell-off could create some heavy momentum to the upside. EASY and conservative +50%, could see price back at $200 in a few years.ELongby IAmTheDisciplinedTraderUpdated 3
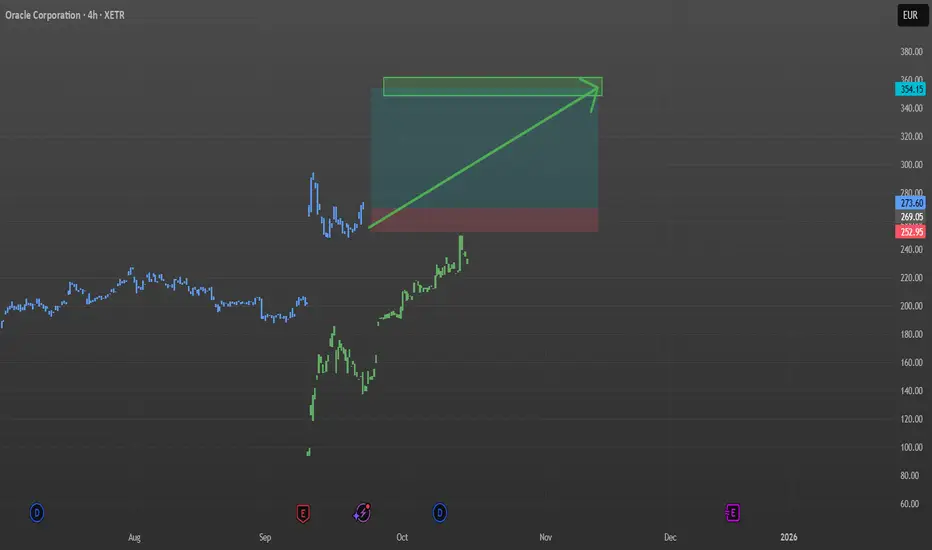
ORCL / ORACLE / Bullish scenario / fractal / SeasonalityHere is my view on ORCL: Until mid of November we should see a bullish seasonal move to the upside. My target is on the chart. SL at your discretion but i highly doubt that there will be a deeper pullback before next year... This is not a trade call, this is no financial advice. I am just a dude trading Oracle and good luck to all! Cheers! Feel free to leave a comment and discuss this analysis. I am happy to learn, exchange thoughts and chat.Longby Amazing-FractalsUpdated 5
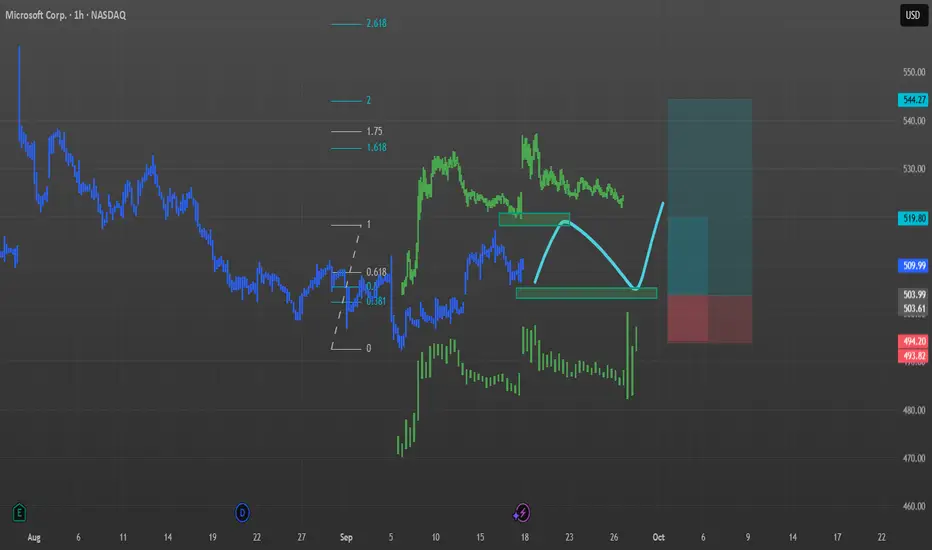
MSFT / MICROSOFT / Fractal and Seasonality inspiredHere is my view on MSFT from seasonal and fractal point of view. Price gonna break the recent 516 high, shall turn and break recent 505 low than head upside for end of the year ralley. i put 2 Longs into the chart. Smaller for first partial take profit and the larger one for rest. All this should play out until 15th of November or latest until End of January. After January 2026 downside. Be careful! (This is not a trade call, just educational analysis, trade at your own risk) Feel free to comment so we can learn and improve together! Cheers!Longby Amazing-FractalsUpdated 1818120
ARKK: when a breakout isn’t just a breakout-it’s a runway to $91On the weekly chart, ARKK has broken out of a long-standing ascending channel, ending a year-long consolidation phase. The breakout above $71.40, with a confident close and rising volume, signals a transition from accumulation to expansion. The move came right after a golden cross (MA50 crossing MA200), further confirming institutional interest. Price has already cleared the 0.5 and 0.618 Fibonacci retracements — and the 1.618 extension points to $91.40 as the next technical target. Momentum indicators like MACD and stochastic remain bullish with room to run. Volume profile shows low supply above $75, which could fuel an acceleration toward the target zone. Fundamentally, ARKK remains a high-beta, high-risk vehicle — but one with focus. The ETF is positioned around next-gen tech: AI, robotics, biotech, and automation. Assets under management now exceed $9.3B with +$1.1B net inflow in 2025. YTD return stands at 37%, and its top holdings (TSLA, NVDA, COIN) are back in favor. This isn’t just a bet on innovation — it’s diversified exposure to a full-blown tech rally. Tactical setup: — Entry: market $69.50 or on retest — Target: $80.21 (1.272), $91.40 (1.618 Fibo) Sometimes a breakout is just technical. But when there’s volume, a golden cross, and billions backing it — it’s a signal to buckle up.Longby TotoshkaTradesUpdated 6
Gold Ready To Drop in 15 Minutes TFGold Ready To Drop in 15 Minutes TF after yesteray's positive GDP outcome. US has gone to fetch the dollar mark Shortby Akhilrajfx1
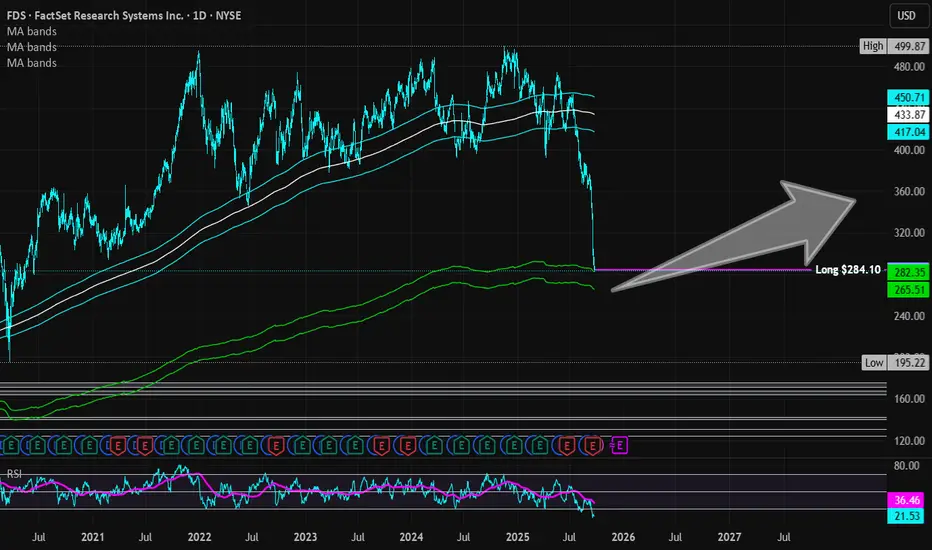
FactSet Research Systems | FDS | Long at $284.10FactSet Research Systems NYSE:FDS is a leading provider of financial data, analytics, and software solutions primarily serving the investment and finance industry. As of 2025, it supports over 218,000 users across more than 8,200 client institutions worldwide, including buy-side and sell-side firms, investment managers, hedge funds, banks, wealth managers, asset owners, private equity firms, and corporate users. Its clients span industries such as financial services (19% of users), higher education (11%), and investment management (7%), with a strong focus on large organizations (38% of clients have revenue >$1B). Technical Analysis: The price is currently touching the top of my "crash" historical simple moving average bands (green lines). This area is often reserved for share accumulation and can signal a bottom. The price, however, may extend to the bottom of "crash" bands which is currently near $265.00. These bands don't always signal a bottom - there is a still a "major crash" zone - but the company's niche clientele and earnings/revenue growth into 2029 may signal a buy opportunity. Earnings and Revenue Growth EPS growth between 2025 ($16.98) and 2029 ($22.30): 31.3% Revenue growth between 2025 ($2.32 billion) and 2029 ($2.86 billion): 23.3% www.tradingview.com Health Debt-to-Equity: 0.63x (good) Altman's Z-Score/Bankruptcy Risk: 6.6 (great, very low risk) Insiders Warnings: selling outweighs buying, but an insider two days ago purchased $100k near $296. openinsider.com Action Due to the expected earnings and revenue growth into 2029, great overall financial health, niche market served, and technical analysis signals, NYSE:FDS is in a personal "buy zone" at $284.10. Additional opportunities for entry may exist near $265 and a bit lower in the near-term. However, if estimates are correct and continued growth is in the future of NYSE:FDS , the long-term outlook may be quite positive for investors. Time will tell. Targets in 2028 $320 (+12.6%) $350 (+23.2%) Longby WorthlessViews4410
Micron Tech. to $285MU is targeting $285, with it's new support zone from $167. Like every other tech stock it's important to note there's a big pullback coming likely the end of this year/beginning 2026. However I'm quite confident MU will reach it's target before that happens. Good luck!Longby bwy1
$GOOGL .... LETS GET LOUD!!!Within the last month, we have watched NASDAQ:GOOGL get absolutely crushed, most of which has to do with a generally weak earnings report in early February. However, skepticism of this price action and investor sentiment is the only thing that should be on anyone's mind right now. One thing we know for a fact is that Google isn't going anywhere especially considering all the data they collect on their users. So why not apply this reasoning into buying the dip? To answer that, we should Look First/Then Leap ... Here is the 4 Hour chart refencing back into September of 2024. Let's start with the circle. The reason I have the area marked is because of the key factors in play that indicate we may possibly be bottoming out on this timeframe. Firstly, there are two lines to keep an eye on, a diagonal trendline and a horizontal price-level line. NASDAQ:GOOGL 's price action seems to obey these two levels (for whatever reason), which are coincidentally in the same area at the same time. Secondly, NASDAQ:GOOGL has just shown a rebound from the 400 EMA which also falls within this area giving a sort of "stars aligning" situation here. But the price action doesn't have to be the only thing we examine to analyze $GOOGL. This is the MACD indicator on the 4 Hour timeframe referencing back to September of 2024. This MACD chart shows the comparison between the last regional low for the MACD compared to the recent regional lows. Between these lows there is an interval of 76 to 78 calendar days (just over 2 and a half months) if I am not mistaken, which should strike some traders as very odd considering their similarity in distance. Amazingly, that's not even the weirdest part... This is the combination of both charts. How about that? Not only are the lengths between regional MACD lows similar, but NASDAQ:GOOGL 's returns between these periods are only roughly 2/3% in difference to each other. This just shows that there is more that what meets the eye when it comes to charting. Always look where others don't because that's where some keys are found. In conclusion, I will be taking a long position on NASDAQ:GOOGL for the reasons stated above. When stars align like this, we are given no option but to act upon our rationality instead of our emotions...Longby addatheriver0808Updated 3311
AIRE - reAlpha Tech Corp - $1.51 PT / RetestNASDAQ:AIRE took flight this morning, jumping from $0.55 to $1.51 in the Pre-Market after announcing an upgrade to its Internal AI Loan Officer Assistant yesterday. We're looking for consolidation to the 3 targets identified with a Continuation Breakout to retest $1.51.Longby MyMIWallet112
TSMC: AI Chip Titan – Still the King or Facing New Challengers?Good morning, everyone! ☀️ TSMC: AI Chip Titan – Still the King or Facing New Challengers? (1/9) TSMC’s riding the AI wave with record Q4 2024 profits, but with U.S.-China curbs and fab delays, is this semiconductor king untouchable or at a crossroads? Let’s unpack it! 🔍 (2/9) – PRICE PERFORMANCE 📊 • Q4 2024: Net income up 57% to $11.4B, revenue climbed 39% 💰 • Full Year 2024: Revenue hit $87.1B, up 34% from 2023 📏 • Sector Trend: AI chip demand soaring, per Reuters 🌟 It’s a powerhouse, driven by tech’s hunger! ⚙️ (3/9) – MARKET POSITION 📈 • Market Share: Over 60% of global foundry market 🏆 • Clients: Apple, Nvidia, AMD—big names rely on ‘em ⏰ • Trend: Expanding fabs in U.S., Japan, Germany 🎯 Firm, holding the throne but not without battles! 🚀 (4/9) – KEY DEVELOPMENTS 🔑 • Q4 Earnings: Record $11.4B profit, per Jan 16 Reuters 🔄 • Expansion: Arizona fab faces delays, full ops by 2027? 🌍 • Market Reaction: Shares up 81% in 2024, still strong 📋 Adapting, with global eyes on its moves! 💡 (5/9) – RISKS IN FOCUS ⚡ • Geopolitics: U.S.-China export curbs hit demand 🔍 • Costs: U.S. fab chips 50% pricier than Taiwan 📉 • Talent: Lack of skilled U.S. workers slows growth ❄️ Tough, but risks loom large! 🛑 (6/9) – SWOT: STRENGTHS 💪 • Profit Surge: 57% net income jump in Q4 2024 🥇 • Tech Lead: 5nm mass production, 3nm in R&D 📊 • Client Base: Powers Apple, Nvidia, more 🔧 Got silicon in the tank! 🏦 (7/9) – SWOT: WEAKNESSES & OPPORTUNITIES ⚖️ • Weaknesses: High U.S. fab costs, talent gaps 📉 • Opportunities: AI chip demand, new fabs in Japan, EU 📈 Can it keep the lead amid global shifts? 🤔 (8/9) – 📢TSMC’s Q4 profit up 57%, AI booming, your take? 🗳️ • Bullish: Still the king, long-term winner 🐂 • Neutral: Steady, but risks weigh ⚖️ • Bearish: Curbs and costs slow growth 🐻 Chime in below! 👇 (9/9) – FINAL TAKEAWAY 🎯 TSMC’s record profits signal AI dominance 📈, but U.S.-China curbs and fab delays add caution 🌿. Volatility’s our friend—dips are DCA gold 💰. Grab ‘em low, climb like pros! Gem or bust? Longby DCAChampionUpdated 8
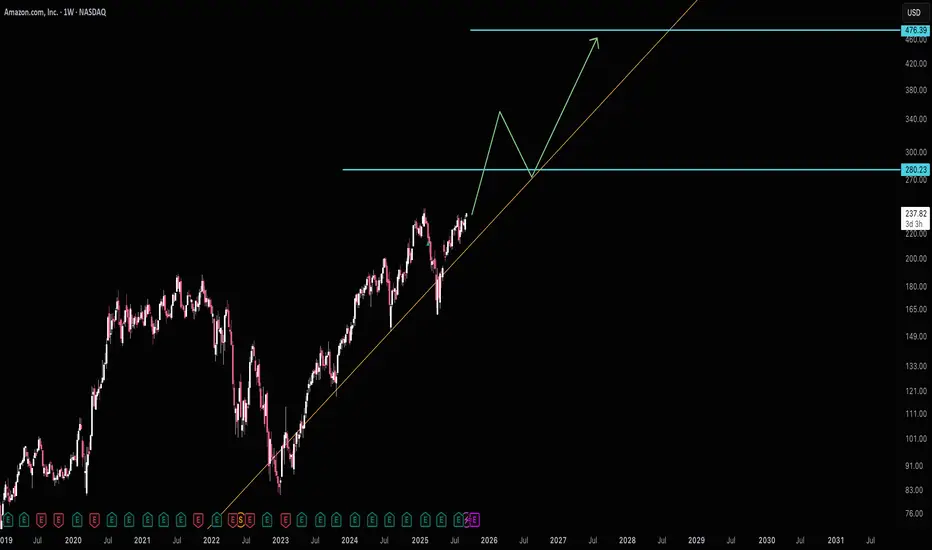
Amazon making it's way to next support $280Amazon seems to be overlooked at the moment, but it should start making bigger moves as it approaches $280 resistance (next support). I see a lot of things that lead me to believe next year will have a big pullback in tech. Until then AMZN looks to have really good risk reward as it's still so close to it's long term trend line with revenue growth steadily increasing. Good luck!Longby bwy334
Atlassian Corp | TEAM | Long at $180.12Atlassian Corp NASDAQ:TEAM Technical Analysis: Currently trading withing my historical simple moving average zone (i.e. reversion to the mean). This area is typically reserved for share accumulation. Many gaps above to close (as high as $420.80. I anticipate the price to stairstep up over the next few years as the company moves to AI. Earnings and Revenue Growth 3x EPS growth by 2028 and revenue growth from ~$5 billion to ~$9 billion. www.tradingview.com Health Debt-to-Equity: 0.73x (good) Altman's Z-Score/Bankruptcy Risk: 6.8 (excellent/very low risk) Insiders Warning: Tremendous amount of selling. openinsider.com Action Due to the high-growth potential of NASDAQ:TEAM and solid health, I am personally going long at $180.12. Only major warning is the amount of insider selling. Targets in 2028 $223.00 (+23.8%) $380.00 (+111.0%) Longby WorthlessViews227
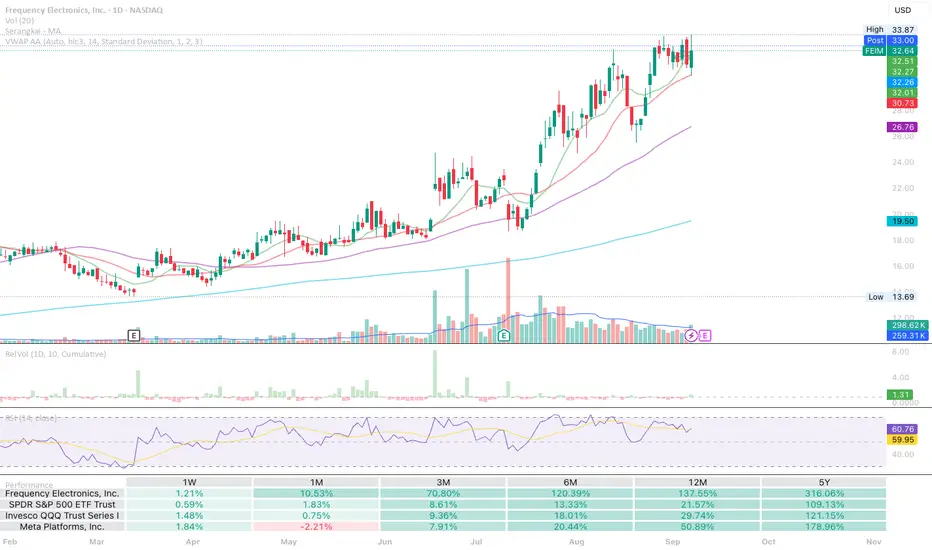
The timing is right for FEIM - high tight flag before earningsFEIM manufactures technology for timing things. They're an old company that's found newfound relevance with big budgets going to rockets and satellites and military tech that requires absolute precision timing. THe fundamentals are great and the chart shows a high tight flag pattern getting ready for earnings. FEIM releases earnings on Thursday, 9/11. I'm planning on prepping to buy if they release positive earnings because it could jump to the next stage of its flag.by anableps0
For Those Trading PalantirPLTR has greatly accelerated it's growth trend lines. Right now PLTR is almost 3 years ahead of it's main long term trend line. What this means is upside potential is diminishing. I see a lot of long charts for PLTR and wanted to share that support is actually at $134. So if you're a PLTR trader, looking to buy, that's the best area to do it. If however you're looking to sell, then $230 is your spot. I feel like people buying PLTR are playing a bit with fire as the fast gains are likely gone and eventually a return to the long term trend line is likely. I don't see that happening at least until IXCO runs into resistance, so until then $134 is the buy area. Good luck!by bwy225
TSLA Creeping up from original triangle, but still in a larger tNASDAQ:TSLA continues to take the stairs of worry up to my trading signal target from the original triangle analysis, $386, but the pattern has morphed into what appears to be a barrier triangle now as price struggles at $360 with a series of higher lows. RSI is comfortable at the EQ with room to grow while price remains above the daily pivot. Analysis is invalidated below wave (C) $284 Safe tradingby Maddox_Metrics3
IREN Bear Divergence on the Daily, Deeper Pullback Ahead?NASDAQ:IREN appears to be pulling back locally in wave 4, filling the gap, with eyes on testing the daily pivot as support before continuing higher. Price is significantly away from mean and catching continued momentum but this will fade as more people take profit. Bearish divergence persists in the daily RSI and has been confirmed with the close below the signal line. If these signals fail it shows the strength of the momentum trend. Continued upside target is playing the pivots to $40 and initial downside taregt is the previous all time high at $18.50 Safe tradingby Maddox_Metrics2
Google clear for take off? Elliot Wave adjusted!NASDAQ:GOOG Google shot up on the open into price discovery invalidating the pullback scenario and suggesting we are in a strong wave 3. Don't step in front of this moving train! gaps don't have to be filled if they are runaway gaps! Daily RSI is significantly overbought and price is far above the mean so a short term reversal is still expected though not guaranteed! We expect a test of the all time High Volume Node as support at least, $207 Safe tradingby Maddox_Metrics0
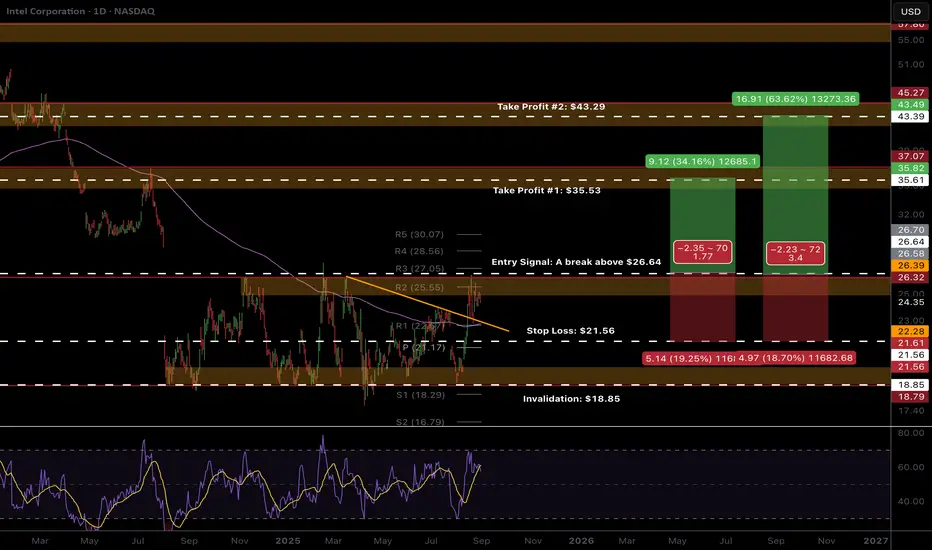
INTC Ready For Breakout?Intel INTC appears to be putting in a major bottom on the weekly time frame. Stock has been beaten down for some time! On the daily time frame, price appears to be ready to breakout of the range above the High Volume Node after multiple tests of the upper boundary resistance. Theres been a gap to fill for some time up to $28. The pivot targets are subdued due to the amount of time INTC has spent ranging, so not super useful for targets in this case. Price is above the daily 200EMA which has flicked positive. Here is an example from my trade signals Substack. Stop below the 200EMA, pivot, High Volume Node and descending support line - you don't want to see price losing these as it adds confidence to the downside. This asset is volatile so the stop is wide for now - I will be looking out to adjust this to a tighter stop and thus a larger position size once I see how price action unfolds. I believe we have a good opportunity ahead to make several trades on this asset as we play it level by level. Safe tradingby Maddox_Metrics6
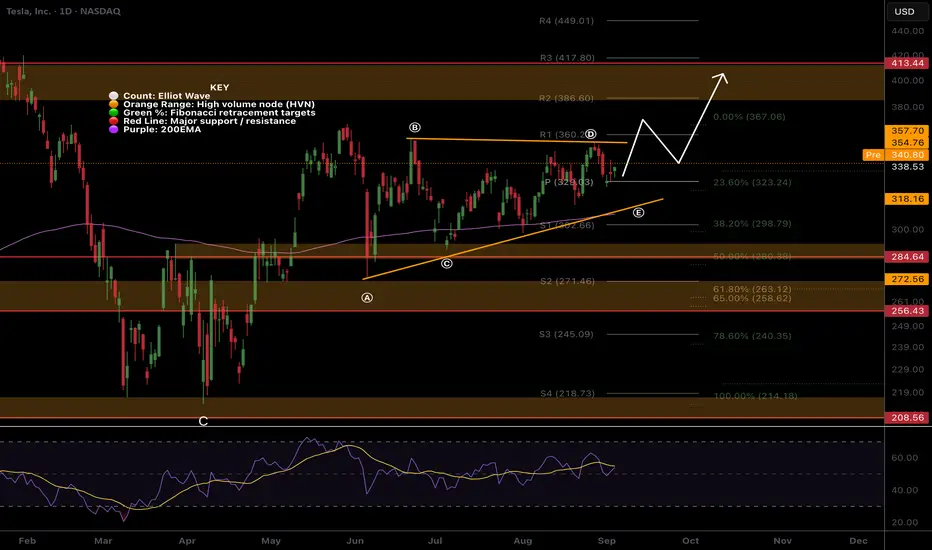
TESLA Bullish Wave C still underway...NASDAQ:TSLA is a tough count, the entire macro chart looks like a complex correction (wave 4?) with many series of 3 wave structures. A triangle in wave B of the current wave appears complete, leading to a terminal thrust up with a target of the High Volume Node resistance at $410 followed by a poke above the swing high touching the R1 pivot at $548. RSI remains at the EQ. Analysis is invalidated below the wave B triangle. Safe trading by Maddox_Metrics5
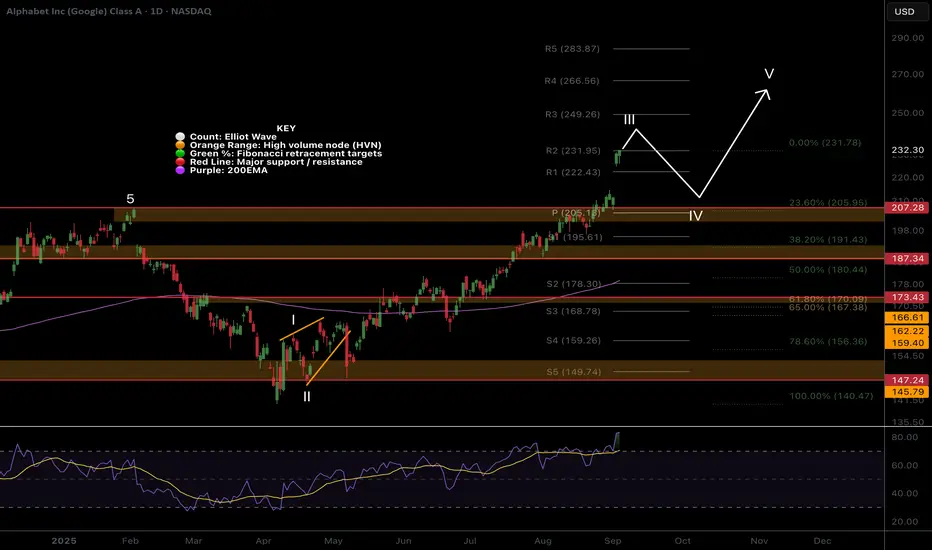
Google Elliot Wave count adjustedNASDAQ:GOOGL appears to be completing a motif wave 3 with a push into all time high on overbought bearish divergence in the RSI. This would align with 2.618 Fibonacci extension target, a high probability ending point for wave 3. Wave 4 would be expected to terminate at the nested wave (4) which aligns with triple support - Daily Pivot, High Volume Node and 0.236 Fibonacci retracement. The ascending 200EMA may come to meet price at this point adding confluence. For now the trend remains up. Safe trading by Maddox_Metrics1
Nasdaq Eyes the 23,700 Resistance Ahead of NVDIA EarningsOn the Nasdaq front, all eyes are on NVIDIA’s Q2 earnings, with expectations for revenue around 45.9B and EPS between 1.00–1.01. While enthusiasm around AI continues to drive tech optimism, concerns remain over tariff risks with China, particularly regarding potential backdoors or tracking technologies in NVIDIA chips. These risks could limit revenue potential from the Chinese market Nasdaq's rebound from the 22,900 mark appears sustainable, with daily RSI holding above the 50 neutral-barrier. A clean hold above 23,700 and 24,100 could pave the way toward new highs at 24,400 and 24,700, in line with continued AI-driven growth. Downside: A break below 23,200, 22,900, and especially 22,700 would signal broader tech sector weakness, potentially aligning price action with 22,300 and 21,900 support zones. Written by Razan Hilal, CMT by FOREX.com1
USNAS100 Update | Fed Pressure Keeps Market Under Bearish BiasUSNAS100 – Overview Tech fright calms but Fed pressure grows U.S. tech stocks appear to have stabilized after two sessions of sharp declines, but uncertainty persists as the Treasury market reacts to the latest Federal Reserve developments ahead of the central bank’s annual Jackson Hole symposium in Wyoming. Technical Outlook USNAS100 maintains a bearish setup while below 23,295. A break and sustained close above this level would signal a potential bullish reversal. 📍 Key Levels Pivot: 23,295 Support: 23,165 – 23,045 – 22,850 Resistance: 23,430 – 23,540 – 23,690 previous idea: Shortby SroshMayiUpdated 9
Why The Bubble Theory Makes No SenseIt seems like every other week with tech stocks making new all time highs, there is a constant chatter of claiming we're in a bubble. One of the classic signs of a bubble, is excessive leverage betting on ever higher returns. This is a chart of securities margin loans provided by the Fed updated quarterly. As you can see since the 2008 financial crisis speculators have been very conservative with their use of leverage. It's almost like 2008 scared people so badly people more than a decade later are still behaving financially conservative. Some of the rational for the talk of a bubble is historically high PE ratios, but this can be explained by massive reinvestments into AI infrastructure by the biggest tech companies. The more investments they make the higher the PE ratios look. The key ingredient of a bubble is leverage and besides the small spike of it post-covid, there is no sign of excessive speculation. Remember tech stocks are absolutely going to have a pullback likely next year or 2027, but the fear of a dot-com era bubble is just simply unfounded.Longby bwy1