EUR/GBP SHORT FROM RESISTANCE
Hello, Friends!
It makes sense for us to go short on EUR/GBP right now from the resistance line above with the target of 0.872 because of the confluence of the two strong factors which are the general downtrend on the previous 1W candle and the overbought situation on the lower TF determined by it’s proximity to the upper BB band.
Disclosure: I am part of Trade Nation's Influencer program and receive a monthly fee for using their TradingView charts in my analysis.
✅LIKE AND COMMENT MY IDEAS✅
Techincalanalysis

USOIL BEARS WILL DOMINATE THE MARKET|SHORT
USOIL SIGNAL
Trade Direction: short
Entry Level: 58.39
Target Level: 57.94
Stop Loss: 58.69
RISK PROFILE
Risk level: medium
Suggested risk: 1%
Timeframe: 1h
Disclosure: I am part of Trade Nation's Influencer program and receive a monthly fee for using their TradingView charts in my analysis.
✅LIKE AND COMMENT MY IDEAS✅

Gold Hits Buy Zone – Wait! Here's What to Confirm…◆ Market Context
On the M30 chart, the market shows a shift from a downtrend to a short-term recovery phase after forming BOS and CHoCH at the nearest bottoms. However, the upward movement has hit a prolonged downtrend line and reacted sharply downward again. This indicates that the trendline and upper resistance zone still maintain significant selling pressure.
◆ SMC & Price Action
• After breaking the upward BOS, the price made a strong push to 4,219 but couldn't sustain it, forming a downward reaction at the trendline and resistance zone.
• The Resistance Zone 4,211 – 4,219 has been confirmed by multiple price rejections.
• Currently, the market is adjusting to the Buy Support – Fibo – iFvG zone around 4,192. This is the first short-term support zone to test the buying momentum.
• If this zone doesn't hold, the price may return to the deeper liquidity zone 4,173 – where a large number of buyers' stop-losses are concentrated.
◆ Important Price Zones
Resistance (selling zone):
• 4,211
• 4,219
Short-term support:
• 4,192 (Fibo + iFvG + small OB)
Deeper support – Liquidity Pool:
• 4,173 (target zone if 4,192 support is broken)
◆ Main Trading Scenarios
➤ Scenario 1: Price holds at 4,192
• Wait for reversal signals at the support zone
• Recovery targets:
▪ 4,211
▪ 4,219
• If 4,219 is broken → the price may extend to a higher zone, but there is currently no confirmation signal for this.
➤ Scenario 2: Price breaks 4,192 support
• Short-term upward structure invalidated
• Prioritize following the downtrend
• Next targets:
▪ 4,173
▪ monitor liquidity reactions in this area to identify subsequent buying opportunities
➤ Scenario 3: Retrace to resistance for further selling
If the price retraces to 4,211 – 4,219 but doesn't break:
• Monitor rejection patterns
• This is a suitable zone to continue the downward movement following the main flow
◆ Summary
• The main trend still leans towards a decline, with the downtrend line in control.
• The 4,192 zone is a crucial reaction point to determine if buyers still have enough strength.
• If 4,192 is lost, the market is likely to seek liquidity at 4,173.
• If 4,192 holds, the price may recover to 4,211 – 4,219 before determining the next direction.

EurJpy Trade SetupNamaste
here EURJPY is very bullish and technical & fundamentals are ultra bullish but a major retest and liquidity grab is under sight and trade setup is shared.
BOOST and follow for more.
ASK ANY PAIR WILL SHARE INSIGHTS.

GBP/USD BEARS ARE GAINING STRENGTH|SHORT
GBP/USD SIGNAL
Trade Direction: short
Entry Level: 1.332
Target Level: 1.330
Stop Loss: 1.333
RISK PROFILE
Risk level: medium
Suggested risk: 1%
Timeframe: 1h
Disclosure: I am part of Trade Nation's Influencer program and receive a monthly fee for using their TradingView charts in my analysis.
✅LIKE AND COMMENT MY IDEAS✅

XAUUSD – Brian | Volume Profile before FedXAUUSD – Brian | Volume Profile before Fed: watch for a rebound to sell down
Market snapshot
Ahead of the Fed's interest rate announcement, gold is moving sideways within a fairly wide range, not yet choosing a clear direction.
In the H1 timeframe, the price fluctuates around the value area, making it very suitable for short-term trading according to the Volume Profile instead of trying to predict the meeting outcome.
Volume Profile – Key price areas
Nearest VAL: around 4.197 – the bottom of the current value area, where there was previous buying support.
Above, the FVG area + VAH/POC cluster is around 4.210 – this is an "air pocket" area where selling pressure can easily appear when the price fills the liquidity gap.
Below, the target for a downward wave if the Fed is not too dovish is around 4.13x (area 4.130–4.135) – coinciding with the old buy zone on the chart.
Trading scenario according to Volume Profile
Watch for a light Buy reaction at VAL 4.197
If the price slides to 4.197 and a nice rejection candle appears on H1/M15, a short scalp buy can be considered:
Idea: capture the rebound from VAL back to the middle/top of the value area, do not hold the position long.
Sell when the price fills FVG around 4.210 (priority scenario)
After the rebound from VAL, the FVG area 4.210 will be where Brian prioritizes watching for a Sell:
Reference sell entry: around 4.208–4.212
TP1: 4.185–4.180
TP2: 4.165–4.160
TP3: area 4.13x (4.130–4.135) if a strong sell-off occurs after the Fed
SL should be placed neatly above the FVG/VAH area (e.g., 4.218–4.220), avoid setting it too far.
Fed context – Why trade cautiously?
The focus this week is the FOMC meeting:
The market is waiting to see if Chairman Powell can create enough consensus to continue cutting interest rates with very few members opposing, similar to the previous 25 bps cut.
If the Fed maintains a dovish tone → USD weakens, yields cool down, gold is likely to bounce back after the sweep.
If Powell signals a "hawkish rate cut" (concern about inflation, cut less – talk tough) → yields rise, gold may complete a deep decline to the 4.13x area before stabilizing again.

XAUUSD – Brian | H1 Volume ProfileXAUUSD – Brian | H1 Volume Profile: risk of deep decline as market awaits PCE data
Market snapshot
On H1, gold is declining in a rather "clean" structure, continuously creating lower highs and lower lows.
The 4.175 area is currently the nearest support – if breached, the decline could extend another 50–60 points to lower areas.
Price remains below 4.250 USD, as the market awaits PCE data (Fed's preferred inflation measure) to find a clearer direction.
Technical map – Volume Profile & price areas
Important areas today: 4.210 – 4.200 – 4.175 – 4.164 – 4.133
4.210–4.200: upper area, coinciding with the nearest POC/VAH cluster – selling pressure likely when price retraces here.
4.175: short-term support + area with sell-side liquidity; if this area is lost, price could be pulled to a deeper demand cluster.
4.164–4.133: potential Buy zone in a deep decline scenario – Volume Profile shows significant buying occurred around this area previously.
In short: on H1, the trend is down, prioritize selling according to volume; consider buying only when price falls to a lower discount area.
Trading scenario reference
(Not personalized advice – adjust volume & SL according to your account)
Scenario 1 – Sell following the downtrend structure (priority)
Sell area: 4.210–4.200 (POC/VAH + technical retracement area)
Idea: Wait for price to retrace to this area, observe H1/M15 for rejection candles (long upper tail, pin bar, engulfing…) before activating a Sell order.
Suggested take profit areas: TP1: 4.175
TP2: 4.164
TP3: 4.133 (in case of a strong 50–60 point decline)
Scenario 2 – Buy at deep discount area
Buy area: 4.164–4.133
Idea: Only consider buying when price has "dumped" deeply enough into the buy zone, with clear reversal candles on H1.
At that point, this is a technical retracement play, not trying to catch the bottom of a major trend.
Suggested take profit areas:
TP1: return to 4.175
TP2: 4.200
Macroeconomic context – Why is gold still hesitant?
Gold recorded a slight increase on Friday, but remains within the narrow trading range of the week.
Expectations of a dovish Fed continue to pressure the USD, generally supporting gold in the medium term.
However, buyers are waiting for US PCE data before taking larger positions:
If PCE cools significantly → reinforces the story of an early Fed rate cut → gold could easily rebound.
If PCE remains stubborn → market fears a "hawkish rate cut" scenario from the Fed → yields may rise, adding selling pressure on gold.
Risk management
For the Sell scenario, avoid chasing price in the middle of the area – prioritize waiting for a retracement to POC/VAH before entering, with a tight SL above the 4.210–4.215 area.
If participating in the Buy play at 4.164–4.133, consider splitting TP and moving SL to breakeven as soon as TP1 is reached to avoid constant chart monitoring.

AUD/NZD SELLERS WILL DOMINATE THE MARKET|SHORT
Hello, Friends!
AUD-NZD uptrend evident from the last 1W green candle makes short trades more risky, but the current set-up targeting 1.142 area still presents a good opportunity for us to sell the pair because the resistance line is nearby and the BB upper band is close which indicates the overbought state of the AUD/NZD pair.
Disclosure: I am part of Trade Nation's Influencer program and receive a monthly fee for using their TradingView charts in my analysis.
✅LIKE AND COMMENT MY IDEAS✅

GOLD BEARISH BIAS RIGHT NOW| SHORT
GOLD SIGNAL
Trade Direction: short
Entry Level: 4,202.78
Target Level: 4,170.08
Stop Loss: 4,224.41
RISK PROFILE
Risk level: medium
Suggested risk: 1%
Timeframe: 1h
Disclosure: I am part of Trade Nation's Influencer program and receive a monthly fee for using their TradingView charts in my analysis.
✅LIKE AND COMMENT MY IDEAS✅

XAUUSD Intraday Plan | Rejection at 4219 Shifts Momentum LowerYesterday’s analysis is playing out — after failing to break the 4219 resistance, gold reversed and tested the lower boundary of the Reaction Zone.
Price is currently trading below the Reaction Zone and also below both the MA50 and MA200, signaling potential downside continuation toward the Support Area if selling pressure persists.
For any meaningful upside, buyers must first reclaim 4185 (previous support now turned resistance).
A break and hold above 4185 would open the door for another test of 4219.
A clean break above 4219 would shift short-term momentum and open the path toward 4251.
📌Key levels to watch:
Resistance:
4185
4219
4251
Support:
4144
4102
4049
4014
🔎Fundamental focus:
With the FOMC decision approaching tomorrow, markets tend to behave erratically: quick wicks, fake outs, fast reversals and increased volatility are typical. This is not the time to over-leverage — protect your capital and expect sudden moves in both directions.

CAD/JPY BEST PLACE TO SELL FROM|SHORT
Hello, Friends!
CAD/JPY pair is in the uptrend because previous week’s candle is green, while the price is clearly rising on the 4H timeframe. And after the retest of the resistance line above I believe we will see a move down towards the target below at 111.569 because the pair overbought due to its proximity to the upper BB band and a bearish correction is likely.
Disclosure: I am part of Trade Nation's Influencer program and receive a monthly fee for using their TradingView charts in my analysis.
✅LIKE AND COMMENT MY IDEAS✅

GBP/JPY BEARS ARE STRONG HERE|SHORT
GBP/JPY SIGNAL
Trade Direction: short
Entry Level: 208.062
Target Level: 207.460
Stop Loss: 208.462
RISK PROFILE
Risk level: medium
Suggested risk: 1%
Timeframe: 1h
Disclosure: I am part of Trade Nation's Influencer program and receive a monthly fee for using their TradingView charts in my analysis.
✅LIKE AND COMMENT MY IDEAS✅

XAU/USD H1 Plan: SELL at OB, BUY at Liquidity1. Market Structure (H1)
Gold is in a corrective phase after breaking the previous upward structure. From the nearest peak, the price continuously creates downward BoS waves, confirming that selling pressure is in control in the short term.
Currently, the price is moving within a descending channel and retesting the trendline multiple times but has not been able to breakout. This supports the scenario of the price continuing to complete a deeper decline to gather liquidity before forming a major recovery wave.
2. Important technical zones on the chart
🔹 OB – Sell Zone: 4,190 – 4,197
Confluence of Fibonacci 0.5 – 0.618 of the most recent decline.
This is the H1 supply zone where the price previously broke the downward structure → prioritize observing SELL when the price retraces.
🔹 Liquidity Buy Zone: 4,154 – 4,163
Liquidity cluster located just below the nearest bottom.
This is the area where the market is likely to create a liquidity sweep before reversing upwards.
🔹 Deep Liquidity Zone: 4,115 – 4,12x
Deep liquidity zone, confirmed by multiple old bottoms formed since the beginning of the month.
If the price is pushed down here, this will be a very strong BUY zone for the next major recovery wave.
3. Trading scenarios according to structure – clear & easy to follow
🔸 Scenario 1 – SELL from OB 4,19x (main scenario)
Activation conditions:
Price retraces to OB Sell zone 4,19x
Appearance of reversal signals M15–H1: strong rejection candles, ChoCH down, engulfing
Targets:
TP1: 4,163 (Liquidity)
TP2: 4,154
TP3 extended: 4,12x – 4,115
Note: This OB zone is a beautiful confluence – if the price reacts strongly, there is a high chance the market will complete the decline according to the model.
🔸 Scenario 2 – BUY according to Liquidity Sweep (priority after SELL)
After completing the decline to liquidity zones:
BUY Zone 1: 4,154 – 4,163
Wait for bottom sweep & ChoCH up → BUY according to recovery wave
BUY Zone 2: 4,115 – 4,12x (strongest Buy)
If the price breaks through the Liquidity zone 4,15x
This is the zone where the largest buying force may appear → expect to create a new H1 bottom
Targets for both BUY zones:
TP1: 4,195 (OB Sell retest)
TP2: 4,210
TP3 extended: 4,23x – 4,24x
Further: 4,25x – 4,27x (Fibo 1.272 – 1.618)
4. Important notes & risk management
Do not BUY when the price is standing in the descending channel – wait for sweep & confirmation.
SELL is only valid when the price hits exactly OB 4,19x, avoid FOMO selling in the middle of the zone.
BUY is invalid if H1 breaks deeply below 4,110.
Strong upward scenario only activates when H1 closes above 4,200.

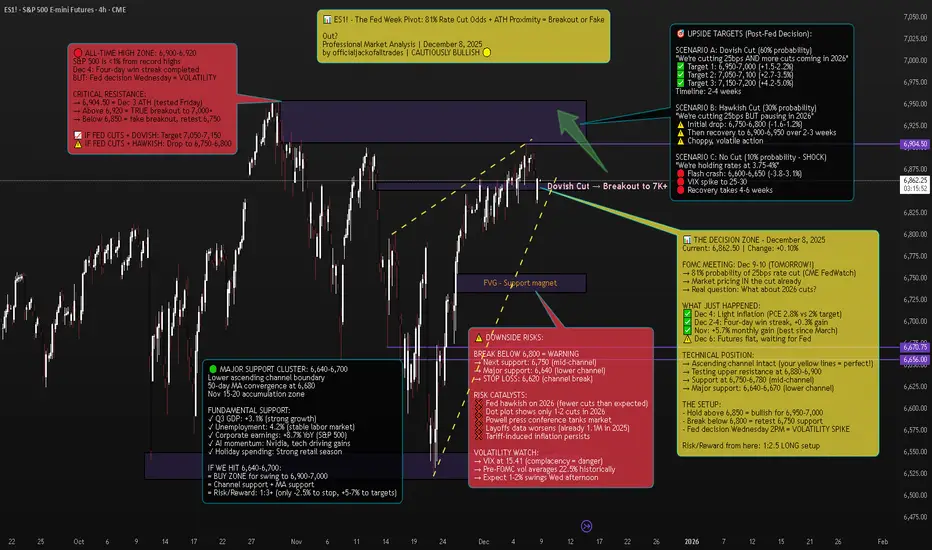
ES1! S&P 500 E-mini Futures - The Fed Week Pivot📈 Executive Summary - The Setup
Current Price: 6,862.50 | Date: December 8, 2025 | Change: +6.75 (+0.10%)
The S&P 500 E-mini futures are sitting less than 1% from all-time highs on the eve of the Federal Reserve's most anticipated meeting of 2025. After a four-day win streak that added 0.3% to the index, markets are now in a classic consolidation pattern at resistance, waiting for Wednesday's 2PM ET catalyst.
The Technical Picture:
Pattern: Ascending channel (intact since November)
Current Position: Testing upper resistance at 6,880-6,900
ATH: 6,904.50 (December 3) - 0.6% away
Support: 6,750-6,780 (mid-channel), 6,640-6,670 (lower channel)
The Fundamental Backdrop:
FedWatch shows a near-90% probability the FOMC will cut the target range for the federal funds rate by another 25 basis points. But here's what markets are REALLY pricing: not just the cut itself (that's a given), but Powell's guidance on 2026.
Minutes from the October meeting showed "many" FOMC members saying no more cuts are needed at least in 2025. Yet the market now indicates an 80% likelihood of a December rate cut, following dovish statements from NY Fed President John Williams and Fed Governor Christopher Waller.
The Trade: This is a tactical long from 6,850-6,870 targeting 6,950-7,050, with stop at 6,820. Risk/reward: 1:2.5.
But the real opportunity? Buying any Fed-induced dip to 6,750-6,800 for a swing to 7,000+.
🔎 Market Context - What's REALLY Happening
The Pre-Fed Calm
US stock futures stall as traders wait for the Fed meeting, with the S&P 500 just below record highs. This is textbook behavior: The indexes have quietly stitched together consistent gains. The Dow and Nasdaq scored back-to-back positive weeks; the S&P 500 added another 0.3% and now sits only a touch from record territory.
S&P 500 futures (ES) traded around 6,880-6,885, roughly 0.1% higher by 6:00-7:30 a.m. ET on Monday.
But don't mistake the calm for weakness. Even after November's wobble, dip-buyers came back as shutdown fears faded and AI jitters cooled.
The Fed's Dilemma
The Federal Reserve is in an impossible position:
Argument FOR cutting:
Concerns about a softening labor market
Employers cut more than 1.1 million jobs through November, the most since 2020 and a 54% increase from the same period a year ago
Job growth remains too low to keep up with labor supply growth and a rising unemployment rate
Argument AGAINST cutting:
Latest inflation scorecard, the Fed's preferred PCE index, is running at 2.8 percent a year, close to its 2 percent goal but not quite there
The annualized inflation rate grew to 3% in September from 2.9% in August and 2.7% in July
Officials expressing skepticism about the need for an additional cut that markets had been widely anticipating, with "many" saying that no more cuts are needed at least in 2025
The Missing Data Problem:
Here's something CRITICAL that most traders don't know: The U.S. central bank will have to make its decision without some key government data. Hiring data for November and the latest inflation number have been delayed until mid-December, after the Fed's meeting, because of the U.S. government shutdown.
The meeting minutes indicated the decision-making was complicated by a lack of government data during the 44-day federal government shutdown. Powell himself compared this to "driving in the fog".
Translation: The Fed is making a $28 TRILLION (SPY market cap) decision BLIND.
The Internal FOMC War
"It's difficult to recall a time when the Federal Open Market Committee has been so evenly divided about the need for additional rate cuts than the upcoming December meeting," Michael Pearce, chief U.S. economist at Oxford Economics, said.
Jerome Powell faces a credibility issue as he tries to satisfy hawks and doves on the most divided Fed in recent memory.
The October meeting vote was 10-2, but the 10-2 vote was not indicative of how split officials were at an institution not generally known for dissent. The minutes revealed multiple camps:
Some favored cutting
Some supported cutting but could have supported holding
Several were against cutting
For December, Mericle expects at least two dissents in favor of no rate cut as well as one in favor of a larger rate cut.
📊 Technical Analysis - The Ascending Channel At Decision Point
The Pattern: Ascending Channel (Bullish Structure)
Your chart annotation is PERFECT. The yellow dashed ascending channel captures the exact structure driving ES1! since the November bottom.
Channel Characteristics:
Lower Support: 6,640 (tested Nov 15, Nov 29) → 6,670 (current)
Upper Resistance: 6,850 (Nov 25) → 6,900 (Dec 3-6) → 6,920 (projected)
Angle: ~25° (strong bull trend)
Tests: 6 touches (3 upper, 3 lower) = highly reliable pattern
Current Position: We're at the UPPER boundary of the channel, testing 6,880-6,900 resistance.
Key Technical Levels:
🔴 RESISTANCE (Selling pressure zones):
6,880-6,900: Current test, upper channel boundary
6,904.50: All-time high from December 3
6,920-6,950: True breakout zone (if we clear ATH)
7,000: Psychological milestone
🟢 SUPPORT (Buying interest zones):
6,850: Immediate support, bull/bear line
6,800-6,820: Minor support cluster + FVG
6,750-6,780: Mid-channel support + 23.6% Fib
6,700-6,720: 38.2% Fib retracement
6,640-6,670: Major support (lower channel + 50-day MA + November accumulation)
Technical Indicators:
Moving Averages:
50-day MA: ~6,680 (rising, bullish)
200-day MA: ~6,450 (rising, bullish)
Golden Cross: Active since mid-November = long-term bullish
RSI (Relative Strength Index):
Current: 58-60 (neutral/slightly bullish)
Not overbought (room to run to 70+)
Not oversold (not panic selling)
Interpretation: Healthy consolidation before next leg
Volume Analysis:
Declining volume into Fed decision = normal pre-FOMC behavior
Stock volatility averages around 22.5% in the month preceding rate cuts, compared with roughly 15% during normal periods
Expect volume spike Wednesday 2PM-4PM (100K+ contracts)
VIX (Fear Index):
VIX at 15.41, down -0.37 (-2.34%)
This is LOW = market complacency
Pre-FOMC, VIX typically rises to 18-22
IF VIX spikes to 20+ Wednesday = sell signal
🎯 Scenario Analysis - Three Possible Outcomes
SCENARIO A: Dovish Cut (60% Probability) - BULLISH
What Happens:
Fed cuts 25bps to 3.50-3.75% range ✓
Dot plot shows 3-4 more cuts in 2026 ✓
Powell says "labor market concerns outweigh inflation" ✓
Balance sheet runoff stops as planned (December 1) ✓
Market Reaction:
Immediate: ES pumps 1-1.5% to 6,930-6,950
Day 1-3: Consolidation at 6,920-6,950
Week 1-2: Breakout to 7,050-7,100
Month 1: Target 7,150-7,200 (+4.2%)
Sector Leaders:
Small caps (Russell 2000) +2-3%
Tech (Nasdaq) +1.5-2%
Financials +1-1.5%
Trade Setup:
Enter: ANY dip to 6,850-6,870 before Fed
Add: On breakout above 6,910 with volume
Target: 7,050 (+2.7%), 7,150 (+4.2%)
Stop: 6,820 (-0.6%)
Risk/Reward: 1:4
SCENARIO B: Hawkish Cut (30% Probability) - NEUTRAL/CHOPPY
What Happens:
Fed cuts 25bps to 3.50-3.75% range ✓
BUT dot plot shows only 1-2 cuts in 2026 ❌
Powell says "we're near neutral, will pause to assess" ❌
Market had priced in 3-4 cuts for 2026 = DISAPPOINTMENT
Market Reaction:
Immediate: ES drops 0.8-1.2% to 6,790-6,820
Day 1: Volatility, chop between 6,780-6,850
Week 1-2: Dip-buying brings it back to 6,870-6,900
Month 1: Grind back to 6,950-7,000 (+1.3%)
Sector Rotation:
Small caps (Russell 2000) -1.5-2%
Tech holds up better (mega-caps)
Defensives (utilities, staples) outperform
Trade Setup:
DO NOT chase before Fed (risk of -1.2% drop)
Buy: Dip to 6,750-6,800 (mid-channel support)
Target: 6,900-6,950 (+2-3% from dip entry)
Stop: 6,720 (-1%)
Risk/Reward: 1:2
SCENARIO C: No Cut OR Very Hawkish (10% Probability) - BEARISH
What Happens:
Fed HOLDS at 3.75-4% range (SHOCK) ❌
OR cuts but says "this is the last one for 6+ months" ❌
Powell cites inflation persistence, tariff risks ❌
Market has 90% priced in for cut = PANIC
Market Reaction:
Immediate: ES flash crashes 2-3% to 6,650-6,750
Day 1: Volatility, VIX spikes to 25-30
Week 1-2: Bounce attempt to 6,750-6,800 fails
Month 1: Retest 6,600, then recovery to 6,800-6,850
Sector Carnage:
Small caps (Russell 2000) -3-4%
Tech -2-3%
Everything bleeds
Trade Setup:
Exit ALL longs immediately on no-cut announcement
Wait for VIX to spike above 25
Buy: Capitulation at 6,600-6,650 (lower channel)
Target: Recovery to 6,850-6,900 (+3-4%)
Risk/Reward: 1:3 (but high stress)
🎯 THE TRADE SETUP - Professional Execution Plan
🟢 PRIMARY LONG SETUP: BUY ES1!
Entry Strategy (Scale In):
Option A: Conservative (Wait for Fed)
50% at 6,750-6,780 (IF hawkish cut dips)
50% at 6,720-6,750 (IF deeper dip)
Best for: Risk-averse traders
Option B: Tactical (Enter Now)
40% at 6,860-6,870 (current - small position)
30% at 6,820-6,840 (IF pre-Fed dip)
30% at 6,750-6,780 (IF post-Fed dip)
Best for: Experienced traders comfortable with volatility
Stop Loss: 6,620 (HARD STOP)
Below 6,620 = channel break on daily close
Below this = technical structure invalidated
Max loss from 6,862 entry: -3.5%
Take Profit Targets:
TP1: 6,950-7,000 (Probability: 70%)
Initial breakout above ATH
Psychological 7,000 level
Action: Take 40% profit, move stop to 6,850
Gain: +1.3-2.0% | Risk/Reward: 1:2
TP2: 7,050-7,100 (Probability: 50%)
Momentum continuation
Channel projection
Action: Take 30% profit, trail stop to 6,920
Gain: +2.7-3.5% | Risk/Reward: 1:3
TP3: 7,150-7,200 (Probability: 30%)
Full breakout extension
TradingView puts it, with a potential breakout in S&P 500 futures above the 6,900 area
Action: Take 20% profit, let 10% ride
Gain: +4.2-4.9% | Risk/Reward: 1:4
Entry Confirmation Checklist:
Before entering, CHECK:
✅ Price holding above 6,850 (bull/bear line)
✅ Volume spike on bounce (80K+ contracts on 15min)
✅ RSI crosses above 60 (momentum shift)
✅ VIX drops below 16 (fear subsiding)
✅ Fed announces 25bps cut (as expected)
✅ Powell's tone is dovish or neutral (not hawkish)
WAIT FOR 4/6 BEFORE FULL POSITION
Fed Day Volatility Protocol:
December 10, 2PM ET - Fed Announcement:
1:45 PM: Tighten stops to 6,830 (before announcement)
2:00 PM: Fed statement released - READ IMMEDIATELY
2:00-2:05 PM: Algorithmic reaction (ignore, volatile)
2:05-2:30 PM: Human digestion of statement
2:30 PM: Powell press conference begins - WATCH LIVE
2:30-3:15 PM: Powell Q&A determines direction
3:15-4:00 PM: Final positioning for overnight
IF DOVISH: Add to position on dip to 6,900
IF HAWKISH: Cut 50%, trail rest tight at 6,820
Weekly Monitoring:
Check EVERY DAY:
Fed speakers: Any 2026 guidance changes
Economic data: Jobs (Dec 16), CPI (Dec 18)
Technical levels: Is channel intact?
VIX: Spikes above 20 = warning
Volume: Declining = weak trend
Emergency Exit Conditions:
❌ Daily close below 6,620 = EXIT ALL (channel break)
❌ VIX spikes above 25 = EXIT 50%, tight stop on rest
❌ Fed announces NO cut (10% scenario) = EXIT ALL immediately
❌ Powell says "this is the last cut for 2026" = EXIT 50%
❌ ES gaps down >1.5% overnight = reassess, likely exit
📊 Fundamental Analysis - Why This Matters
CATALYST #1: The Fed's Impossible Position
Federal Reserve policymakers are expected to cut interest rates at this week's meeting despite inflation remaining above their target amid concerns about a softening labor market.
This is the classic Fed dual mandate dilemma:
Mandate #1: Maximum employment (FAILING - 1.1M layoffs in 2025)
Mandate #2: Stable prices (FAILING - inflation at 2.8% vs 2% target)
They can't fix both. So they have to choose.
David Mericle, chief U.S. economist at Goldman Sachs notes job growth remains too low to keep up with labor supply growth and a rising unemployment rate.
My take: The Fed will prioritize employment over inflation. That's dovish = bullish for stocks.
CATALYST #2: Corporate Earnings Remain Strong
Despite all the macro noise, corporate profits are SOLID:
S&P 500 earnings: +8.7% YoY
Tech sector leading: +12-15% earnings growth
AI spending driving margins higher
Q4 guidance mostly positive
Carvana (CVNA) stock rose 8% before the bell on Monday following news on Friday that it will join the S&P 500 as part of the index's quarterly rebalancing.
Translation: Fundamentals support higher prices, Fed just needs to cooperate.
CATALYST #3: Seasonal Tailwinds
Could spark a "year-end melt-up", as TradingView puts it, with a potential breakout in S&P 500 futures above the 6,900 area.
December-January has positive seasonality:
Holiday spending strong
Tax-loss selling done (Nov-early Dec)
January effect (fresh capital inflows)
Pension/401k rebalancing (buy equities)
Historically, S&P 500 averages +1.3% in December and +1.1% in January.
CATALYST #4: Institutional Positioning
Bloomberg's interviews with 39 investment managers show that most are still planning for a risk-on 2026, citing expectations of continued AI-driven productivity and earnings growth.
But here's the key: Asset managers such as EFG Asset Management and BNP Paribas Asset Management caution that with 2025 already a strong year, they are reluctant to increase equity exposure into thin year-end liquidity, preferring instead to wait for better entry points in early 2026.
Translation: Institutions are WAITING to buy. Any Fed-induced dip to 6,750-6,800 will be AGGRESSIVELY bought.
⚠️ Risk Factors - The Bear Case
RISK #1: Hawkish Powell Tanks Market
Feroli noted that the firm is anticipating at least two dissents in favor of no rate cut as well as one in favor of a larger rate cut.
If Powell leans hawkish to appease the dissenting hawks, market could drop 1-2%.
RISK #2: Tariff-Induced Inflation
Minutes mentioned Trump's tariff policies in forecasts they provided in early September, projecting higher inflation and unemployment, slower growth and a lower federal funds ratel.
If inflation accelerates in 2026 due to tariffs, Fed might have to HIKE again = very bearish.
RISK #3: Labor Market Deterioration
Employers cut more than 1.1 million jobs through November, the most since 2020 and a 54% increase from the same period a year ago.
If this accelerates, could trigger recession fears.
RISK #4: Technical Breakdown
Break below 6,620 = channel invalidated → target 6,500-6,550 (-4.5-5.2%)
🔥 The Bottom Line
Here's what I KNOW on December 8, 2025:
✅ 81% probability of 25bps cut Wednesday
✅ S&P 500 less than 1% from ATH
✅ Your ascending channel is PERFECT technical structure
✅ 39 investment managers planning risk-on 2026
✅ Corporate earnings strong (+8.7% YoY)
✅ Seasonal tailwinds (December +1.3% avg)
✅ Support at 6,750-6,800 = institutional buy zone
Here's what I DON'T know:
Will Powell be dovish or hawkish?
How many 2026 cuts will dot plot show?
Will Q&A reveal recession concerns?
But here's what the MATH says:
Risk: 6,862 → 6,620 = -3.5% (if channel breaks)
Reward: 6,862 → 7,050 = +2.7% (base case)
Extended: 6,862 → 7,150 = +4.2% (bull case)
Risk/Reward: 1:2.5 minimum
The Play:
Small position NOW at 6,860-6,870 (20-30% of intended size)
IF hawkish dip to 6,750-6,800 → ADD 50-70%
IF dovish → ADD on breakout above 6,910
Stop at 6,620 (non-negotiable)
Target 7,050, then 7,150
This is a PROBABILITY game. 60% dovish, 30% hawkish, 10% shock. Position accordingly.
📍 Follow officialjackofalltrades for institutional-grade technical analysis, professional risk management, and trades backed by data.
Drop a 📊 if you're trading the Fed decision.
Drop a 🎯 if this helped your ES1! analysis.
Drop a 💰 if you're ready for 7,000+ SPX.
SLDE: buyers step in earlySlide Insurance (SLDE) remains attractive due to steady revenue growth in the digital-insurance segment, rising customer volume, and expansion of partnership channels. Recent reports show improving margins, and the stock has already recovered from the sharp summer drop. The sector itself is defensive, which keeps capital flowing even during periods of volatility.
Technically, the price continues to hold the ascending channel, repeatedly confirming demand around 15-15.3. A breakout of the local trendline with confirmation formed the basis for a new upward structure. EMA 20/50 act as dynamic support, and the pullback into the 0.618 Fibonacci level matches the accumulation zone. A breakout above 16.8-17.0 would confirm the next bullish leg toward the first target at 19.8. The second target sits near 22.3 where major supply is located.
Trading plan: long entries remain valid while price holds above the 15-16 support area and reclaims 16.8. Wave structure supports the beginning of a new bullish impulse. As long as the channel remains intact, buyers keep the advantage.

Gold Market Outlook: From Friday’s Volatility to Weekly Strategy
Last Friday was a textbook example of why I prefer to close positions early during the New York session. Everything followed my plan until mid-NY, when price broke the previous high but quickly pulled back to the 4,200 psychological benchmark. This was clear profit-taking ahead of the weekend, a common pattern that reinforces disciplined risk management on Fridays.
The monthly chart tells a compelling story. After breaking a multi-year neutral rectangle, gold entered a strong bullish cycle starting March 2024.
Key observations:
First bull run: 7 months, +28.7% gain → followed by 2-month consolidation.
Second bull run: 2 months, +25% gain → followed by 3-month consolidation.
Third bull run: +25% gain → now in third consolidation zone, likely before an attack on a new historical high.
This cyclical pattern suggests that the current consolidation is a launchpad for the next breakout, with mid-term targets at 4,300 and 4,380, and potential for new all-time highs if m
momentum persists.
On the 4H chart, price remains inside the neutral zone of an ascending channel:
Strong support: 4,192
A break below this level opens the path to the channel’s higher low at 4,164.
More likely scenario: Bullish engagement above 4,220 zone, aiming for a retest of the previous month high (4,246).
This week is packed with catalysts:
Wednesday: Federal Reserve interest rate decision – a critical event that could define gold’s next major move.
Labor market data: Strong U.S. numbers may trigger short-term pullbacks, while weaker data will reinforce bullish sentiment.
Geopolitical tensions and rate-cut expectations continue to provide structural support for gold.

SILVER BEARS WILL DOMINATE THE MARKET|SHORT
SILVER SIGNAL
Trade Direction: short
Entry Level: 5,843.1
Target Level: 5,765.0
Stop Loss: 5,895.0
RISK PROFILE
Risk level: medium
Suggested risk: 1%
Timeframe: 9h
Disclosure: I am part of Trade Nation's Influencer program and receive a monthly fee for using their TradingView charts in my analysis.
✅LIKE AND COMMENT MY IDEAS✅

XAUUSD – Brian | Volume Profile & Fed WeekXAUUSD – Brian | Volume Profile & Fed Week: prioritize Sell at VAH, Buy only when reaching discount price area
1. Market snapshot
On H1, gold retested last week's peak and then dropped immediately, indicating that buying pressure at high price levels remains cautious – investors are not ready to "chase the price."
The current structure does not clearly show a long-term trend, but in the short term, there are signs of distribution around high price levels, favorable for selling scenarios according to Volume Profile.
Today, Brian prioritizes watching for a Sell after the price fills the FVG and touches the VAH, while also preparing a Buy scenario at a lower area if the market sweeps liquidity strongly.
2. Volume Profile & price structure
The VAH area around 4,233–4,235 coincides with the FVG area above:
This is where large volumes were previously traded, making it easy for profit-taking/sell-off forces to appear.
Below, the sell-side liquidity levels are spread around 4,200 – 4,175 – 4,140, coinciding with the lows of previous sessions.
The area 4,172–4,175 is a good balance zone for the Buy scenario: below it is a cluster of liquidity and just above a broader Buy zone around 4,140 on the chart.
3. Trading plan for this week
Scenario 1 – Sell according to Volume Profile (priority)
Entry Sell: 4,233–4,235 (VAH + FVG)
SL: 4,241
TP1: 4,215
TP2: 4,200
TP3: 4,175
TP4: 4,140
Idea: wait for the price to fill the FVG and touch the VAH, observe the H1/M15 candle reaction. If there is a clear rejection signal (long upper tail, pin bar, engulfing…), activate the Sell order. This is a short-term play, based on volume & liquidity, not a chase sell when the price is in the middle of the zone.
Scenario 2 – Buy when the price reaches the discount area
Entry Buy: 4,172–4,175
SL: 4,165
TP1: 4,195
TP2: 4,220
TP3: 4,245
TP4: 4,290
Idea: if the price is strongly sold off sweeping through the sell-side liquidity areas, the area 4,172–4,175 can become a good demand zone to catch the rebound, especially when a nice candle reaction appears on H1. This is a "catch the rebound" buy position in the context of this Fed week, requiring disciplined SL.
4. Macro context – Why is the market hesitant?
Last Friday, gold jumped to 4,260 USD and then quickly fell to 4,200 USD, mainly due to the sharp rise in US bond yields as the market awaited the Fed meeting.
Although the market still prices in a high probability of the Fed cutting 25 bps, sentiment is divided by the "hawkish rate cut" scenario:
The Fed cuts but maintains a tough tone on inflation → yields are unlikely to fall deeply, gold is easily sold at high levels.
USD maintains its range, US economic data is relatively stable, causing money flows to "not dare to all-in" on gold before the dot-plot and Powell's speech.
Therefore, this week is the Fed's week: the short-term direction of gold will depend heavily on the policy message, especially the expected reduction path for next year.
Follow to receive the earliest articles from Brian

AUD/USD SENDS CLEAR BEARISH SIGNALS|SHORT
Hello, Friends!
We are going short on the AUD/USD with the target of 0.659 level, because the pair is overbought and will soon hit the resistance line above. We deduced the overbought condition from the price being near to the upper BB band. However, we should use low risk here because the 1W TF is green and gives us a counter-signal.
Disclosure: I am part of Trade Nation's Influencer program and receive a monthly fee for using their TradingView charts in my analysis.
✅LIKE AND COMMENT MY IDEAS✅

XAU/USD: Buy at 4.19x, Sell Short at OB 4.24x1. Market Context
Gold is moving within a corrective structure after the previous strong rally. The current price action revolves around two main zones:
Buy Support Zone 4,197–4,200: where the price continuously reacts, with multiple BoS – ChoCH increases → indicating that buying pressure still maintains the base.
OB Zone – Sell 4.24x: confluence of Fibonacci 0.5 – 0.618 – 0.786, a zone likely to see a decline reaction before forming a larger trend.
The current structure leans towards a recovery to the OB Sell zone, after which the market may continue to adjust deeper to create liquidity before rising again.
2. Important Technical Zones
🔹 Support – Buy Zone: 4,197 – 4,200
This is a strong price base, where BoS + ChoCH continuously form.
Only when breaking below this zone → the short-term uptrend structure weakens.
🔹 OB Zone – Sell: 4,238 – 4,245
Confluence of Fibonacci retracement (0.5–0.618–0.786).
A favorable zone for the market to create a decline reaction, triggering a liquidity sweep to lower lows.
🔹 Strong Low: 4.17x
This is an important low – if the price sweeps here but does not break → expect a strong rebound to higher targets.
3. Trading Scenarios According to Structure
🔸 Scenario 1: Price recovers to OB Sell 4.24x → look for short-term SELL signals
Wait for the price to hit the OB Sell zone and appear:
Strong rejection candle
ChoCH decreases on M15 frame
Volume increases at the peak
Then expect a decline back to the Support Buy zone 4,197–4,205.
Trading idea:
Sell zone 4,238–4,245
Target: 4.20x
If breaking 4.20x deeply → extend to Strong Low 4.17x
🔸 Scenario 2 (high priority): Buy at Support to catch the rise to 4.25x – 4.27x – 4.29x
After completing the decline according to scenario 1, the price may rebound from the strong demand zone.
BUY conditions:
Price sweeps down to 4,197–4,205 or deeper to 4.17x.
Reversal pattern appears + ChoCH increases.
Recreate HL (higher low) structure.
Targets:
TP1: 4,234
TP2: 4,244
TP3: 4,258
Extended TP: 4,276 – 4,299 (Fibo 1.272 – 1.618)
4. Risk Management Notes
Do not chase Buy when the price is in the OB Sell zone – easy to get swept.
Do not Sell deeply when not reaching OB 4.24x zone – price has not entered a nice premium zone.
Always clearly define invalidation levels:
BUY invalid when price closes H1 below 4.17x.
SELL invalid when price breaks strongly above 4,245 and holds.

SPY SELLERS WILL DOMINATE THE MARKET|SHORT
SPY SIGNAL
Trade Direction: short
Entry Level: 685.68
Target Level: 671.00
Stop Loss: 695.40
RISK PROFILE
Risk level: medium
Suggested risk: 1%
Timeframe: 9h
Disclosure: I am part of Trade Nation's Influencer program and receive a monthly fee for using their TradingView charts in my analysis.
✅LIKE AND COMMENT MY IDEAS✅

GBP/USD BEARISH BIAS RIGHT NOW| SHORT
Hello, Friends!
GBP/USD is making a bullish rebound on the 8H TF and is nearing the resistance line above while we are generally bearish biased on the pair due to our previous 1W candle analysis, thus making a trend-following short a good option for us with the target being the 1.323 level.
Disclosure: I am part of Trade Nation's Influencer program and receive a monthly fee for using their TradingView charts in my analysis.
✅LIKE AND COMMENT MY IDEAS✅

Somethings Off. Santa Clause Rally Ending In Sync w/Dollar Drop?Trading Fam,
Providing a quick update on a few new and alarming chart events and indications I am seeing. Usually, when the dollar drops, as long as the VIX remains low, stocks and crypto will rise. However, an anomaly is currently occurring on the charts. As stocks seem to be topping, the dollar is also testing major 17 year and 42 year support! I am not quite sure how to read this, but it seems that in this case, we could see stocks drop along with the dollar. How could this happen? Unknown. Could it have something to do with BRICS? Could it have something to do with the upcoming Fed decision? I honestly don't know how to answer this. I am simply just reading what the charts are showing me and telling you what it might mean for stocks and crypto.
Let's dive in!
✌️Stew
