Brian here with the gold outlook for November 20th Good morning everyone, Brian here with the gold outlook for November 20th. The ABC correction phase of gold is nearly complete, and the market is preparing to enter a new wave phase amidst a flurry of USD data today.
Fundamental Analysis
Today's focus remains on the US labor data: NFP (or revisions), Unemployment Rate, and Initial Jobless Claims.
If the data shows a cooling labor market, expectations for the Fed to soon pivot to a rate-cutting cycle will rise, weakening real yields, putting pressure on the USD, and supporting gold prices.
Conversely, "too good" data will strengthen the dollar, allowing for a short-term repricing move, potentially dragging gold down to lower liquidity zones before recovering.
US session liquidity may be thin before the news release, making it prone to spikes due to algorithms and large flows simultaneously adjusting positions.
Overall, the macro backdrop still favors "buying the dip" for gold, but you must accept strong volatility around news time.
Technical Analysis
On the chart, gold has completed an ABC corrective wave within a descending channel, part of a larger uptrend.
The current descending channel only serves as a corrective leg after the previous upward wave; prices are trading above the "mean" area of the bullish structure, indicating the larger market structure remains bullish.
Below is the liquidity zone / demand zone 4013–4015, coinciding with the previous low and the lower channel boundary – if there's another stop-hunt to this area, it is still considered an opportunity to join the upward move, as long as 4008 is not breached.
Above, the 4086–4100 cluster is the decision zone: breaking and holding above here will confirm exiting the corrective channel, triggering an impulsive leg towards resistances 4132–4146 and further to 4187.
In summary, the main bias remains bullish, prioritizing buy strategies at support zones or after breakout confirmation.
Key Price Levels
Resistance: 4086 – 4100 – 4110 – 4132 – 4146
Support: 4040 – 4030 – 4015
Trading Scenarios
Buy Scenario 1 – Continuation Breakout
Entry: 4086
SL: 4078
TP: 4100 – 4120 – 4140
Prioritize when price breaks up and retests 4086–4100 as a new support zone, confirming exit from the descending channel.
Buy Scenario 2 – Deep Liquidity Sweep
Entry: 4015–4013
SL: 4008
TP: 4030 – 4045 – 4070
Watch for strong price reactions at the demand zone, with pin bars or engulfing candles signaling order flow returning to buyers.
Sell Scenario – Sell Reaction at Strong Resistance
Entry: 4144–4146
SL: 4151
TP: 4132 – 4120 – 4100
Short-term sell strategy, leveraging the high supply zone if price rises straight up without sufficient accumulation.
The medium-term upside target if the bullish wave develops as expected remains the 4187 area.
What do you think of this scenario? Remember to follow Brian for daily gold insights and comment your views below to join the discussion.
Techincalanalysis

XAUUSD : Bearish Flip Targets $3930 LiquidityKey Observations and Interpretation
Previous Trend: The price experienced a strong bullish move, peaking around the $4,240 level, followed by a significant retracement.
Break of Structure (BOS): There was a previous Break of Structure (BOS) to the upside around $4,040, which indicated the start of the recent upward move. The price has now retraced back to and below this level.
Market Structure Shift/Change of Character: The move from the $4,240 peak down to the recent low near $3,990, followed by a lower high (X) at approximately $4,120, suggests a potential shift in market character from bullish to bearish.
Inducement/Minor Liquidity Sweep (I/S): The price action that led up to the high at X seems to have swept minor internal liquidity (I/S) before the larger drop.
Demand Zone/Fair Value Gap (D/FVG): The shaded area between roughly $4,040 and $4,070 represents a zone that was likely a prior demand zone or contains a Fair Value Gap (FVG). Price is currently interacting with this zone. In a bearish scenario, this zone is expected to act as resistance (a supply zone) after the structure shift.
Target Liquidity ($$$): The chart highlights multiple clear liquidity targets below the current price, marked by the triple dollar signs ($$$). These are levels where retail traders have likely placed stop-loss orders or where sell-limit orders are resting. These levels are approximately:
$3,980
$3,960
$3,930
📉 Projected Move
The analysis projects a likely scenario where the price:
Tests/Fills the D/FVG Zone: The price may experience a small bounce or consolidation within the $4,040 - $4,070 D/FVG zone (now acting as potential resistance/supply).
Continuation Lower: From this zone, the expectation is for the price to continue its move down.
Liquidity Sweep: The primary targets for the bearish move are the highlighted liquidity levels ($$$) below the $4,000 psychological level, with the deepest target around $3,930.

BITCOIN BULLS WILL DOMINATE THE MARKET|LONG
BITCOIN SIGNAL
Trade Direction: long
Entry Level: 91,611.86
Target Level: 109,265.02
Stop Loss: 79,807.17
RISK PROFILE
Risk level: medium
Suggested risk: 1%
Timeframe: 12h
Disclosure: I am part of Trade Nation's Influencer program and receive a monthly fee for using their TradingView charts in my analysis.
✅LIKE AND COMMENT MY IDEAS✅

AUD/CHF BEARS ARE GAINING STRENGTH|SHORT
Hello, Friends!
We are targeting the 0.514 level area with our short trade on AUD/CHF which is based on the fact that the pair is overbought on the BB band scale and is also approaching a resistance line above thus going us a good entry option.
Disclosure: I am part of Trade Nation's Influencer program and receive a monthly fee for using their TradingView charts in my analysis.
✅LIKE AND COMMENT MY IDEAS✅

NZD/CHF BUYERS WILL DOMINATE THE MARKET|LONG
Hello, Friends!
We are now examining the NZD/CHF pair and we can see that the pair is going down locally while also being in a downtrend on the 1W TF. But there is also a powerful signal from the BB lower band being nearby indicating that the pair is oversold so we can go long from the support line below and a target at 0.461 level.
Disclosure: I am part of Trade Nation's Influencer program and receive a monthly fee for using their TradingView charts in my analysis.
✅LIKE AND COMMENT MY IDEAS✅

GBP/CHF BULLISH BIAS RIGHT NOW| LONG
Hello, Friends!
Previous week’s red candle means that for us the GBP/CHF pair is in the downtrend. And the current movement leg was also down but the support line will be hit soon and lower BB band proximity will signal an oversold condition so we will go for a counter-trend long trade with the target being at 1.050.
Disclosure: I am part of Trade Nation's Influencer program and receive a monthly fee for using their TradingView charts in my analysis.
✅LIKE AND COMMENT MY IDEAS✅

NEO: the market wakes up and hints at a bullish reversalNeoGenomics is breaking out of a mid-term descending wedge while forming a clear trend reversal structure with higher lows and steady support above key Fibonacci retracement levels. The 10.00–10.80 area acts as a consolidation range before a potential continuation of the upward move.
The price has already broken the descending trendline, retested it, and is now holding above the 0.705 Fibonacci zone. EMA 20/50/100 are shifting toward a bullish alignment, confirming renewed buying pressure. Volume is increasing — a classic behavior after a prolonged decline. If the structure holds, the next bullish impulse may form right after breaking the 10.80 resistance.
Fundamentally, NeoGenomics is recovering after a sector-wide selloff in biotech. The company continues to strengthen revenue growth, improve its diagnostics portfolio, and reduce financial pressure — factors that often precede medium-term trend reversals in this sector.
Tactical plan: consider long positions after a confirmed breakout above 10.80. Targets: 15.00 (primary supply zone) and 19.20 as an extended target at the upper boundary of the previous long-term structure. Invalidation: breakdown below 9.00.
If the bullish impulse confirms, the move to 15 and beyond may unfold much faster than the market currently expects.

AUD/NZD BEST PLACE TO BUY FROM|LONG
AUD/NZD SIGNAL
Trade Direction: long
Entry Level: 1.146
Target Level: 1.159
Stop Loss: 1.137
RISK PROFILE
Risk level: medium
Suggested risk: 1%
Timeframe: 6h
Disclosure: I am part of Trade Nation's Influencer program and receive a monthly fee for using their TradingView charts in my analysis.
✅LIKE AND COMMENT MY IDEAS✅

AUD/CAD LONG FROM SUPPORT
Hello, Friends!
Bullish trend on AUD/CAD, defined by the green colour of the last week candle combined with the fact the pair is oversold based on the BB lower band proximity, makes me expect a bullish rebound from the support line below and a retest of the local target above at 0.917.
Disclosure: I am part of Trade Nation's Influencer program and receive a monthly fee for using their TradingView charts in my analysis.
✅LIKE AND COMMENT MY IDEAS✅

GOLD SENDS CLEAR BEARISH SIGNALS|SHORT
GOLD SIGNAL
Trade Direction: short
Entry Level: 4,168.46
Target Level: 4,053.04
Stop Loss: 4,244.92
RISK PROFILE
Risk level: medium
Suggested risk: 1%
Timeframe: 9h
Disclosure: I am part of Trade Nation's Influencer program and receive a monthly fee for using their TradingView charts in my analysis.
✅LIKE AND COMMENT MY IDEAS✅

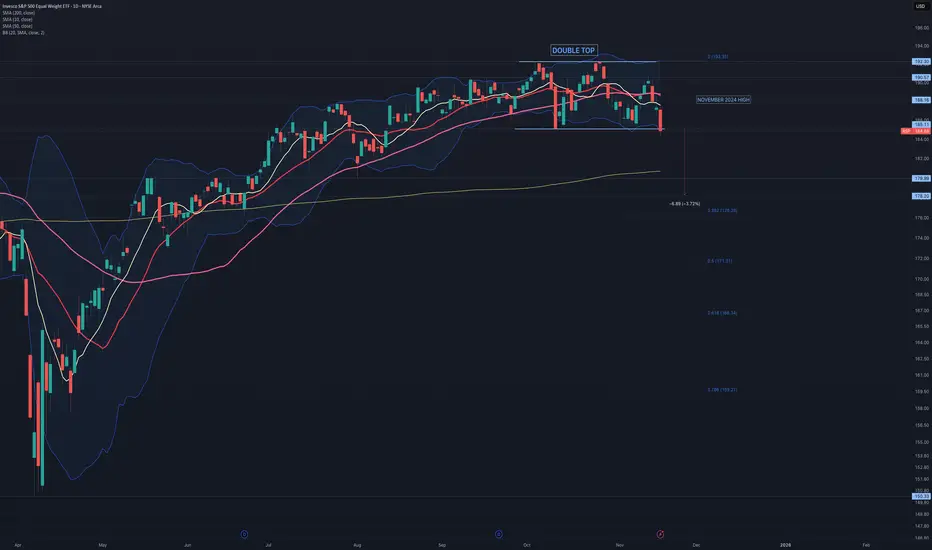
$RSP: Double TOP formation It is concerning that AMEX:RSP has formed a double top. If confirmed, the target price is set at 178. A breakdown of AMEX:RSP will face no obstacles until reaching 180, which is a demand zone and coincides with the rising 20-day simple moving average.
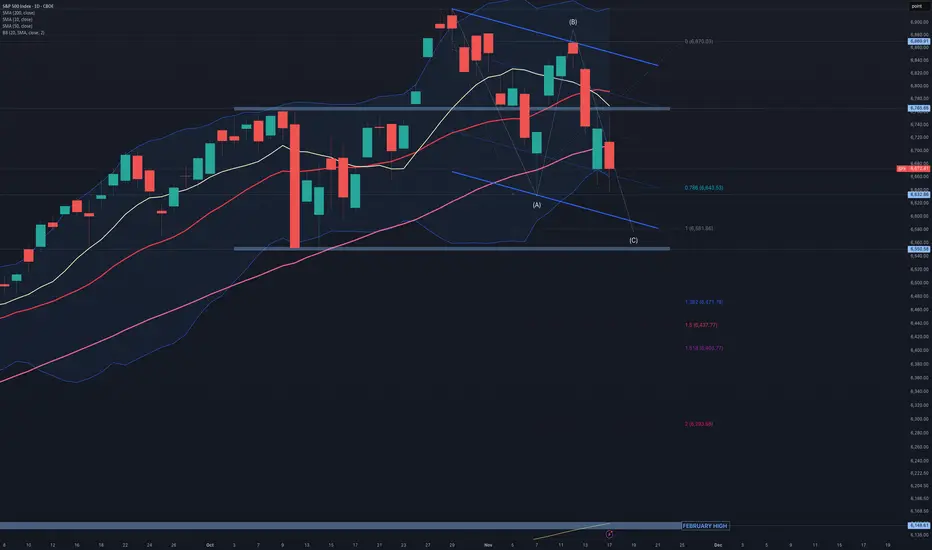
$SPX:Bearish technical indicators are accumulating:SPX: Bearish technical indicators are accumulating:
1) A sell signal on the MACD.
2) The RSI14 is at 42.
3) There has been a break below the 10, 20, and 50-period simple moving averages.
4) There is an inability to break above the horizontal resistance at 6765.
It is evident that the bullish momentum that followed the extremely bearish candlestick on October 10th has stalled, resulting in sideways trading with a slight downward trend. However, there is no immediate cause for concern since an underlying pressure is currently halting the decline.
At this point, we could expect a bullish flag pattern to emerge, which will be confirmed by the market's reaction to NVDA's results next Wednesday. The lower limit of the anticipated flag aligns with a 1x1 extension for wave (C). If the situation worsens and the flag is broken, it may transform into a zig-zag pattern, with extension targets for wave (C) indicated on the chart. Consider viewing this as an opportunity to enter a long position.
XAU/USD (Gold) 1H: Bearish Continuation Setup after BOSKey Observations and Market Structure
Previous Trend: The price experienced a significant downtrend following a peak around $4,180 to $4,200.
Break of Structure (BOS): A clear Break of Structure (BOS) to the downside confirms the shift from a potential uptrend/consolidation to a bearish trend continuation, with a key low being broken around $4,140.
Current Price Action and Consolidation: After the sharp drop, the price has entered a period of consolidation or short-term reversal attempt, currently trading around $4,087.53.
Identified Trading Range: The analyst has marked a specific Contraction Range (CRT) with a High (CRT-H) around the $4,140 level (the broken BOS level) and a Low (CRT-L) around the $4,075 level. This range defines the immediate trading boundaries.
Supply/Resistance Zone: A grey rectangular box is highlighted just below the CRT-H, approximately between $4,100 and $4,110. This zone likely represents a supply/resistance area (e.g., an Order Block or liquidity zone) where the price might react.
Trading Hypothesis (Based on Annotations)
The arrows and markings suggest a bearish setup within the context of the larger downtrend:
Anticipated Move Up (Liquidity Grab/Re-test): The first upward arrow indicates an expectation for the price to move up, possibly into the marked supply zone ($4,100-$4,110) or even toward the CRT-H ($4,140). This would be a move to fill inefficiencies, re-test the broken structure, or capture liquidity (a pullback).
Anticipated Move Down (Continuation): The curved arrow suggests that once the price reaches the supply zone/CRT-H, it is expected to reverse and continue the larger downtrend, aiming for levels below the CRT-L, potentially targeting $4,040 or lower.
The analysis appears to be using a Smart Money Concept (SMC) approach, focusing on market structure, liquidity, and supply/demand zones for short-term entry points (e.g., selling near the supply zone/BOS level).

SILVER BEARS WILL DOMINATE THE MARKET|SHORT
SILVER SIGNAL
Trade Direction: short
Entry Level: 5,103.6
Target Level: 4,498.0
Stop Loss: 5,504.6
RISK PROFILE
Risk level: medium
Suggested risk: 1%
Timeframe: 1D
Disclosure: I am part of Trade Nation's Influencer program and receive a monthly fee for using their TradingView charts in my analysis.
✅LIKE AND COMMENT MY IDEAS✅

CHF/JPY SENDS CLEAR BEARISH SIGNALS|SHORT
CHF/JPY SIGNAL
Trade Direction: short
Entry Level: 194.825
Target Level: 191.430
Stop Loss: 197.075
RISK PROFILE
Risk level: medium
Suggested risk: 1%
Timeframe: 12h
Disclosure: I am part of Trade Nation's Influencer program and receive a monthly fee for using their TradingView charts in my analysis.
✅LIKE AND COMMENT MY IDEAS✅

CAD/JPY SELLERS WILL DOMINATE THE MARKET|SHORT
Hello, Friends!
CAD/JPY pair is in the uptrend because previous week’s candle is green, while the price is clearly rising on the 1D timeframe. And after the retest of the resistance line above I believe we will see a move down towards the target below at 108.605 because the pair overbought due to its proximity to the upper BB band and a bearish correction is likely.
Disclosure: I am part of Trade Nation's Influencer program and receive a monthly fee for using their TradingView charts in my analysis.
✅LIKE AND COMMENT MY IDEAS✅

AUD/CHF BEARISH BIAS RIGHT NOW| SHORT
Hello, Friends!
AUD/CHF is trending down which is clear from the red colour of the previous weekly candle. However, the price has locally surged into the overbought territory. Which can be told from its proximity to the BB upper band. Which presents a great trend following opportunity for a short trade from the resistance line above towards the demand level of 0.519.
Disclosure: I am part of Trade Nation's Influencer program and receive a monthly fee for using their TradingView charts in my analysis.
✅LIKE AND COMMENT MY IDEAS✅

XAU/USD – Rebalancing Structure, Support Zone Holding Steady⏰ Timeframe: 30m
📅 Update: 17/11/2025
🔍 Market Context
After the extended decline late last week, gold is gradually stabilizing around the 4,050–4,080 USD zone, showing a positive reaction at the structural support zone.
The recent Break of Structure (BOS) sequence indicates that the selling momentum is gradually weakening, while the newly formed Order Block is acting as a temporary balance for the market.
The current structure slightly leans towards a technical recovery, as buying flows are returning around the main support zone.
📊 Technical Structure
Support Zone (4,049–4,080 USD): a critical support zone, confluencing with the previous liquidity bottom.
Order Block (4,096–4,115 USD): a short-term supply-demand area, potentially a retest point before the price expands higher.
Resistance Zone (4,145 USD): the first intermediate level to overcome to confirm upward momentum.
Target Zone (4,210 USD): the upper liquidity zone, corresponding to the potential expansion mark of the recovery wave.
🎯 Market Outlook
Priority scenario for the day:
1️⃣ Gold may retest the Order Block zone 4,096–4,115 USD before forming the first push up to 4,145 USD.
2️⃣ If buying pressure is maintained and this resistance zone is broken, the expansion momentum may head towards 4,210 USD, corresponding to a higher liquidity zone.
3️⃣ Losing the 4,049 USD mark will invalidate the recovery structure and bring the market back to a lower balance zone.
🧠 Analyst’s View
The market is currently in a reaccumulation phase after a strong correction.
Buyers still maintain a technical advantage as long as the price remains above the 4,049 USD support zone.
Observing price behavior around the Order Block and the 4,145 USD zone will be key signals to confirm the strength of this recovery wave.
🛡️ Risk Note
The current phase is a “pullback phase” within the larger structure.
Traders should wait for clear price behavior confirmation at technical zones rather than predicting movements in advance.

XAUUSD 1H: Potential Reversal and Order Block RetestKey Technical Observations
Prior Downtrend: The price has experienced a sharp decline from its high near $4,240, breaking through several support levels.
Break of Structure (BOS): A Break of Structure (BOS) was previously identified, signaling the continuation of the preceding uptrend when the $4,100 support level was broken to the upside on November 12th. However, the subsequent drop has now breached that same structural low to the downside, indicating a potential change in market character or at least a deep correction.
1H Sell/OB (Order Block): The current price is interacting with a key gray box labeled "1H SELL / OB" (Order Block), which is an area where significant selling pressure previously entered the market. The price has pushed below this block and is currently attempting to rally back toward it.
Bullish Setup Indication: The analysis on the chart shows a proposed inverse head-and-shoulders-like pattern or a short-term double bottom developing, characterized by the sharp move down and the immediate strong wick/reversal candle (the white circle/lightning bolt symbol) followed by an attempted bounce.
Projected Target: The chart projects a move back up to a "TARGET" level around $4,150. This move would likely involve breaking above the 1H SELL / OB zone.
Analysis and Interpretation
The setup suggests that traders are looking for a short-term long entry if the price can successfully move back into and hold above the previous support/resistance zone ($4,100 area) marked as the 1H SELL / OB.
Bullish Scenario: A successful break and close above the 1H SELL / OB zone would confirm the short-term bullish reversal attempt, aiming for the TARGET near $4,150. This could be a reaction to oversold conditions after the sharp drop.
Bearish Scenario: If the price fails to reclaim the 1H SELL / OB and continues to consolidate or drops below the recent low, the dominant bearish momentum from the recent peak would likely continue, targeting lower support levels.

TSLA BULLISH BIAS RIGHT NOW| LONG
TSLA SIGNAL
Trade Direction: short
Entry Level: 404.30
Target Level: 433.84
Stop Loss: 384.55
RISK PROFILE
Risk level: medium
Suggested risk: 1%
Timeframe: 5h
Disclosure: I am part of Trade Nation's Influencer program and receive a monthly fee for using their TradingView charts in my analysis.
✅LIKE AND COMMENT MY IDEAS✅

AUD/JPY BEST PLACE TO SELL FROM|SHORT
Hello, Friends!
AUD/JPY pair is trading in a local uptrend which we know by looking at the previous 1W candle which is green. On the 1D timeframe the pair is going up too. The pair is overbought because the price is close to the upper band of the BB indicator. So we are looking to sell the pair with the upper BB line acting as resistance. The next target is 99.105 area.
Disclosure: I am part of Trade Nation's Influencer program and receive a monthly fee for using their TradingView charts in my analysis.
✅LIKE AND COMMENT MY IDEAS✅

$QQQ: Doubtful Low The QQQ is currently showing a lower high and a lower low, indicating a likely corrective Zig Zag pattern, with wave C only slightly longer than wave A. The 1x1 Extension is positioned at 586. Last Friday's promising bounce was halted at the horizontal resistance level of 613.
The RSI has reached the same area where previous bounces occurred during the rally from the April low. The bulls need to demonstrate that last Friday's low can serve as a springboard for a recovery.

Gold: buyers defend the key demand zoneGold has reached the major demand zone at 4026–3993 — the same area where strong bullish reactions appeared multiple times in the past. The chart shows several reversal structures forming right inside this zone, while the price retests previous liquidity sweeps and a fair-value imbalance created before the last upward impulse.
Technically, gold remains inside a local descending channel, but the main focus is on the reaction from the demand zone. This level is supported by previous BOS signals, high-volume reactions and a clear accumulation base. EMA lines remain above the price, confirming the short-term bearish impulse, but zones like this often become the starting point for medium-term reversals.
Fundamentally, gold stays under pressure due to a strong USD and Fed expectations; however, macro-risks and safe-haven demand continue to prevent a deeper decline. If buyers hold 4026–3990, a recovery toward the major supply zone at 4210–4268 becomes highly probable.
Tactically: the main scenario is to look for confirmations to go long inside the demand zone. First target: 4170–4180. Main target: 4210–4268. If the zone breaks down, gold may head toward 3950.
If demand holds, the next impulse may come much faster than the market expects — gold often moves sharply once liquidity is collected.
