SILVER BEST PLACE TO SELL FROM|SHORT
SILVER SIGNAL
Trade Direction: short
Entry Level: 4,834.9
Target Level: 4,657.5
Stop Loss: 4,952.1
RISK PROFILE
Risk level: medium
Suggested risk: 1%
Timeframe: 9h
Disclosure: I am part of Trade Nation's Influencer program and receive a monthly fee for using their TradingView charts in my analysis.
✅LIKE AND COMMENT MY IDEAS✅
Techincalanalysis

AUD/NZD BEARS ARE STRONG HERE|SHORT
AUD/NZD SIGNAL
Trade Direction: short
Entry Level: 1.134
Target Level: 1.133
Stop Loss: 1.135
RISK PROFILE
Risk level: medium
Suggested risk: 1%
Timeframe: 1h
Disclosure: I am part of Trade Nation's Influencer program and receive a monthly fee for using their TradingView charts in my analysis.
✅LIKE AND COMMENT MY IDEAS✅

CAD/CHF SHORT FROM RESISTANCE
Hello, Friends!
Bearish trend on CAD/CHF, defined by the red colour of the last week candle combined with the fact the pair is overbought based on the BB upper band proximity, makes me expect a bearish rebound from the resistance line above and a retest of the local target below at 0.570.
Disclosure: I am part of Trade Nation's Influencer program and receive a monthly fee for using their TradingView charts in my analysis.
✅LIKE AND COMMENT MY IDEAS✅

NZD/CAD BULLS WILL DOMINATE THE MARKET|LONG
Hello, Friends!
NZD/CAD downtrend evident from the last 1W red candle makes longs trades more risky, but the current set-up targeting 0.814 area still presents a good opportunity for us to buy the pair because the support line is nearby and the BB lower band is close which indicates the oversold state of the NZD/CAD pair.
Disclosure: I am part of Trade Nation's Influencer program and receive a monthly fee for using their TradingView charts in my analysis.
✅LIKE AND COMMENT MY IDEAS✅

XAU/USD Intraday Plan | Support & Resistance to WatchGold is pulling back after failing to clear resistance around 3970, showing the first signs of intraday exhaustion following the sharp rally. The bias remains bullish, but it’s healthy to see some correction after strong momentum.
The MA50 acts as the first line of dynamic support, aligning with the 3937 support level. Failure to hold above this zone may open the way for a test of lower reaction zones before fresh buying interest emerges.
A clear break above 3970 will likely invite momentum buyers and push price toward the 4000 and possibly 4020 resistance levels.
📌Key Levels to Watch
Resistance:
3970
4000
4020
Support:
3937
3909
3880
3820
🔎Fundamental Focus:
The ongoing U.S. government shutdown continues to delay key data and elevate risk sentiment. With uncertainty rising and liquidity thinning, gold is highly reactive to political headlines, leading to erratic intraday volatility. Safe-haven demand underpins dips, but sudden reversals remain possible.

LiamTrading – Risk of adjustment before hitting the $4000 mark?LiamTrading – GOLD: Risk of adjustment before hitting the $4000 mark? ⚠️
Hello everyone,
Gold is approaching the psychological price zone of $4000/oz, but before reaching this historic milestone, the market may be preparing for a short-term adjustment.
According to Bank of America's technical strategist – Paul Ciana, gold's upward momentum is “overheated,” and a mid-cycle adjustment may occur soon.
📉 Technical Analysis (Chart H1 – Wolfe Waves Formation)
Observing the chart, a Wolfe Waves pattern is clearly forming:
The Sell zone 3988–3990 is the convergence point of wave number 5 – a potential short-term reversal area.
The Buy zone 3963–3965 is a local support retest point, where sellers tend to take short-term profits.
The Wolfe trendline indicates that the price may take liquidity above the peak area before a corrective drop appears.
If an adjustment occurs, the 3940–3955 area will be the first reaction zone, where strong buying support is present.
🎯 Trading Scenario
Buy retest:
📍 3963–3965
🛑 SL: 3960
🎯 TP: 3972 – 3985 – 4000
Sell following Wolfe waves:
📍 3988–3990
🛑 SL: 3995
🎯 TP: 3972 – 3955 – 3945
🧭 Medium-term Outlook
Although the upward trend remains dominant, momentum is gradually decreasing, and the market needs to “cool down” to create a new accumulation phase.
Dense liquidity zones around POC 3957–3960 may trigger a short-term pullback before gold gains momentum towards the ATH $4000 zone in the late-week sessions.
📌 Conclusion
Gold remains in a medium-term uptrend, but a short adjustment is necessary to maintain a sustainable upward structure.
Traders should prioritize flexible scalping, observing reactions at Fibo – Volume Profile zones – and especially the developing Wolfe Waves pattern.
I will continue to update the latest scenario details for XAUUSD daily.
👉 Follow me to not miss important wave movements!

GOLD approaches the $4k mark:The upward wave hasn't stopped yetLiamTrading – GOLD approaches the $4000 mark: The upward wave hasn't stopped yet
Hello everyone,
Gold continues to maintain its impressive upward momentum as the DXY only slightly increases by 0.50% and is currently at 98.21 – a signal indicating that safe-haven flows still prioritize precious metals.
Currently, the technical structure on H1 shows gold is in a clear upward channel, with reaction zones accurately identified through Fibonacci and trendlines, aiming for the next major target of $4000/oz.
📊 Technical Analysis (H1)
Main trend: Strong increase, the Higher High – Higher Low structure remains solid
Main support zone: around 3890 – 3900, coinciding with the confluence of Fibo 1.0 + upward trendline
Psychological resistance zone: 3955 – 3999, corresponding to Fibo expansion 2.0 – 3.6
RSI is entering the 70+ zone, reflecting strong buying pressure but short-term correction signs need to be observed.
🎯 Today's Trading Scenarios
Buy scalping
📍 3909 – 3911
🛑 SL: 3904
🎯 TP: 3940 – 3955 – 3970 – 3990
Buy swing
📍 3888 – 3890
🛑 SL: 3882
🎯 TP: 3910 – 3925 – 3950 – 3975 – 3990
Sell scalping
📍 3956 – 3958
🛑 SL: 3964
🎯 TP: 3935 – 3910 – 3890
Sell swing
📍 3997 – 3999
🛑 SL: 4010
🎯 TP: 3975 – 3950 – 3925
🧭 Trend Analysis
With the current upward force and stable technical structure, the $4000 target is entirely feasible in the short term.
The preferred strategy is to BUY with the trend, waiting for pullbacks to optimize entry, avoiding FOMO at the peak.
Corrections to the support zone 3890–3900 will be a beautiful opportunity to open buy positions.
💡 I will continue to update detailed reaction zones & new plans in each session.
Follow me for the earliest updates on daily gold scenarios!

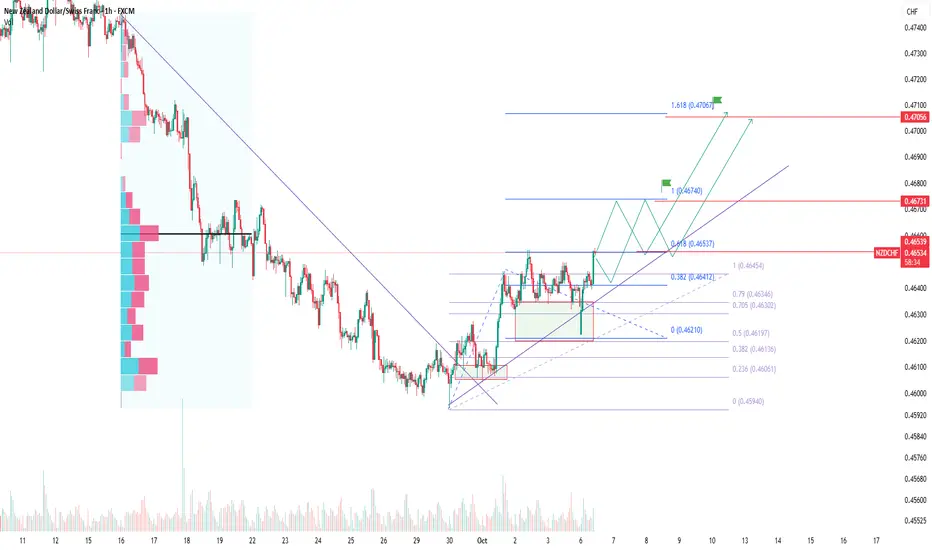
NZDCHF: rebound after downtrend with Fibonacci targetsNZDCHF has found support after a prolonged decline and broke through the local descending trendline. The price is now holding above the 0.4650–0.4660 area, aligning with key Fibonacci retracement levels, which strengthens the bullish outlook.
Technically, if the pair stays above 0.4650, a retest could follow before the next push toward 0.4674 and 0.4706, which aligns with the 1.618 Fibonacci extension. Some consolidation around 0.4660–0.4670 is possible before continuation higher.
From a fundamental view, the New Zealand dollar benefits from commodity price resilience and Asian market optimism, while the Swiss franc remains a safe haven. As global risk appetite improves, investors tend to rotate into higher-yielding currencies, supporting NZD.
This is a classic reversal setup: a base after oversold conditions, with confirmation needed before further entries. As always, wait for signals and avoid emotional trading.
Gold FOMO Surge – 1000-Pip Buy Chance Ahead!GOLD PLAN FOR 06.10 | Captain Vincent
✳️ Hello to all traders,
Today, we are not only analyzing Gold (XAU/USD) from a purely technical perspective ⚙️, but also witnessing the perfect confluence between technicals and fundamental news. A price surge storm is forming, promising exciting trading opportunities.
📊 1. Technical Analysis: Sustainable Uptrend Structure
Technically, the uptrend of Gold on the H1 frame is indisputable.
🔹 Break of Structure (BoS):
Gold continuously breaks previous highs, indicating that buying pressure is completely overwhelming.
Each BoS point is a clear affirmation of the strength of the uptrend.
🔹 Potential Demand Zone:
After each surge, the price often takes a "rest" to accumulate.
Currently, the price may adjust to the $3,883,020 - $3,905,169 zone, where the confluence between the Fair Value Gap (FVG) and Bullish Order Block (Bullish OB) – creates an ideal launchpad for the next surge.
🏦 2. Fundamental Analysis: The Fire Has Been Ignited
If technicals show the way, then fundamental news is the fuel propelling the uptrend.
🔸 U.S. Government Shutdown:
This event creates political and economic instability, causing capital to flee from risky assets.
Gold – the number 1 safe haven – is directly benefiting as investors seek to preserve assets.
🔸 Fed Ready to Cut Interest Rates:
The market is almost certain that the Fed will cut interest rates by 0.25%.
This reduces the appeal of the USD, further strengthening Gold's advantage, which is a non-interest-bearing asset.
🔸 "Thirst" for Economic Data:
The government shutdown also disrupts the release of important economic data, leaving the market lacking information and increasing uncertainty.
In this environment, Gold continues to maintain its role as a safe haven.
🎯 3. Comprehensive Trading Plan
When technicals and fundamentals align, the reliability of the trading strategy is significantly enhanced.
Strategy:
Wait to buy (Long) when the price adjusts to the demand zone $3,883,020 - $3,905,169.
Entry signals:
Observe confirmation of a bullish reversal in this zone such as:
Pin bar candles, engulfing
Or BoS on the M15 frame
Targets:
Short-term: $3950 – $3990
Long-term: Target “+1000 pips”
Risk management:
Place Stop Loss below the Bullish OB zone to protect the account.
🧭 Conclusion
The current market sentiment is very favorable for the Buyers:
USD is under downward pressure
Defensive capital flows strongly into Gold
The FOMO effect may stimulate an extended rally
The combination of solid technical structure and strong fundamental support is creating an almost perfect bullish picture.
👉 Be patient, stick to the plan, and await this golden opportunity.
💼 Wishing you all an effective and victorious trading day!

GOLD SENDS CLEAR BEARISH SIGNALS|SHORT
GOLD SIGNAL
Trade Direction: short
Entry Level: 3,930.90
Target Level: 3,882.75
Stop Loss: 3,962.92
RISK PROFILE
Risk level: medium
Suggested risk: 1%
Timeframe: 1h
Disclosure: I am part of Trade Nation's Influencer program and receive a monthly fee for using their TradingView charts in my analysis.
✅LIKE AND COMMENT MY IDEAS✅

AUD/CAD BEARS ARE GAINING STRENGTH|SHORT
AUD/CAD SIGNAL
Trade Direction: short
Entry Level: 0.921
Target Level: 0.910
Stop Loss: 0.928
RISK PROFILE
Risk level: medium
Suggested risk: 1%
Timeframe: 1D
Disclosure: I am part of Trade Nation's Influencer program and receive a monthly fee for using their TradingView charts in my analysis.
✅LIKE AND COMMENT MY IDEAS✅

EUR/USD BEST PLACE TO BUY FROM|LONG
Hello, Friends!
We are now examining the EUR/USD pair and we can see that the pair is going down locally while also being in a downtrend on the 1W TF. But there is also a powerful signal from the BB lower band being nearby indicating that the pair is oversold so we can go long from the support line below and a target at 1.175 level.
Disclosure: I am part of Trade Nation's Influencer program and receive a monthly fee for using their TradingView charts in my analysis.
✅LIKE AND COMMENT MY IDEAS✅

AUD/NZD SENDS CLEAR BEARISH SIGNALS|SHORT
Hello, Friends!
Previous week’s green candle means that for us the AUD/NZD pair is in the uptrend. And the current movement leg was also up but the resistance line will be hit soon and upper BB band proximity will signal an overbought condition so we will go for a counter-trend short trade with the target being at 1.137.
Disclosure: I am part of Trade Nation's Influencer program and receive a monthly fee for using their TradingView charts in my analysis.
✅LIKE AND COMMENT MY IDEAS✅

EUR/JPY SENDS CLEAR BEARISH SIGNALS|SHORT
Hello, Friends!
EUR/JPY is trending down which is clear from the red colour of the previous weekly candle. However, the price has locally surged into the overbought territory. Which can be told from its proximity to the BB upper band. Which presents a great trend following opportunity for a short trade from the resistance line above towards the demand level of 173.742.
Disclosure: I am part of Trade Nation's Influencer program and receive a monthly fee for using their TradingView charts in my analysis.
✅LIKE AND COMMENT MY IDEAS✅

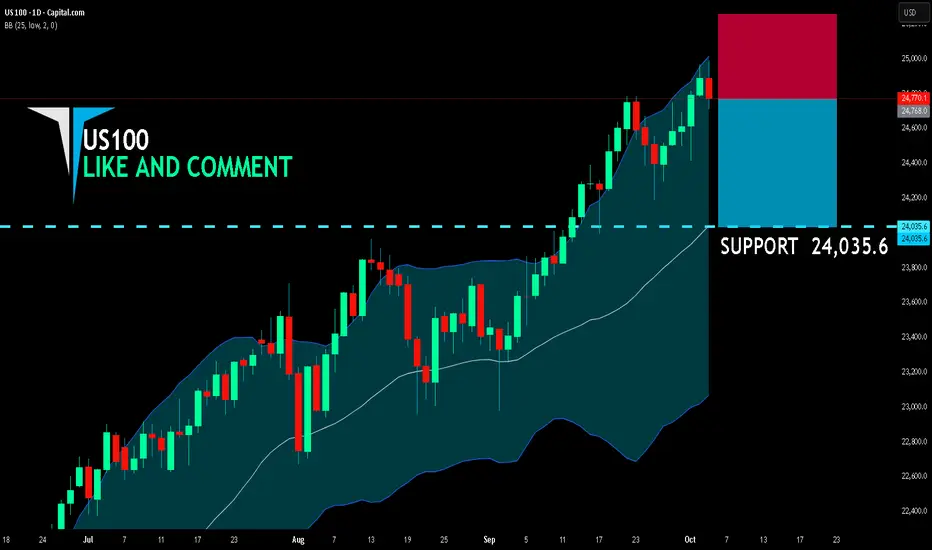
US100 BEST PLACE TO SELL FROM|SHORT
US100 SIGNAL
Trade Direction: short
Entry Level: 24,768.0
Target Level: 24,035.6
Stop Loss: 25,254.9
RISK PROFILE
Risk level: medium
Suggested risk: 1%
Timeframe: 1D
Disclosure: I am part of Trade Nation's Influencer program and receive a monthly fee for using their TradingView charts in my analysis.
✅LIKE AND COMMENT MY IDEAS✅
LiamTrading – GOLD Weekly Plan - new ATHLiamTrading – GOLD Weekly Plan: Prepare for the breakout to a new ATH
The new trading week opens with an extremely complex sentiment — many traders are confused, and even the “sharks” have to be cautious.
But if you look more closely at the price structure, everything becomes clear: gold is still in a sustainable uptrend.
🧠 Psychological & Trend Analysis
Gold just closed the week with a strong upward force, confirming the continuation of the medium-term uptrend.
At this stage, “Selling the top” is almost a dangerous action – as each correction is shallow and quick, not allowing sellers to exit in time.
This creates a strong “fear of missing out” (FOMO) mentality – causing money to continue flowing in when the price hits the trendline or technical retracement zone.
📊 Technical Analysis
On the H4 chart, the upward structure of gold is clearly visible following the impulse + correction box model (each accumulation – breakout repeats).
The 3820–3830 area continues to be the “golden retracement point” as it coincides with the medium-term uptrend line.
Last week's bounce from this area brought excellent profits for those who patiently waited.
Currently, the next target for gold is at the Fibonacci 1.618 level – around 3980, which is also a significant psychological level where many investors might take profits.
🎯 Trading Scenarios
Buy setup (trend-following):
Entry: 3830
Stoploss: 3815
Take Profit: 3980
Sell reaction (short-term when target is reached):
Entry: around 3980
Stoploss: 3988
TP open depending on price reaction (scalping strategy)
🔍 Conclusion
Gold is still on the right growth trajectory, with short corrections being just opportunities to “accumulate”.
Continue trading with the trend, patiently waiting for prices to retrace to strong confluence zones instead of FOMO at high prices.
I will continue to share more details in daily updates here.
Follow me to not miss the latest gold scenarios.

Nifty supply demand 6th OctoberNifty supply demand 6th October
Check the third dated trading plan that uses supply and demand zones drawn from the chart before yesterday

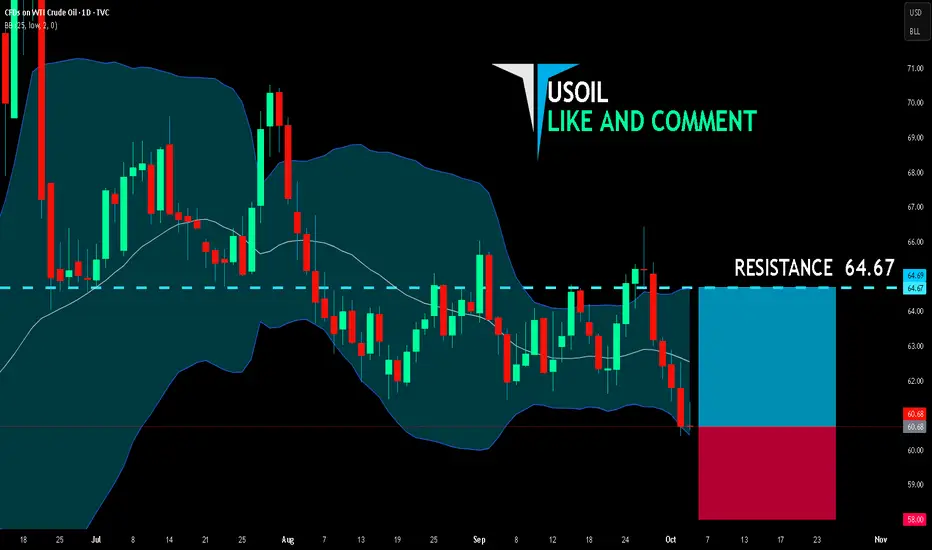
USOIL LONG FROM SUPPORT
USOIL SIGNAL
Trade Direction: long
Entry Level: 60.68
Target Level: 64.67
Stop Loss: 58.00
RISK PROFILE
Risk level: medium
Suggested risk: 1%
Timeframe: 1D
Disclosure: I am part of Trade Nation's Influencer program and receive a monthly fee for using their TradingView charts in my analysis.
✅LIKE AND COMMENT MY IDEAS✅
GBP/CHF BEARS WILL DOMINATE THE MARKET|SHORT
Hello, Friends!
GBP/CHF is making a bullish rebound on the 8H TF and is nearing the resistance line above while we are generally bearish biased on the pair due to our previous 1W candle analysis, thus making a trend-following short a good option for us with the target being the 1.065 level.
Disclosure: I am part of Trade Nation's Influencer program and receive a monthly fee for using their TradingView charts in my analysis.
✅LIKE AND COMMENT MY IDEAS✅

EUR/CHF SENDS CLEAR BULLISH SIGNALS|LONG
Hello, Friends!
It makes sense for us to go long on EUR/CHF right now from the support line below with the target of 0.935 because of the confluence of the two strong factors which are the general uptrend on the previous 1W candle and the oversold situation on the lower TF determined by it’s proximity to the lower BB band.
Disclosure: I am part of Trade Nation's Influencer program and receive a monthly fee for using their TradingView charts in my analysis.
✅LIKE AND COMMENT MY IDEAS✅

EUR/GBP BEST PLACE TO SELL FROM|SHORT
Hello, Friends!
EUR-GBP uptrend evident from the last 1W green candle makes short trades more risky, but the current set-up targeting 0.870 area still presents a good opportunity for us to sell the pair because the resistance line is nearby and the BB upper band is close which indicates the overbought state of the EUR/GBP pair.
Disclosure: I am part of Trade Nation's Influencer program and receive a monthly fee for using their TradingView charts in my analysis.
✅LIKE AND COMMENT MY IDEAS✅

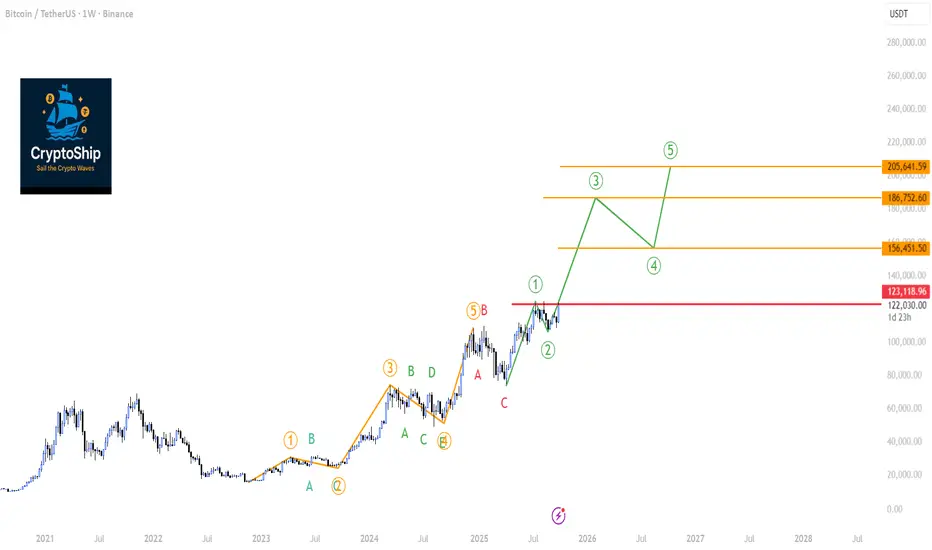
BTC vs. The Broader Market: A Dangerous Powerful Wave is Coming Today, we're taking a deep dive into the two most important charts in the crypto space: Bitcoin (BTC/USDT) and the Total Crypto Market Cap (TOTAL). Using an Elliott Wave framework on the weekly timeframe, we can see a clear bullish structure taking shape. However, some underlying weaknesses in key indicators warrant a cautious approach. Let's break it down.
1. Bitcoin (BTC/USDT): The Path to a new All-time high Hinges on a Key Level
As we can see on the weekly chart, Bitcoin appears to have completed a major five-wave impulse cycle which topped out around the $108,000 mark. This was followed by a necessary ABC corrective phase.
The exciting part is what comes next. We are potentially witnessing the beginning of a brand new five-wave impulse.
Wave (1): Appears to have started from the $74,000 low and peaked near $124,000.
Wave (2): A healthy correction followed, finding support around $107,000.
If this count is valid, we are now in the early stages of Wave (3), which is typically the most powerful and extended wave in an impulse sequence.
The Critical Condition:
For this bullish count to remain the primary scenario, the current weekly candle must NOT close below $123,000. A weekly close below this crucial level would risk invalidating the start of this new impulse, suggesting that we may still be within a more complex corrective structure (such as a regular flat correction Check the article).
Also during wave (3) the Weekly RSI must go beyond "80" showing strong momentum ( if it fails to do so then it's a caution signal to be strongly considered because a reversal could happen at any time!)
Indicator Analysis:
Bearish Divergences: We must note the lingering bearish divergences on both the RSI and MACD. These signals are suspicious and suggest that momentum is not fully confirming the recent price highs. They need to be monitored closely.
Volatility Coiling: The Bollinger Band Width Percentile (BBWP) is showing significant contraction. This coiling of the bands indicates that weekly volatility is decreasing, which often precedes a massive price expansion in the coming weeks or months, However the lack of BBWP exhaustion (spectrum crossing 90%) remains a bullish sign combined with the contraction
Trend Strength: The ADX is rising on the weekly chart, confirming that a strong trend is in progress.
Volume: On-Balance Volume (OBV) and general volume profiles appear adequate for now.
2. Total Crypto Market Cap (TOTAL): The Broader Market Picture
The Total Crypto Market Cap chart tells a very similar story, reinforcing our Bitcoin analysis. The bullish phase began in sync with BTC back in November 2022.
The current Elliott Wave structure for the entire market is as follows:
Wave (1): Completed in March 2024.
Wave (2): Corrected into May 2024.
Wave (3): Finshed on March 2024
Wave (5): Finshed on December 2024
Currently the Total market cap chart is closely alligned with BTC chart which confrims the BTC leadership is intact. The current Elliot count of TOTAL market cap indicated wave (1) started April 2025 but curretly wave 2 showing caution signals
A Significant Red Flag - The Volume Divergence:
While the price structure remains bullish, there's a concerning signal under the hood. On the weekly RSI, we see a double bottom pattern, which is typically bullish. However, looking at the On-Balance Volume (OBV) during the same period, the OBV printed a lower low.
This is a classic bearish divergence between price/momentum and volume. It indicates that the recent push higher is not being supported by genuine, strong volume, suggesting conviction is weak.
Alternative Scenario:
If this volume weakness persists, we might see Wave (2) extenstion to around $3.23 Trillion. This would lead to a deeper Wave (2) correction, From that support, Wave 3 could launch that would still likely reach our ultimate ATH.
Conclusion: Bullish Outlook with a Note of Caution
Bringing both analyses together, the macro view for the crypto market remains decisively bullish. The Elliott Wave structures on both BTC and the TOTAL chart point towards significantly higher valuation, the lack of BBWP exhaustion on weekly charts of BTC & Total market cap remains a strong bullish indication combined with the BBWP expansion.
However, the market is showing signs of fatigue. The bearish divergences on Bitcoin's indicators and the critical volume divergence on the TOTAL chart cannot be ignored. This suggests that while the overall destination is uptrend, the journey might include a corrective dip before the next explosive leg higher.
Key Takeaways:
Overall Bias: Bullish.
Key Level for BTC: Watch the weekly close relative to $123,000. This is our line in the sand for the current impulsive structure.
Key Concern: The lack of strong volume confirming the market's recent move up warrants caution.
Volatility: Brace for a significant expansion in price movement. The compressed BBWP on both charts suggests a major move is brewing.
Stay vigilant and manage your risk accordingly. The next few weekly closes will be critical in determining whether we blast off directly or take a detour first.
GOLD BEARS ARE GAINING STRENGTH|SHORT
GOLD SIGNAL
Trade Direction: short
Entry Level: 3,865.68
Target Level: 3,657.24
Stop Loss: 4,004.25
RISK PROFILE
Risk level: medium
Suggested risk: 1%
Timeframe: 1D
Disclosure: I am part of Trade Nation's Influencer program and receive a monthly fee for using their TradingView charts in my analysis.
✅LIKE AND COMMENT MY IDEAS✅
