EUR/CAD BEARISH BIAS RIGHT NOW| SHORT
Hello, Friends!
Bearish trend on EUR/CAD, defined by the red colour of the last week candle combined with the fact the pair is overbought based on the BB upper band proximity, makes me expect a bearish rebound from the resistance line above and a retest of the local target below at 1.620.
Disclosure: I am part of Trade Nation's Influencer program and receive a monthly fee for using their TradingView charts in my analysis.
✅LIKE AND COMMENT MY IDEAS✅
Techincalanalysis

XAU/USD Intraday Plan | Support & Resistance to WatchFollowing yesterday’s analysis, gold failed to hold momentum above $3,883 and sold off sharply, breaking back toward first support zone. Price tested the $3,828 level before rebounding, with the 50MA (pink) now acting as resistance.
A sustained break above $3,861/50MA could invite a retest of $3,883, with upside targets at $3,903 if momentum extends.
Failure to clear the $3,361/50MA risks renewed downside toward $3,828, with a deeper move opening secondary support zone. The 200MA (green) remains a key dynamic support if selling pressure escalates.
📌 Key levels to watch:
Resistance:
$3,861
$3,883
$3,903
$3,920
Support:
$3,842
$3,828
$3,796
$3,776
🔎 Fundamental Focus – Fri, Oct 3 (NFP Day)
Today is packed with high-impact US data:
🚩Non-Farm Payrolls (NFP),
🚩Average Hourly Earnings,
🚩Unemployment Rate,
🚩ISM Services PMI, plus several FOMC speeches.
⚠️ Reminder: US government data may be impacted by the shutdown, so releases could be delayed or revised.
High volatility and sharp swings expected.

LiamTrading – Gold Plan: Wide Range + US Politics Exert Pressure
Gold continues to fluctuate within a wide range as market sentiment is heavily influenced by news from the United States. On October 3rd, the US Senate is expected to vote again on the temporary budget bill. If it fails, the federal government could shut down, extending into the following week. This will undoubtedly have a strong impact on safe-haven flows, making gold increasingly sensitive to key technical resistance levels.
📊 Technical Analysis – H1 Chart
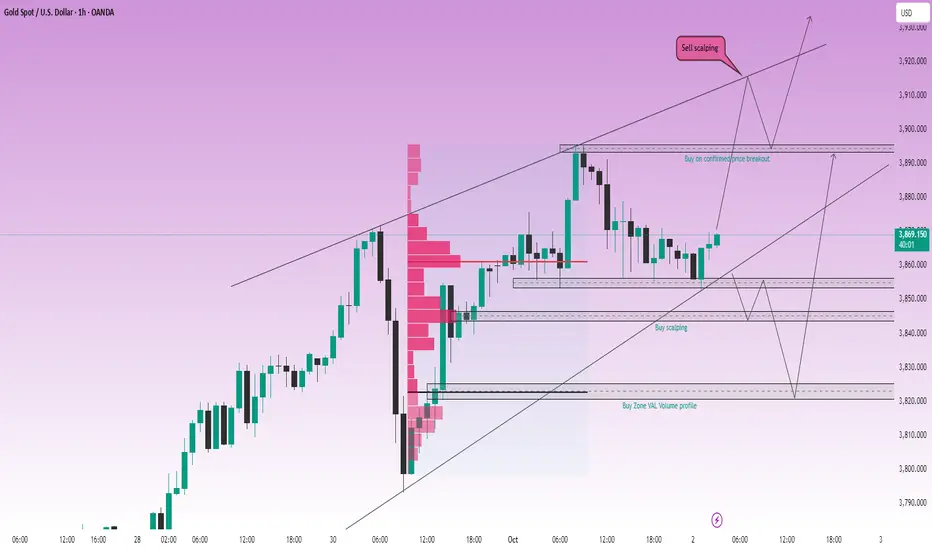
Gold is moving within a wide sideways structure, oscillating around strong resistance – support zones.
Fibonacci Resistance + Psychological level around 3878–3881 → suitable for short-term Sell scalping.
Confluence Support (Retest + Volume) around 3828–3830 → ideal zone to watch for Buy, expecting a recovery wave.
The major trend still leans towards an increase, however, in the short term, the market will experience many liquidity sweeps.
🎯 Trading Scenario
Sell (short-term – prioritize on M15):
Entry: 3878–3881
SL: 3886
TP: 3860 – 3855 – 3840 – 3822 – 3810
Buy (retest support + volume):
Entry: 3828–3830
SL: 3822
TP: 3845 – 3860 – 3877 – 3890
📌 Conclusion
Today's range is quite wide, suitable for scalping according to psychological resistance zones.
Short-term Sell at Fibonacci resistance levels.
Buy when price retests confluence support with volume.
Political news from the US will be a catalyst causing significant gold volatility, so maintaining disciplined capital management is essential.
👉 Stay closely tuned to the scenarios, I will update frequently as the market experiences new fluctuations.

XAUUSD – Prioritize Sell After Breaking Trendline
Hello Traders,
Gold has experienced a strong upward movement for several consecutive days, but now the market is showing significant reversal signals. The upward trendline on H4 has been broken, confirming a weakening buying momentum. In the medium term, the preferred scenario will be selling rather than continuing to chase buys.
Basic Context
The U.S. Treasury has just repurchased an additional $2 billion in bonds, bringing the total repurchase this week to $4.9 billion. This move indicates efforts to stabilize the bond market, but also reflects significant pressure on the USD and the U.S. financial situation.
In the short term, the injection of additional bond liquidity makes gold more unpredictable, and the trendline break at this time is an important warning signal.
Technical Perspective
Breaking the upward trendline → confirms a structural change.
MACD signals weakening, with buyers losing clear momentum.
The 3865 – 3868 zone is a beautiful resistance retest point to Sell.
If the price falls deeply, the support areas around 3830 – 3810 – 3790 will be the next targets.
Today's Trading Scenario
Sell (main priority):
Entry: 3865 – 3868
SL: 3875
TP: 3855 – 3832 – 3810 – 3790
Buy Scalping (counter-trend – high risk):
Entry: 3803 – 3805
SL: 3795
TP: 3822 – 3835 – 3850
Conclusion
Gold has broken the trendline, prioritizing Sell in the short and medium term.
News from the U.S. bond market further emphasizes instability risks, making counter-trend Buy moves only suitable for short-term Scalping.
Follow me for the earliest updates on scenarios as price paths change.

NDSN - 9 months HEADS & SHOULDERS══════════════════════════════
Since 2014, my markets approach is to spot
trading opportunities based solely on the
development of
CLASSICAL CHART PATTERNS
🤝Let’s learn and grow together 🤝
══════════════════════════════
Hello Traders ✌
After a careful consideration I came to the conclusion that:
- it is crucial to be quick in alerting you with all the opportunities I spot and often I don't post a good pattern because I don't have the opportunity to write down a proper didactical comment;
- since my parameters to identify a Classical Pattern and its scenario are very well defined, many of my comments were and would be redundant;
- the information that I think is important is very simple and can easily be understood just by looking at charts;
For these reasons and hoping to give you a better help, I decided to write comments only when something very specific or interesting shows up, otherwise all the information is shown on the chart.
Thank you all for your support
🔎🔎🔎 ALWAYS REMEMBER
"A pattern IS NOT a Pattern until the breakout is completed. Before that moment it is just a bunch of colorful candlesticks on a chart of your watchlist"
═════════════════════════════
⚠ DISCLAIMER ⚠
The content is The Art Of Charting's personal opinion and it is posted purely for educational purpose and therefore it must not be taken as a direct or indirect investing recommendations or advices. Any action taken upon these information is at your own risk.

LiamTrading – Intraday Trading Outlook LiamTrading – Intraday Trading Outlook
Looking at the global financial picture, we can see an extraordinary alignment:
Equities – All-Time High (ATH)
Housing Prices – ATH
Bitcoin – ATH
Gold – ATH
Money Supply – ATH
National Debt – ATH
CPI Inflation – averaging 4% annually since 2020, twice the Fed’s “target”
Federal Reserve – continuing to cut interest rates this month
It is clear that cheap money combined with persistent inflationary pressure is a powerful driver behind gold’s move into historic territory. In this context, looking for buying opportunities in line with the trend remains the more rational approach.
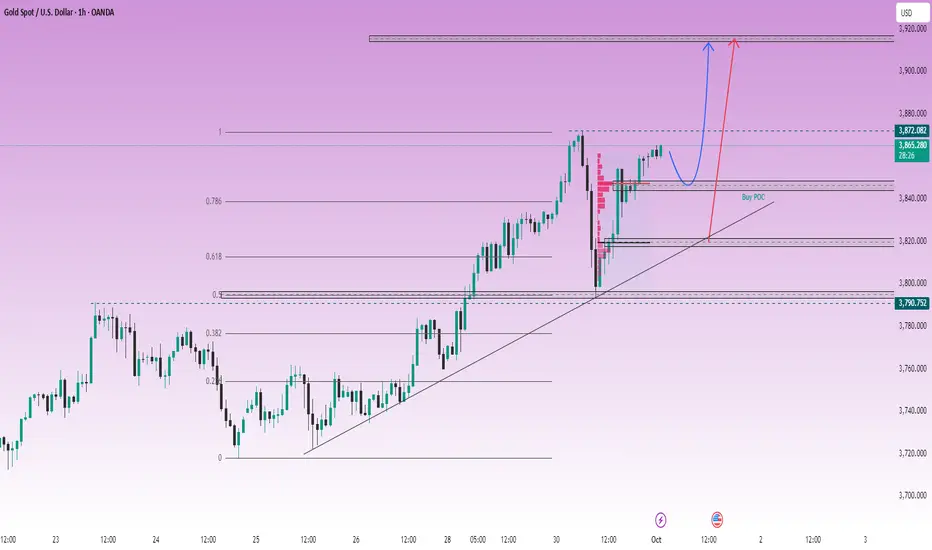
📊 Technical Analysis – H1 Chart
Gold is moving within a well-defined upward channel.
Volume Profile indicates the POC around 3840–3850, an important level for potential scalping buys.
The VAL aligns with the rising trendline near 3820–3822, providing strong confluence for medium-term buying.
A confirmed break above 3895 (new ATH) would support further trend-following buys.
Key resistance sits at 3913–3915, suitable for short-term scalping sells.
🎯 Trading Scenarios
Buy scalping: 3845 | SL 3839 | TP 3856 – 3870
Buy zone (main): 3820 – 3822 | SL 3816 | TP 3832 – 3845 – 3860 – 3875 – 3890
Sell scalping: 3915 – 3913 | SL 3920 | TP 3900 – 3885 – 3872 – 3860
Buy breakout: A confirmed move above 3895 → continue buying with targets open towards 3915+
📌 Conclusion
Gold remains in a strong uptrend, supported by both fundamental and technical factors. Short-term corrections are better viewed as opportunities to build on buy positions. That said, it is important to keep an eye on nearby resistance levels to optimise entries.
👉 This is my personal perspective on XAUUSD and not investment advice.
Follow me to stay up to date with daily gold scenarios 🔥
(XAU/USD) – Gold to reach $4,000/oz: Where is the best buy point1. Price Structure & Main Trend
On the H1 timeframe, gold still maintains a bullish structure with higher highs and higher lows.
After the Break of Structure (BoS), price retraced to test the Buy Zone around 3,862 and bounced back up.
Currently, price is trading above both EMA34 and EMA89, confirming that the uptrend remains dominant.
2. Key Zones
Buy Zone: 3,862 – 3,865. Short-term support, aligned with the previous BoS. If price holds above this zone, the bullish scenario is strengthened.
Order Block (OB) 1: 3,806 – 3,810. Next support zone if the Buy Zone is broken.
Order Block (OB) 2: 3,763 – 3,770. Deeper support, activated only in case of a strong correction.
Sell Scalping Zone (Fibo): around 3,912. A potential short-term resistance where profit-taking may occur.
Sell Zone / ATH: 3,933 – 3,935. Breaking above this area may lead gold to a new all-time high.
3. Trading Scenarios
Bullish (Main Scenario):
Look to buy at 3,862 – 3,865 if price retests.
SL: Below 3,850 (under Buy Zone and EMA89).
TP1: 3,912 (Sell Scalping Zone).
TP2: 3,933 – 3,935 (new ATH).
Bearish (Defensive Scenario):
If price breaks below Buy Zone and closes under 3,860, it may test OB 3,806 – 3,810.
In a worse case, if OB1 is also lost, short-term bullish momentum could weaken, pushing gold to OB 3,763 – 3,770.
4. Summary
Gold on H1 maintains strong bullish momentum after breaking structure. The optimal plan is to prioritize buying at key support, manage risk tightly, and gradually take profit at resistance zones. If price surpasses 3,933, gold may enter a new all-time high phase.

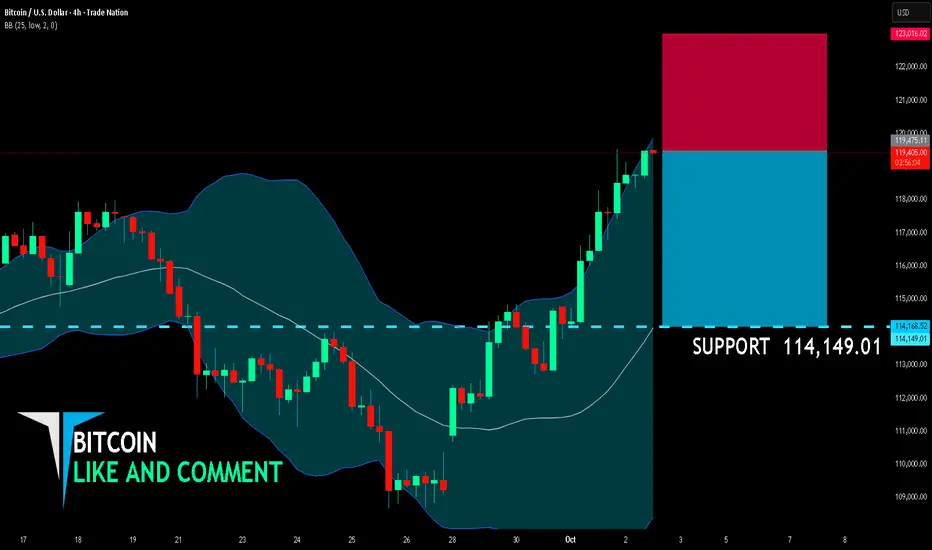
BITCOIN BEARS ARE STRONG HERE|SHORT
BITCOIN SIGNAL
Trade Direction: short
Entry Level: 119,475.11
Target Level: 114,149.01
Stop Loss: 123,016.02
RISK PROFILE
Risk level: medium
Suggested risk: 1%
Timeframe: 4h
Disclosure: I am part of Trade Nation's Influencer program and receive a monthly fee for using their TradingView charts in my analysis.
✅LIKE AND COMMENT MY IDEAS✅
USD/CAD SHORT FROM RESISTANCE
USD/CAD SIGNAL
Trade Direction: short
Entry Level: 1.395
Target Level: 1.387
Stop Loss: 1.400
RISK PROFILE
Risk level: medium
Suggested risk: 1%
Timeframe: 6h
Disclosure: I am part of Trade Nation's Influencer program and receive a monthly fee for using their TradingView charts in my analysis.
✅LIKE AND COMMENT MY IDEAS✅

USD/CHF BEARS WILL DOMINATE THE MARKET|SHORT
Hello, Friends!
USD/CHF pair is in the downtrend because previous week’s candle is red, while the price is clearly rising on the 1D timeframe. And after the retest of the resistance line above I believe we will see a move down towards the target below at 0.784 because the pair is overbought due to its proximity to the upper BB band and a bearish correction is likely.
Disclosure: I am part of Trade Nation's Influencer program and receive a monthly fee for using their TradingView charts in my analysis.
✅LIKE AND COMMENT MY IDEAS✅

AUD/USD SENDS CLEAR BEARISH SIGNALS|SHORT
Hello, Friends!
AUD/USD pair is trading in a local downtrend which know by looking at the previous 1W candle which is red. On the 9H timeframe the pair is going up. The pair is overbought because the price is close to the upper band of the BB indicator. So we are looking to sell the pair with the upper BB line acting as resistance. The next target is 0.652 area.
Disclosure: I am part of Trade Nation's Influencer program and receive a monthly fee for using their TradingView charts in my analysis.
✅LIKE AND COMMENT MY IDEAS✅

CADJPY Will Go Lower From Resistance! Sell!
Here is our detailed technical review for CADJPY.
Time Frame: 1D
Current Trend: Bearish
Sentiment: Overbought (based on 7-period RSI)
Forecast: Bearish
The market is testing a major horizontal structure 107.266.
Taking into consideration the structure & trend analysis, I believe that the market will reach 106.211 level soon.
P.S
Please, note that an oversold/overbought condition can last for a long time, and therefore being oversold/overbought doesn't mean a price rally will come soon, or at all.
Like and subscribe and comment my ideas if you enjoy them!

XAU/USD Intraday Plan | Support & Resistance to WatchGold failed to hold above $3,883 yesterday, triggering a pullback into the $3,861 support where the 50MA is currently holding as dynamic support. Price is now consolidating just above this level.
If bullish momentum continues, a retest of $3,883 is likely, with a breakout opening the path toward $3,903.
A break below $3,861 would expose the $3,842–$3,828 supports, with risk of a deeper pullback into the First Reaction Zone and a possible 200MA test.
📌 Key Levels to Watch
Resistance:
$3,883
$3,903
$3,920
Support:
$3,861
$3,842
$3,828
$3,812–$3,796 (First Reaction Zone / MA200 confluence)
🔎 Fundamental Focus – Thu, Oct 2
The spotlight today is on US Unemployment Claims.
👉 With NFP tomorrow, traders should expect positioning swings and volatility around today’s data.

XAUUSD – Holding the Primary Uptrend (BUY Bias)
Hello traders,
On the H4 timeframe, gold continues to demonstrate a sustained upward trajectory. After testing the upper trendline, price rebounded and is now consolidating around the 386x region. This suggests the market is in an accumulation phase, awaiting key news.
Fundamental Context
Tomorrow’s release of Nonfarm Payrolls (NFP) data is expected to be a major driver of volatility in gold.
Meanwhile, the uncertainty surrounding a potential US Government shutdown adds to macroeconomic instability, reinforcing gold’s role as a safe-haven asset.
At present, there is little justification for a decline in gold, especially as broader markets are also breaking higher.
Technical Analysis
Price remains within the ascending channel on H4, with buyers still in control.
The MACD indicator is above the zero line, showing no significant weakness.
Price is likely to consolidate within the 3860 – 3870 band before any strong move triggered by news.
Trading Plan
Buy Setup (priority – trend aligned)
Entry: 3829 – 3832
SL: 3825
TP: 3845 – 3862 – 3877 – 3890
Sell Scalping (counter-trend, high risk)
Entry: 3927 – 3930
SL: 3934
TP: 3915 – 3900 – 3882 – 3865
Note: Sell trades should be treated only as short-term scalps, as the dominant bias remains bullish.
Conclusion
Gold continues to respect its bullish structure, with no clear signs of weakness. Against the backdrop of political uncertainty and the forthcoming NFP release, the priority remains buying from favourable support zones. Any sell positions should be viewed purely as short-term reactions.
👉 Follow me for timely updates whenever price structure shifts.

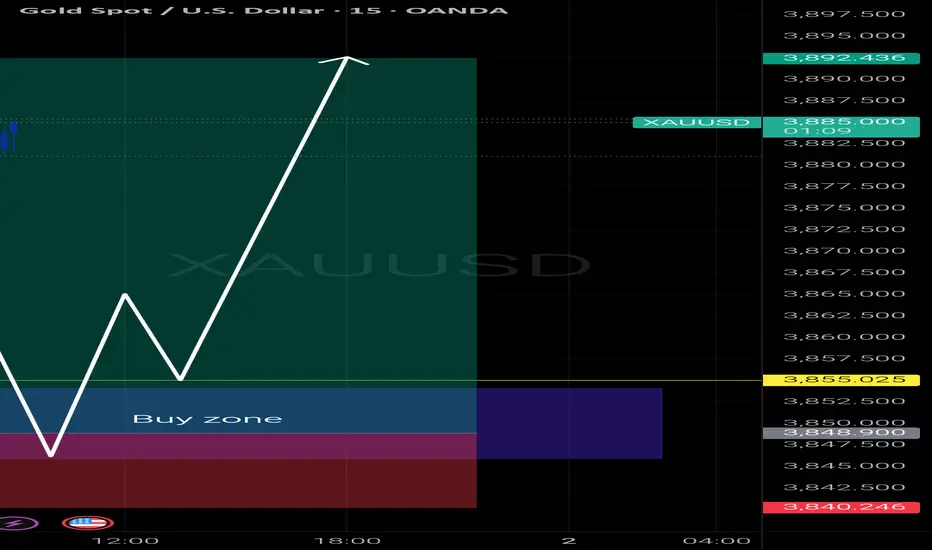
Gold Buy Setup – High Probability Reversal from Key Zone
Price tapped into a strong demand zone near 3855, showing signs of a bullish reversal. Clean structure and potential for upside. Watch closely for confirmation and manage risk wisely.
SILVER BEARS ARE GAINING STRENGTH|SHORT
SILVER SIGNAL
Trade Direction: short
Entry Level: 4,733.3
Target Level: 4,466.5
Stop Loss: 4,911.7
RISK PROFILE
Risk level: medium
Suggested risk: 1%
Timeframe: 9h
Disclosure: I am part of Trade Nation's Influencer program and receive a monthly fee for using their TradingView charts in my analysis.
✅LIKE AND COMMENT MY IDEAS✅

NZD/USD SELLERS WILL DOMINATE THE MARKET|SHORT
NZD/USD SIGNAL
Trade Direction: short
Entry Level: 0.581
Target Level: 0.574
Stop Loss: 0.585
RISK PROFILE
Risk level: medium
Suggested risk: 1%
Timeframe: 5h
Disclosure: I am part of Trade Nation's Influencer program and receive a monthly fee for using their TradingView charts in my analysis.
✅LIKE AND COMMENT MY IDEAS✅

GBP/USD BEARISH BIAS RIGHT NOW| SHORT
Hello, Friends!
We are targeting the 1.340 level area with our short trade on GBP/USD which is based on the fact that the pair is overbought on the BB band scale and is also approaching a resistance line above thus going us a good entry option.
Disclosure: I am part of Trade Nation's Influencer program and receive a monthly fee for using their TradingView charts in my analysis.
✅LIKE AND COMMENT MY IDEAS✅

XAU/USD – 01/10 | US Government Shutdown Confirmed | Gold awaits🔎 Context & News
US Politics : The US government officially shut down after the Senate failed to pass the federal funding bill. A major political risk catalyst, triggering safe-haven flows into Gold.
FED : Probability of a -25bps rate cut in October rises to 96.2% → almost certain.
Key Events Today (ET / UTC) :
• ADP Employment Change: 08:15 ET / 12:15 UTC
• ISM Manufacturing PMI: 10:00 ET / 14:00 UTC
→ Both will be crucial data points that may shake Dollar and Gold.
📌 Summary : US politics + FED easing = Gold remains supported, but ADP & ISM tonight could spark strong volatility in the US session.
📈 Technical Analysis (H1)
Main Trend : Bullish after multiple BoS.
EMA : EMA 34 > EMA 89 → bullish momentum intact.
Resistance :
3,897 – 3,907 (Sell scalp – Fibo 0.5–0.618).
3,920 – 3,921 (Liquidity / ATH test).
Support :
3,872 – 3,876 (old high retest).
3,833 – 3,841 (OB zone).
3,814 – 3,822 (deep Support Zone – losing this shifts bias).
🎯 Trade Plan
✅ Buy (trend priority)
Buy Zone 1 : 3,872 – 3,876
• SL: 3,869
• TP: 3,897 → 3,907 → 3,920
Buy Zone 2 (OB) : 3,833 – 3,841
• SL: 3,826
• TP: 3,872 → 3,897 → 3,907
Buy Zone 3 (Deep Support) : 3,814 – 3,822
• SL: 3,808
• TP: 3,841 → 3,872 → 3,897
⚡ Sell (short scalps only – lower RR)
Sell Zone 1 : 3,897 – 3,907
• SL: 3,912
• TP: 3,885 → 3,876 → 3,841
Sell Zone 2 (ATH sweep) : 3,920 – 3,921
• SL: 3,925
• TP: 3,907 → 3,885 → 3,876
📝 Conclusion
Gold remains strongly supported by the US government shutdown + FED rate cut expectations.
Strategy today: Prioritize Buy at support; Sell only for short scalps around 3,907 – 3,921.
⚠️ Watch out: ADP & ISM tonight may trigger unexpected volatility → manage risk carefully and move SL to BE after TP1.
📢 If you find this Captain’s Log useful, don’t forget to Follow Captain Vincent ⚓ for the latest updates.
💬 What do you think, crew? Will Gold break ATH 3,920 right after ADP & ISM tonight?

XAU/USD Intraday Plan | Support & Resistance to WatchGold is recovering from yesterday’s sharp pullback and is currently trending just above the $3,861 level. A sustained break above this area could see price push toward the $3,883 resistance, with a possible extension to $3,903.
Failure to hold above $3,883 could trigger another pullback into lower support zones.
📌 Key levels to watch:
Resistance:
$3,883
$3,903
$3,920
Support:
$3,861
$3,842
$3,828
$3,796
$3,753
$3,734
🔎 Fundamental Focus – Wed, Oct 1
Key US data on deck today:
🚩ADP Non-Farm Employment
🚩ISM Manufacturing PMI
🔶ISM Manufacturing Prices
👉 Expect high volatility and swings.

XAU/USD Trade Setup – Bullish Continuation in Play?Gold (XAU/USD) has recently shown a strong bullish recovery after a sharp drop from the $3,870 area. The price is currently consolidating near the $3,843 zone, forming a potential bullish continuation pattern.
We’ve now seen:
A V-shaped reversal off the $3,805 support zone
Strong bullish candles breaking short-term resistance
A potential higher low formation, signaling buying interest
🧠 Trade Idea:
🟢 Long Position Setup
Entry: Around $3,840.80
Stop Loss: $3,830.48 (below the recent low)
Targets:
🎯 TP1: $3,854.94
🎯 TP2: $3,861.25
🎯 TP3: $3,871.18 (extended)
This gives a solid risk-to-reward ratio of ~2:1 or better, depending on your target level.
🔍 Technical Highlights:
Key resistance levels: $3,855, $3,861, $3,871
Key support level: $3,830
Candlesticks show strong bullish momentum with little selling pressure during pullbacks.
Price is trading above the breakout zone, indicating buyers are in control.
⚠️ Risk Management:
As always, wait for confirmation near the entry zone. Be cautious of false breakouts, especially around the $3,840–$3,845 region. Stick to your stop loss and take profit levels.

LiamTrading – Follow the Buy trend, target ATH 3915
The gold market continues to show the strength of the upward trend. After yesterday's shakeout, we witnessed a very clear Long Squeeze: all buying forces were forced to exit, but immediately after, the price quickly rebounded. This is the hallmark of a strong trend – the more it shakes out, the more momentum it creates for a new peak.
Today's perspective:
Continue to follow Buy, do not SELL against the trend.
The Buy position from 3797 is still held, if the price returns to retest, we will continue to add orders.
Prioritize observing the POC of the Volume Profile to place Buy orders, in case the price adjusts deeper, the VAL area coinciding with the rising trendline will be an extremely safe buying point.
Trading scenario
Buy 3847–3844, SL 3840, TP 3868 – 3880 – 3900 – 3915
Buy 3821–3819, SL 3814, TP 3835 – 3850 – 3868 – open
In summary: The upward trend remains extremely strong, the short-term target is ATH 3915. Just follow the trend, prioritize Buy to maximize profits.
This is my personal view on XAUUSD. Please follow the scenario and follow me to get the earliest updates.
NEXT: big move in the makingNEXT: recent trend change from down ward to up in combination with increased volumes and positive corporate developments - closest target at $0.93C.
*** Graphite - as every mining corporation/ governments are chasing new graphite projects and and industrial corporations are trying to secure enough graphite "ex-china" to continue their normal operations - NEXT already is producing and recently got its first graphite supply contract, also NEXT has capacity to rapidly increase production and get more contracts.
*** Graphite is needed almost everywhere - from Nuclear plants to tanks, plains and electric cars and with 700%+ tariffs on Chinese graphite are coming by Dec/2025 - most of the western world will be under supplied by a minimum of 30% for at least next 5 yrs+. Perfect Cash Storm for NEXT is in the making.
Closest price test for NEXT is $0.93 (probably will break it with ease) - 2nd stop - $1.78 - also possibility of FOMO run in Dec/2025(once tariffs finalized) that could drive NEXT to test $4.85 by end of FEB/2026.
