AUDNZD Reached Strong ResistancePrice on AUDNZD has been rallying aggressively, but the move now looks overextended as it drives straight into a major resistance zone, an area where sellers have stepped in before.
If buyers fail to break through and price rejects here, that’s the signal sellers are defending strongly, meaning a high probability reversal to the downside is to come next.
Techincalanalysis

USOIL BULLS ARE STRONG HERE|LONG
USOIL SIGNAL
Trade Direction: long
Entry Level: 62.93
Target Level: 64.18
Stop Loss: 62.10
RISK PROFILE
Risk level: medium
Suggested risk: 1%
Timeframe: 4h
Disclosure: I am part of Trade Nation's Influencer program and receive a monthly fee for using their TradingView charts in my analysis.
✅LIKE AND COMMENT MY IDEAS✅

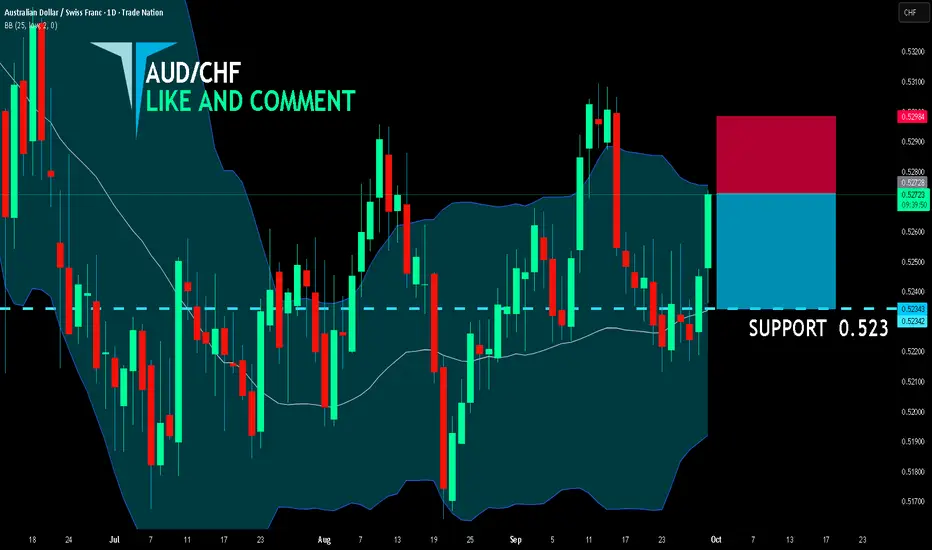
AUD/CHF SHORT FROM RESISTANCE
AUD/CHF SIGNAL
Trade Direction: short
Entry Level: 0.527
Target Level: 0.523
Stop Loss: 0.529
RISK PROFILE
Risk level: medium
Suggested risk: 1%
Timeframe: 1D
Disclosure: I am part of Trade Nation's Influencer program and receive a monthly fee for using their TradingView charts in my analysis.
✅LIKE AND COMMENT MY IDEAS✅
NZD/CHF BULLS WILL DOMINATE THE MARKET|LONG
Hello, Friends!
The BB lower band is nearby so NZD-CHF is in the oversold territory. Thus, despite the downtrend on the 1W timeframe I think that we will see a bullish reaction from the support line below and a move up towards the target at around 0.467.
Disclosure: I am part of Trade Nation's Influencer program and receive a monthly fee for using their TradingView charts in my analysis.
✅LIKE AND COMMENT MY IDEAS✅

EUR/AUD BEARS ARE STRONG HERE|SHORT
Hello, Friends!
Bearish trend on EUR/AUD, defined by the red colour of the last week candle combined with the fact the pair is overbought based on the BB upper band proximity, makes me expect a bearish rebound from the resistance line above and a retest of the local target below at 1.778.
Disclosure: I am part of Trade Nation's Influencer program and receive a monthly fee for using their TradingView charts in my analysis.
✅LIKE AND COMMENT MY IDEAS✅

BITCOIN BUYERS WILL DOMINATE THE MARKET|LONG
BITCOIN SIGNAL
Trade Direction: long
Entry Level: 109,018.58
Target Level: 113,324.76
Stop Loss: 106,141.68
RISK PROFILE
Risk level: medium
Suggested risk: 1%
Timeframe: 9h
Disclosure: I am part of Trade Nation's Influencer program and receive a monthly fee for using their TradingView charts in my analysis.
✅LIKE AND COMMENT MY IDEAS✅

GBP/AUD BEARS ARE GAINING STRENGTH|SHORT
Hello, Friends!
GBP/AUD is making a bullish rebound on the 1H TF and is nearing the resistance line above while we are generally bearish biased on the pair due to our previous 1W candle analysis, thus making a trend-following short a good option for us with the target being the 2.043 level.
Disclosure: I am part of Trade Nation's Influencer program and receive a monthly fee for using their TradingView charts in my analysis.
✅LIKE AND COMMENT MY IDEAS✅

USOIL BEARS WILL DOMINATE THE MARKET|SHORT
USOIL SIGNAL
Trade Direction: short
Entry Level: 65.18
Target Level: 63.42
Stop Loss: 66.35
RISK PROFILE
Risk level: medium
Suggested risk: 1%
Timeframe: 9h
Disclosure: I am part of Trade Nation's Influencer program and receive a monthly fee for using their TradingView charts in my analysis.
✅LIKE AND COMMENT MY IDEAS✅

#$XAUUAS Uptrend Hello traders friends
My forecast on #XAUUSD
I think continue to wait for gold buying power to 3900 and creating new ATH
Best regards, Honeytrading

ETHUSD ANALYLTICAL IDEA, FOR 30 SEP, 2025.After the quick fall below $4000, in value, the second in command on the coin market sharply went back to its original position and currently trades around $4100, but the overall direction is bullish as considered the altcoin season. But the question is, will it hold? Or continue pushing above or below well, for now, we can only sit tight on our hands, as my Bias remains bearish for the short term, and I look forward to taking sell trade positions as the price continues to push further in that direction.
As usual, my calls or analysis are based on what we see, the current Bias, and from a probability standpoint, meaning that this projection may be or may not be validated, so tread carefully, and as usual, this is not financial advice, trade responsibly.

GBPJPY 2H, TRADE IDEA FOR 30, SEPT 2025.Price successfully broke through the previous day's low and also swept the asian low range and structure, which forms my BIAS for the day bearish as price currently broke a structure, will it hold? as price moves further down to find a next balance.
As usual, my calls or analysis are based on what we see, the current Bias, and from a probability standpoint, meaning that this projection may be or may not be validated, so tread carefully, and as usual, this is not financial advice, trade responsibly

Gold 09/30 |Safe-haven flows surge | Gold sails toward new highs🟡 XAU/USD – 30/09 | Captain Vincent ⚓
🔎 Captain’s Log – Context & News
US Politics : Meeting between Trump and bipartisan leaders ended without agreement → growing risk of a US government shutdown by Wednesday.
Conflict : Democrats demand concessions, Republicans fiercely oppose → wide gap remains, both sides blaming each other.
Market : Investors watch JOLTS data and speeches from 3 FED members, but political risks are the strongest catalyst for Gold.
Trend : Safe-haven flows keep pouring into Gold → increasing likelihood of testing new ATH.
⏩ Captain’s Summary : US political seas are stormy, Gold becomes the fortress of safety. The voyage toward ATH is widening.
📈 Captain’s Chart – Technical Analysis (H1)
EMA : EMA 34 (yellow) > EMA 89 (red) → bullish trend clearly dominant.
Golden Harbor (Support / Buy Zone)
Near FVG: 3,856
FVG Scalping: 3,842
Big Volume Dock: 3,827
Storm Breaker (Resistance / Sell Zone)
ATH test: 3,916 – 3,917
Market Structure : Gold broke out strongly, now trading around 3,870. Main trend remains bullish, with 3,842 – 3,827 as key anchor zones.
🎯 Captain’s Map – Trade Plan
✅ Buy (main priority)
Buy Zone 1 – Scalping FVG
Entry: 3,842 – 3,844
SL: 3,835
TP: 3,846 – 3,849 – 3,852 – 3,859 – 3,8xx
Buy Zone 2 – Big Volume
Entry: 3,827 – 3,824
SL: 3,815
TP: 3,870 – 3,899 – 3,916
⚡ Sell (short scalp – high risk)
Sell Zone – ATH test
Entry: 3,917 – 3,920
SL: 3,925
TP: 3,899 – 3,870 – 3,856
⚓ Captain’s Note
“The Golden sails are filled by safe-haven winds, pushing the ship close to ATH. Golden Harbor 🏝️ (3,842 – 3,827) is the ideal dock for sailors to position Buys. Storm Breaker 🌊 (3,916 – 3,920) may unleash violent waves, suitable only for short Quick Boarding 🚤 scalps. If the political storm from Washington breaks out, Gold’s voyage could surpass the peak and expand its horizon.”
📢 If you find the Captain’s Log useful, don’t forget to Follow for the earliest updates.
💬 What’s your view, crew? Will Gold conquer ATH around 3,917 this week?

XAUUSD – Will ATH Diminish Gold's Value?Hello Traders,
Gold once accounted for up to 21% of total global assets, but now this figure is only about 5%. Two perspectives are clear:
Gold is gradually losing its relative importance in the financial system.
The total value of global assets has surged (expanding the denominator), reducing gold's proportion, while its absolute value still plays a crucial role.
Technical Analysis
In today's Asian session, gold continues to set higher price marks, indicating that the upward momentum remains very strong.
The ascending channel on H1 has reached the upper boundary, showing slight hesitation, but the main trend is still upward.
The H1 and H4 frames maintain strong buying power, with market sentiment leaning heavily towards buyers, ready to push prices to higher levels.
According to Elliott Wave, the price is currently in wave 5 (the market psychology wave). The current task is to observe the reaction when this wave completes, to prepare for the ABC correction cycle.
Regarding Fibonacci, the next important resistance area is at 3880, where a bearish reaction may occur.
Trading Scenario
Sell (at Fibo resistance 3880):
Entry: 3880
SL: 3886
TP: 3866 – 3850 – 3835
Buy (trend-following priority):
Entry: 3813 – 3816
SL: 3809
TP: 3828 – 3843 – 3860 – 3878
👉 Note: Smaller frames H1 – M15 will provide additional confirmation signals to optimize entry points.
Conclusion
The upward trend of gold is still prioritized, wave 5 has not ended, and the scenario towards 4000 – 4050 is entirely plausible.
Short-term selling at strong resistance areas can be considered, but risk management must be tight.
Traders need to closely monitor support – resistance areas in smaller frames to maximize profits.
Follow me for the fastest updates when the price structure changes and to further discuss scenarios in the community.

GOLD BEARS ARE GAINING STRENGTH|SHORT
GOLD SIGNAL
Trade Direction: short
Entry Level: 3,824.27
Target Level: 3,583.49
Stop Loss: 3,983.30
RISK PROFILE
Risk level: medium
Suggested risk: 1%
Timeframe: 1D
Disclosure: I am part of Trade Nation's Influencer program and receive a monthly fee for using their TradingView charts in my analysis.
✅LIKE AND COMMENT MY IDEAS✅

AUD/CAD SELLERS WILL DOMINATE THE MARKET|SHORT
AUD/CAD SIGNAL
Trade Direction: short
Entry Level: 0.913
Target Level: 0.906
Stop Loss: 0.918
RISK PROFILE
Risk level: medium
Suggested risk: 1%
Timeframe: 9h
Disclosure: I am part of Trade Nation's Influencer program and receive a monthly fee for using their TradingView charts in my analysis.
✅LIKE AND COMMENT MY IDEAS✅

CHF/JPY BULLISH BIAS RIGHT NOW| LONG
Hello, Friends!
CHF/JPY is trending up which is evident from the green colour of the previous weekly candle. However, the price has locally plunged into the oversold territory. Which can be told from its proximity to the BB lower band. Which presents a classical trend following opportunity for a long trade from the support line below towards the supply level of 187.473.
Disclosure: I am part of Trade Nation's Influencer program and receive a monthly fee for using their TradingView charts in my analysis.
✅LIKE AND COMMENT MY IDEAS✅

NZD/JPY BEST PLACE TO BUY FROM|LONG
Hello, Friends!
NZD/JPY pair is in the downtrend because previous week’s candle is red, while the price is clearly falling on the 2H timeframe. And after the retest of the support line below I believe we will see a move up towards the target above at 86.223 because the pair oversold due to its proximity to the lower BB band and a bullish correction is likely.
Disclosure: I am part of Trade Nation's Influencer program and receive a monthly fee for using their TradingView charts in my analysis.
✅LIKE AND COMMENT MY IDEAS✅

GBP/JPY SHORT FROM RESISTANCE
Hello, Friends!
GBP/JPY pair is trading in a local uptrend which we know by looking at the previous 1W candle which is green. On the 1H timeframe the pair is going up too. The pair is overbought because the price is close to the upper band of the BB indicator. So we are looking to sell the pair with the upper BB line acting as resistance. The next target is 200.003 area.
Disclosure: I am part of Trade Nation's Influencer program and receive a monthly fee for using their TradingView charts in my analysis.
✅LIKE AND COMMENT MY IDEAS✅

Webull Corporation — demand confirmation and growth potentialTechnical analysis: On the 4H chart, Webull Corporation (ticker BULL) is showing signs of a breakout from the accumulation channel. After a decline, the price stabilized in the 12.50–15.50 range, where demand confirmation is visible. The current level of 15.39 serves as a starting point for growth. The nearest upside targets are 17.40 and 20.40, with extended potential toward 25.30 and 41.00 if resistance is broken. Key support is located at 13.30–12.50, and losing this area may bring back bearish momentum.
Webull Corporation is a US-based fintech company offering online trading and investment services. Its platform provides retail investors with access to stocks, ETFs, options, and cryptocurrencies. Competing with Robinhood, Webull stands out thanks to advanced charts, analytics, and low fees. The growing popularity of online brokers and an expanding user base support the company’s long-term outlook.
As long as the accumulation structure holds and demand remains strong, the bullish scenario stays in focus. For long-term investors, the stock may be considered a buy-and-hold opportunity, supported by fintech sector growth and rising competition among online brokers.

LiamTrading–Gold: Wave 5 isn't over yet, awaiting ABC correctionGold: Wave 5 isn't over yet, awaiting ABC correction
According to the Elliott Wave perspective, gold is currently in wave 5 and has not shown any clear reversal signals. Once wave 5 completes, a reasonable scenario would be entering the ABC correction phase.
Technical Analysis
The current price range remains in an uptrend, supported by the medium-term trendline.
Key resistance – support levels are identified based on Fibonacci, Volume Profile, and strong psychological thresholds.
RSI indicates that gold is approaching the overbought zone, thus short-term Sell orders (scalping) around the peak area could be advantageous.
Trading Plan Reference
Sell: 3840 – 3842, SL 3846. This is a strong resistance area, prioritize scalping if the downward reaction lacks momentum.
Buy: 3783 – 3785, SL 3779, TP 3800 – 3818 – 3838.
Large liquidity Buy: 3740, SL 3733, expecting a strong reaction from this area due to previous accumulation volume.
Important Notes
Early in the week, there are often numerous political – economic news causing noise, which could unexpectedly push gold higher.
Resistance areas 3840–3850 are strong psychological levels, observe the reaction before making decisions.
For short-term trades, stick closely to the plan, while flexibly adjusting when price paths change to maintain an advantage.
In summary, wave 5 is still developing, and trading opportunities mainly focus on key resistance – support areas. Traders need to manage risk well, patiently wait for confirmation, and remain flexible to adapt to fluctuations.
The DXY index fell to around 97.95 on Monday, extending its decline into the second session as the risk of a U.S. government shutdown weakens market sentiment and investors await a series of important economic data releases this week.
Wishing you successful trading, follow me and the trading community!
GBPCAD Gears up to Break Higher?Price has been steadily climbing while respecting the ascending trendline, showing that buyers are consistently stepping in. Sellers have been defending the horizontal resistance zone, but each push lower is weaker as buyers continue to build pressure from below.
If buyers finally break through this resistance with conviction, that becomes the signal, expecting continuation of the uptrend as sellers get squeezed and price drives into a new bullish leg higher.

Gold awaits PCE | EMA squeeze, big waves aheadXAU/USD – 09/26 | Captain Vincent ⚓
🔎 Captain’s Log – Context & News
Trump : Announced a 100% tariff on branded drugs if not produced in the US → escalating trade tensions.
PCE tonight : The FED’s most important inflation gauge, key to shaping October rate cut expectations (current probability 91.09%).
The market is in “hold breath” mode, awaiting the PCE spark to decide the next direction.
⏩ Captain’s Summary : Gold is squeezed between two winds – short-term EMA pressure and major expectations from PCE.
📈 Captain’s Chart – Technical Analysis
EMA : EMA 34 (yellow) remains below EMA 89 (red) → short-term bearish pressure persists, but narrowing gap signals big volatility ahead.
Golden Harbor (Support / Buy Zone)
3,738 – 3,730
3,718
3,687
3,651
Storm Breaker (Resistance / Sell Zone)
3,755 – 3,773
🎯 Captain’s Map – Trade Plan
⚡ Sell (scalp at resistance)
Entry: 3,773 – 3,776
SL: 3,783
TP: 3,755 – 3,745 – 3,734
✅ Buy (trend-follow priority)
Buy Zone 1 (Scalping)
Entry: 3,72x – 3,718
SL: 3,710
TP: 3,750 – 3,769 – 3,776
Buy Zone 2 (Deeper OB)
Entry: 3,685 – 3,683
SL: 3,675
TP: 3,690 – 3,695 – 3,700 – 3,705 – 3,7xx
⚓ Captain’s Note
“The Golden sails are being squeezed between EMA 34 & 89. Golden Harbor 🏝️ (3,734 – 3,683) remains the safe dock for sailors to await the big wave. Storm Breaker 🌊 (3,773 – 3,776) is raising fierce waves, only suitable for short Quick Boarding 🚤 scalps. Tonight’s PCE will be the decisive wind – either pushing the ship beyond 3,78x or forcing it back to retest 3,72x.”
📢 If you find Captain’s Log useful, don’t forget to Follow for the latest updates.
💬 What do you think? Will Gold break through 3,78x or retest 3,72x first?

Market Weekly Wrap – Nifty & S&P 500 AnalysisNifty had a tough week, closing at 24654, down 673 points (-2.7%) from last week’s close. This was exactly in line with the downtrend warning I’ve been sharing over the past 3-4 weeks.
Key Highlights:
Weekly Range: High 25331 – Low 24629
Two-Week Correction: Down 3.15% from the recent high of 25448
Key Support Levels: 24474 / 24500 – watch closely!
If Nifty holds 24474/24500, we could see a short-term bounce of 1–2% toward 24950/25000.
But below 24300, brace for a deeper correction — Nifty could retest 23185 support levels.
Investor Tip:
The old saying still applies: "Be greedy when others are fearful."
This is a great time to start deploying capital — either by picking fundamentally strong stocks or through SIP/MF/ETF routes. If the market dips further, you’ll get opportunities to average your positions at better prices.
Sector to Watch Next Week: METALS — this sector looks strong and can outperform if market sentiment turns positive.
My Nifty Range for Next Week: 25050 – 24250
A breakout or breakdown beyond this range could trigger fast, directional moves.
US Markets – S&P 500 Update:
S&P 500 closed at 6643, down just 20 points, holding strong near its key Fibonacci support at 6568.
Upside Levels: Needs to sustain above 6689 for targets at 6780 / 6930 / 6959
Downside Risk: Below 6568, watch for 6502 / 6454 / 6376
Pro Tip: Keep a trailing stop-loss (SL) at 6524 to lock in profits
📌 Key Takeaways:
✅ Market correction was expected – use this opportunity wisely
✅ Watch 24474 support for potential bounce
✅ Metal sector could lead gains next week
✅ S&P 500 holding key support, but keep SLs in place
