Momentum building… Canara Bank in the spotlightCanara Bank (CANBK) Technical View
Canara Bank is currently trading within a well-defined parallel channel and has recently bounced strongly from its demand zone near 100–105.
At the same time, the stock is also moving inside a falling channel pattern, which provides important reference levels:
Support is placed around 105–107
Resistance is seen near 115 and 122
Importantly, the stock is sustaining above its daily, weekly, and monthly pivot levels, signaling strong upside potential. In addition, the RSI is holding above 50, which indicates momentum is building and a strong move could emerge at any time.
If the stock manages to hold the support levels, there is a strong possibility of witnessing higher prices in Canara Bank in the coming sessions.
Thank you.
Techincalanalysis

BITCOIN BULLISH BIAS RIGHT NOW| LONG
BITCOIN SIGNAL
Trade Direction: long
Entry Level: 111,368.88
Target Level: 119,727.44
Stop Loss: 105,796.50
RISK PROFILE
Risk level: medium
Suggested risk: 1%
Timeframe: 1D
Disclosure: I am part of Trade Nation's Influencer program and receive a monthly fee for using their TradingView charts in my analysis.
✅LIKE AND COMMENT MY IDEAS✅

AUD/USD BEST PLACE TO SELL FROM|SHORT
AUD/USD SIGNAL
Trade Direction: short
Entry Level: 0.652
Target Level: 0.649
Stop Loss: 0.655
RISK PROFILE
Risk level: medium
Suggested risk: 1%
Timeframe: 1h
Disclosure: I am part of Trade Nation's Influencer program and receive a monthly fee for using their TradingView charts in my analysis.
✅LIKE AND COMMENT MY IDEAS✅

NZD/USD BEARS ARE STRONG HERE|SHORT
Hello, Friends!
Bearish trend on NZD/USD, defined by the red colour of the last week candle combined with the fact the pair is overbought based on the BB upper band proximity, makes me expect a bearish rebound from the resistance line above and a retest of the local target below at 0.584.
Disclosure: I am part of Trade Nation's Influencer program and receive a monthly fee for using their TradingView charts in my analysis.
✅LIKE AND COMMENT MY IDEAS✅

GBP/USD SHORT FROM RESISTANCE
Hello, Friends!
GBP/USD is trending down which is clear from the red colour of the previous weekly candle. However, the price has locally surged into the overbought territory. Which can be told from its proximity to the BB upper band. Which presents a beautiful trend following opportunity for a short trade from the resistance line above towards the demand level of 1.337.
Disclosure: I am part of Trade Nation's Influencer program and receive a monthly fee for using their TradingView charts in my analysis.
✅LIKE AND COMMENT MY IDEAS✅

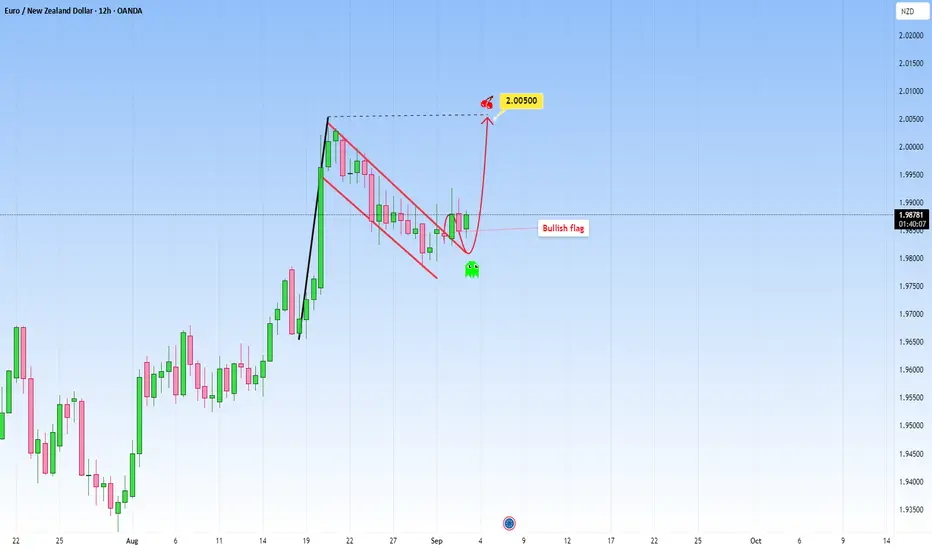
EURNZD: Rose steadily and created a Bullish FlagEURNZD looks quite interesting at the moment. Price rose to the upside steadily and now seems to have created a well known pattern: a bullish flag.
My expectation is for the price to continue, but first I would wait for a full strong candle to confirm the signal. I would target 2.00500.
If, on the other hand, price will decline below the flag, that would invalidate the continuation, and we can expect a short-term pullback incoming.
What do you think?
XAUUSD – Sell Strategy in PlayXAUUSD – Sell Strategy in Play
Hello traders,
Gold reacted exactly as anticipated at the 3508–3510 zone. This correction suggests a bearish opportunity is forming. For confirmation, however, we need to see an M15 candle close below 3466. That would invalidate the previous bullish leg and significantly strengthen the short case.
Structurally, price remains within the broader rising channel, so an early sell should ideally wait until liquidity in the small FVG above has been cleared.
Technical signals are aligning with this view:
MACD has shown steady downside momentum over the last four H1 candles.
Bearish divergence is also emerging across several indicators.
Sell zone to monitor: 3488–3491
Invalidation: a break above the nearest resistance
At these levels, market appetite for fresh longs is fading – chasing buys here is risky. No trend rises endlessly; secondary corrections are always required before higher levels can be reached.
This is my current outlook for gold. Use it as reference, and feel free to share your views in the comments.

Bitcoin Update – The Next StepsBitcoin Update – The Next Steps
Hello traders,
BTC is still moving in line with the outlook I shared previously. Price is now approaching the short zone according to technical structure. For those who prefer not to enter immediately, it may be better to wait for a reaction on the M15–M30 timeframes. The downside is that entries may not be as perfect, but the win rate could improve thanks to additional confirmation.
At the moment, BTC’s price action remains relatively slow. It’s possible that price will consolidate around the entry area for a while, as there is still significant liquidity from the previous long move and market sentiment continues to lean towards upside expectations.
Patience is key here. I’ll update again if there are structural changes. In the meantime, use this scenario as reference and feel free to share your thoughts in the comments so we can discuss further.

USOIL BEARS WILL DOMINATE THE MARKET|SHORT
USOIL SIGNAL
Trade Direction: short
Entry Level: 65.90
Target Level: 59.95
Stop Loss: 69.84
RISK PROFILE
Risk level: medium
Suggested risk: 1%
Timeframe: 1D
Disclosure: I am part of Trade Nation's Influencer program and receive a monthly fee for using their TradingView charts in my analysis.
✅LIKE AND COMMENT MY IDEAS✅

EUR/USD SENDS CLEAR BEARISH SIGNALS|SHORT
EUR/USD SIGNAL
Trade Direction: short
Entry Level: 1.163
Target Level: 1.143
Stop Loss: 1.177
RISK PROFILE
Risk level: medium
Suggested risk: 1%
Timeframe: 1D
Disclosure: I am part of Trade Nation's Influencer program and receive a monthly fee for using their TradingView charts in my analysis.
✅LIKE AND COMMENT MY IDEAS✅

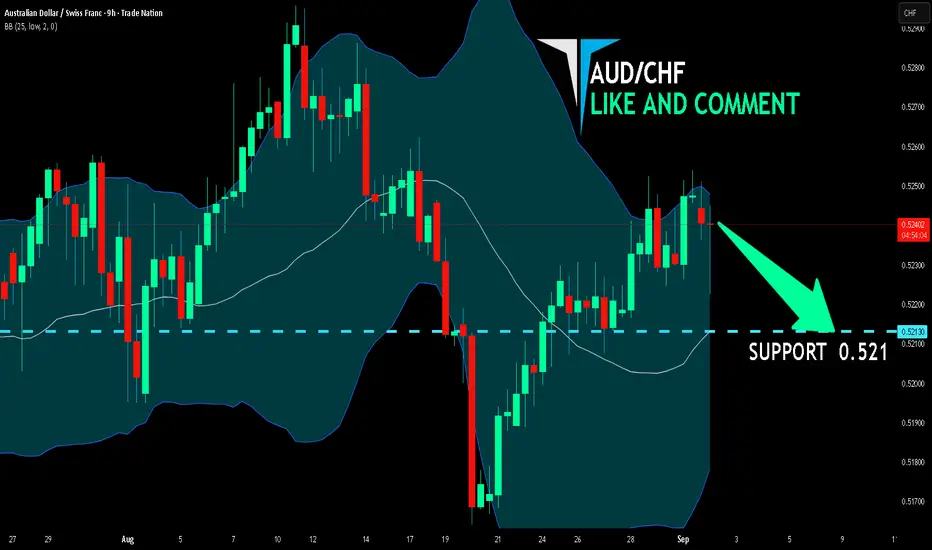
AUD/CHF BEARS ARE GAINING STRENGTH|SHORT
Hello, Friends!
AUD/CHF pair is in the uptrend because previous week’s candle is green, while the price is clearly rising on the 9H timeframe. And after the retest of the resistance line above I believe we will see a move down towards the target below at 0.521 because the pair overbought due to its proximity to the upper BB band and a bearish correction is likely.
Disclosure: I am part of Trade Nation's Influencer program and receive a monthly fee for using their TradingView charts in my analysis.
✅LIKE AND COMMENT MY IDEAS✅
NZD/CHF SELLERS WILL DOMINATE THE MARKET|SHORT
Hello, Friends!
NZD/CHF pair is trading in a local uptrend which we know by looking at the previous 1W candle which is green. On the 9H timeframe the pair is going up too. The pair is overbought because the price is close to the upper band of the BB indicator. So we are looking to sell the pair with the upper BB line acting as resistance. The next target is 0.468 area.
Disclosure: I am part of Trade Nation's Influencer program and receive a monthly fee for using their TradingView charts in my analysis.
✅LIKE AND COMMENT MY IDEAS✅

GBPCHF Bullish Expectation – Heading to 1.0938This time I’m looking for a long opportunity in GBPCHF. After many days of sideways ranging, the price strongly reacted from the FVG demand zone (around 1.0799) and broke above the 0.786 retracement level (1.0845).
I’m expecting buyers to keep control here, and my target is around 1.0938 which also matches the 2.0 Fibonacci extension. If momentum continues, price may even push up to 1.0950.
Still, if there’s any pullback, I’ll be watching the FVG zone again (1.0799 – 1.0815) for another bounce. As long as price holds above that area, my bullish view remains valid.
📈 Expectation: Upside move to 1.0938

Is the Retracement Over?Hi Traders!
GJ dipped in the 50% fib this past week, and bounced off the previous weekly OB again at 198.500. The retracement might be over, and I'm looking to enter a long swing trade. However, I'd like to see it bounce off the 4HR OB sitting at 199.500/.600 and make a return to the 4HR CHOCH around 199.000/.200 to determine my entry. If so, based on the Daily, I'd be swinging this trade to around 202 and 203. That'd also hit around a Weekly bearish OB.
*DISCLAIMER: I am not a financial advisor. The ideas and trades I take on my page are for educational and entertainment purposes only. I'm just showing you guys how I trade. Remember, trading of any kind involves risk. Your investments are solely your responsibility and not mine.*

AUDCHF Demand ZoneAUDCHF has been in an uptrend and has formed a demand zone.
This zone has been tested once and we rallied.
Hopefully we can get another retest followed by a rally.
This is a ltf trade so please only risk 0.5% on this trade.

Gold Update – With US Banks Closed, Beware of a Possible TrapGold Update – With US Banks Closed, Beware of a Possible Trap
Hello traders,
With US banks closed today, market liquidity linked to the dollar may be thinner than usual, creating less predictable moves for gold. The rally during the Asian session has tempted many traders to look for a “sell the top” opportunity with hopes of sizeable profits.
In my view, the market could set up a trap for short-sellers, meaning price may either push higher during the US session or remain sideways at current levels before revealing clearer direction.
At this stage, it may be better to wait for a cleaner wave structure before committing. The priority should still be trading in line with the broader uptrend.
Buy entry zone: around 3340–3345, with a stop-loss of roughly 10 dollars.
For short positions: patience is key – wait for clear channel confirmation on the M15–H1 timeframes before considering entries.
That’s my current view on gold for today’s US session. Use it as reference and manage risk carefully.

SILVER BEARISH BIAS RIGHT NOW| SHORT
SILVER SIGNAL
Trade Direction: short
Entry Level: 4,065.8
Target Level: 3,972.4
Stop Loss: 4,128.0
RISK PROFILE
Risk level: medium
Suggested risk: 1%
Timeframe: 1h
Disclosure: I am part of Trade Nation's Influencer program and receive a monthly fee for using their TradingView charts in my analysis.
✅LIKE AND COMMENT MY IDEAS✅

AUD/NZD BEST PLACE TO SELL FROM|SHORT
AUD/NZD SIGNAL
Trade Direction: short
Entry Level: 1.109
Target Level: 1.097
Stop Loss: 1.117
RISK PROFILE
Risk level: medium
Suggested risk: 1%
Timeframe: 1D
Disclosure: I am part of Trade Nation's Influencer program and receive a monthly fee for using their TradingView charts in my analysis.
✅LIKE AND COMMENT MY IDEAS✅

AUD/CAD SHORT FROM RESISTANCE
Hello, Friends!
We are now examining the AUD/CAD pair and we can see that the pair is going up locally while also being in a uptrend on the 1W TF. But there is also a powerful signal from the BB upper band being nearby, indicating that the pair is overbought so we can go short from the resistance line above and a target at 0.895 level.
Disclosure: I am part of Trade Nation's Influencer program and receive a monthly fee for using their TradingView charts in my analysis.
✅LIKE AND COMMENT MY IDEAS✅

USD/CHF BEARS ARE GAINING STRENGTH|SHORT
USD/CHF SIGNAL
Trade Direction: short
Entry Level: 0.804
Target Level: 0.799
Stop Loss: 0.807
RISK PROFILE
Risk level: medium
Suggested risk: 1%
Timeframe: 2h
Disclosure: I am part of Trade Nation's Influencer program and receive a monthly fee for using their TradingView charts in my analysis.
✅LIKE AND COMMENT MY IDEAS✅

EUR/GBP BULLS WILL DOMINATE THE MARKET|LONG
Hello, Friends!
Bullish trend on EUR/GBP, defined by the green colour of the last week candle combined with the fact the pair is oversold based on the BB lower band proximity, makes me expect a bullish rebound from the support line below and a retest of the local target above at 0.864.
Disclosure: I am part of Trade Nation's Influencer program and receive a monthly fee for using their TradingView charts in my analysis.
✅LIKE AND COMMENT MY IDEAS✅

EUR/CAD LONG FROM SUPPORT
Hello, Friends!
It makes sense for us to go long on EUR/CAD right now from the support line below with the target of 1.611 because of the confluence of the two strong factors which are the general uptrend on the previous 1W candle and the oversold situation on the lower TF determined by it’s proximity to the lower BB band.
Disclosure: I am part of Trade Nation's Influencer program and receive a monthly fee for using their TradingView charts in my analysis.
✅LIKE AND COMMENT MY IDEAS✅

Gold🔸Last week, the price continued its upward trend by hitting our first entry point and rejected the expected ranges.
🔹Now the price is at an important point on the 4-hour chart and since it could not close above the price of 3451.62, there is a possibility of a price reversal.
🔸If the 3451.62 break is confirmed, the new demand ranges are suitable for buying.
🔹If the price closes below the 3404 range, the trend is down and we can sell on pullbacks.
