Bitcoin back below 40kPlan is to return back below 40k.
Invalidations are clear, set in place above 42.2-42.5k area.
Currently is matching up with the 200 EMA on 2/4 HR timeframes that matched the fractal of the sell off at 64k.
A lot of different aspects meet the criteria for this to continue downwards.
Goodluck.
Technical-analysis

AUD USD H4 SELLPrice failure and correction of candle price confirmation
......................................................................

GBPUSD Symmetrical Triangle pattern GBPUSD h1 Chart
- Symmetrical Triangle formation
- Our team expects bullish continuation
SUGGESTED TRADE:
Swing Trade
Buy GBPUSD
Entry Level - 1.30590
Stop - 1.30025
Take - 1.31425
Take lot basis on your Equity no more - 1% risk
protection of your profits from lower levels
Please, leave a comment and support us with like.
🌺Please, comment!& like to support our work 🌺

SWEET DOLLAR INDEXHello Traders,
Dollar is still strong but this might be the last bullish leg before a midterm short. I will be bullish on the dollar for next week.
Cheers!

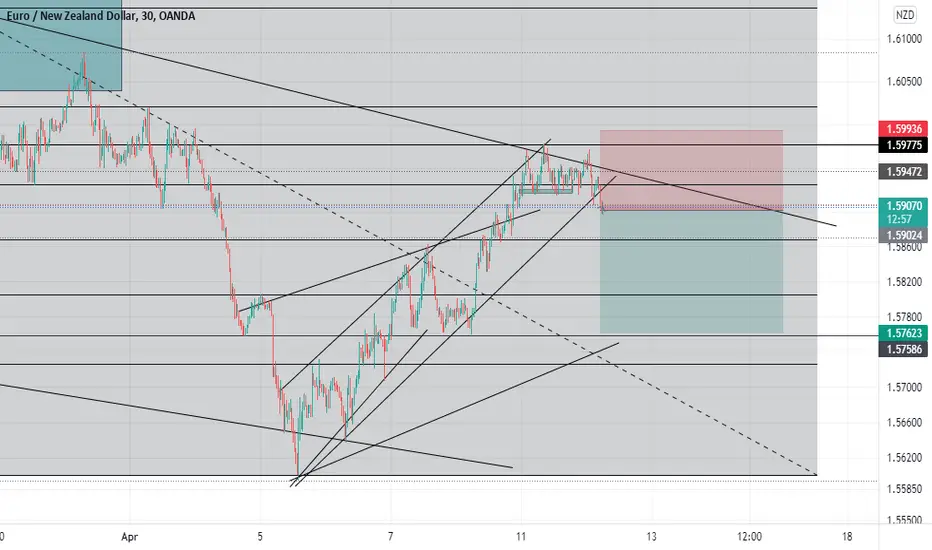
EURNZDMY bias on eurnzd today is to the downside after rejecting the at 61.8 fibonacci retracement level and breaking the trendline, and their is a rumor that newzealand will hike interest rate this might possible drag eurnzd to the 1.57662 level if we are to follow buy the rumor sell the news rule, and if you're looking to buy this pair wait for the break of 1.60000 level before you can decide that buyers are back to the market... do not risk more than 2% of your account on a trade
note: this is base on my view only not a financial advice
Bitcoin Bullish ProjectionRed lines: resistance levels
Green lines: support range
Yellow Dashed: Range that I believe will make the bounce / reversal
VPVR on the left for better display of resistance / support levels
Circled points: Similarities of L shape formations where Bullish Rally followed.
Based on the VPVR and the repetition of the circular formations, I make the bullish projection for the price of bitcoin after the end of the bear wave (-15% ~ -20%) from the rejection at $ 48,000.

Long Term Outlook On EUR/USDIn a long term outlook, EUR/USD is going to act on the continuation pattern for one more push to the downside, before its long term direction corrects.

$CHZ - Long term, this coin is so bullish..This coin has been stuck between $0.15 and $0.65 for ages. This ranging accumulation will lead to a massive breakout at some point, we may already be in the early stages of the next impulse since late February, but only time will validate or invalidate this count. Right now this is the best count I can see.
Safe Trades.

Elliott ADA AnalysisThe ADA long-term cycle began in March 2020, and we are now in a B-wave downtrend, and we expect to move to a C-wave after the end of Wave B, and then we have to wait for the new Elliott cycle to begin.

EUR/USD: Technical analysis + Elliott Wave analysis, PredictionI believe the Euro will loose value up until Q4 of 2022 when compared with the US dollar.

Cardano ADA Is Ready to Make Its Next Bullish Move It seems that ADA stuck into the a tight range but it's retreating a little bit to make it's next move, In coming days it might test 100D EMA and then break above towards 1.60 which is second target in this rally and it's ultimate target is 1.90.

#DOGECOIN OVER 72% RUN TO COME?!!!According to technicals, $DOGE is currently setup to climb over 72% to reach the target at $0.262 and there is nothing in the way of this besides time. With #Dogecoin's breakout in late March, this target became in play and only time may be in the way of it being met. Strap in as there may be much to come for BITFINEX:DOGEUSD ...

Ethereum is Facing Tough Resistance at $3500 Ethereum is Facing Tough Resistance at $3500, on the upside it remain successful to break the $3500 mark then soon we will see it at $4K

AUDUSD [Return To Fair Value Area]Good evening, it seems that the AUD is grinding against the Dollar and will inevitably return to the fair value area that it had maintained for some time before the bearish cycle that got cut off early.
The reason for this is the increasing uncertainty about the degree in rate hikes for the Dollar, the increasing problem of inflation for the Dollar, and the risk on sentiments churning underneath the hood all of which contribute to the bullish scenario we have been seeing the AUD experience against the dollar.
The technicals seem to indicate exhaustion, but in my opinion, this is simply accumulation prior to the big move in my humble opinion.
The bulls seem to be holding the break of its prior bullish channel on the upside quite well, as they'd need a quite strong bullish move to establish the AUDUSD within proximity of its past fair value area. Now, this is only speculation and not financial advice... but I personally will be going long on the AUDUSD, will give an update on the outcome of the play. God bless, trade safe.

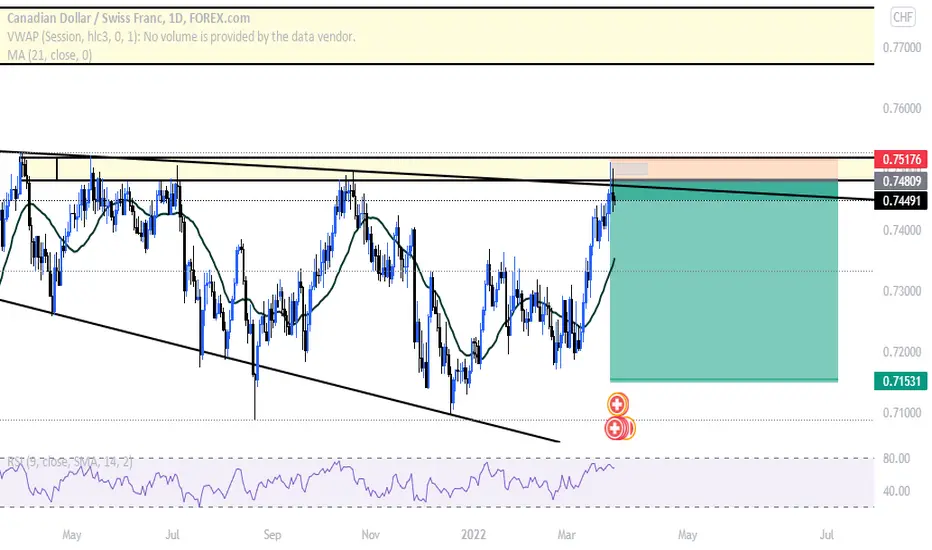
CADCHF Shorts on Reversal ZoneEasy 1/9 RR on CADCHF shorts. Already a sharp movement downwards and expecting price action to trade to the bottom of the liquidity zone.
$omi buy zoneThesis: Using Elliot wave theory from our 1-5 correction with a trend-based fib from 1-2 we've retraced back down to our 1.618 level. That level is also shown in the past looking at our green box to be a clear area of support. Using a trend line from Jun 2021 if we look at recent price action it lines up with the idea of this being a local bottom. I personally bought $350 @ 0.00285 and will be buying another $350 if we can reclaim support above our resistance line from March 2021.

BTCUSDNow we reach a strong resistance level, specially we are testing the Black Trendline that the price respected and reacted massively in the previous months,
I expect to have a correction for 45 - 46 K, retesting this strong level.
for Bull market confirmation we should see a correction in this area, and break out with volume from this correction, at this moment, I expect the Bull Market will start again, and we can start to buy bitcoin and other great coins.
Good Luck !!

Bullish Divergence Bullish divergence us seen on daily chart its trying to cross the resistance of 0.450 but its getting rejected as seller are aggressive in that zone. After the breakout down of the descending triangle pattern it found support at 0.430 and its holding it. I think big move will come very quickly in Deyaar as this stock makes big moves on either side. Closing above 0.460 will be bullish as of now its very tricky.
Hit like & follow guys ;)

Strong Usd?The UsdChf has been showing a bullish momentum, even though we corrected could we expect another impulsive move to the upside?

15M Timeframe AUDUSD SELLLIquid zone,XAUUSD is increasing therefore AUDUSD decreasing(inversely proportional),sniper entry shown,sellers on the line taken out allowing higher high sells!
I waited for a couple of bearish candles to confirm my analysis hence why my entry is not at the sniper entry part.
All feedback is appreciated ;)

AUD is looking like the safe heaven for investors Many people have been looking to invest and safe keep their investments and AUD is looking like A safer alternative.
Strong AUD


Big Move for BTC incoming BTC has been in accumulation mode for roughly 2 weeks now between the 38k-41k range. Now BTC has started consolidating into a bull pennant on the Daily timeframe with bullish divergence forming on Market Cypher.
