Are You a Technical or Fundamental Trader? (And Why It Matters)Financial markets are a battleground of opposing forces: buyers vs. sellers, bulls vs. bears, diamond hands vs. paper hands. But one of the oldest rivalries in trading doesn’t involve price movements at all — it’s the ongoing feud between technical and fundamental traders.
One side believes the charts hold all the secrets (you, maybe?), while the other insists that cold, hard data dictates market direction (you, maybe?). In this Idea, we break down the two and ask: which side are you on?
📈 The Chartists: The Lost Art of Tape Reading
Technical traders are the wizards of the candlestick, seeing patterns where others see chaos. To them, a moving average isn’t just a squiggly line — it’s guidance. Fibonacci levels ? More sacred than grandma’s secret pie recipe. They don’t care if a company just launched the greatest product of the century — if the RSI says it’s overbought, they’re out.
Technical analysis thrives on one simple principle: price action reflects all available information and hints at the next possible move. Instead of diving into earnings reports or economic data — the fundamental traders’ bread and butter — technical traders study past price movements, volume, and momentum indicators to predict the next leg up or down. They’re the ones glued to their TradingView charts, eyes darting between support and resistance levels, waiting for the perfect breakout.
💸 The Fundamentalists: Betting on Real-World Events
Fundamental traders scoff at the idea that lines on a chart can predict the future. Instead, they dig into earnings reports , economic calendars , and all sorts of reports and data. They believe markets, like everything else in life, move based on value, supply and demand, and macroeconomic forces—not just on price action.
To them, a stock isn’t just a ticker symbol; it’s a business with revenues, expenses, and growth prospects. If they’re trading forex , they’re looking at interest rates USINTR and inflation reports USCPI , not head-and-shoulders patterns. The goal? To determine an asset’s intrinsic value and bet on it going up or down, ideally running ahead of the pack.
If a company’s earnings are strong, like Spotify’s SPOT latest earnings figures , they buy—regardless of what a stochastic oscillator says. And vice versa, if a company’s earnings are weak, like Google parent Alphabet’s GOOGL latest showing , they sell.
👉👈 Who’s Right?
Both, depending on who you ask. Technical traders argue that prices move in patterns, and those patterns repeat. Fundamental traders counter that real-world events drive prices, and charts are just a delayed reflection of reality.
The truth may actually be somewhere in the middle — markets are a mix of both. Even the most die-hard fundamentalist will glance at a chart before making a trade, and many technical traders keep an eye on economic calendars to avoid being blindsided by major news.
💡 Why It Matters
Your trading style affects everything: the markets you trade, the tools you use, and even your level of stress. If you’re a fundamentals-first trader trying to scalp five-minute charts, you’re in a world of pain. Conversely, if you’re a technical trader attempting to hold trades for years without considering financial data, you might miss obvious warning signs.
Understanding your own tendencies can help refine your strategy and improve your results. Are you more comfortable crunching numbers and reading financial statements? You might be in the same boat with other cash-flow guys like Warren Buffett and Ray Dalio. Do you prefer spotting patterns and reacting to price action? Say hello to your billionaire buddies Paul Tudor Jones and Stanley Druckenmiller.
💚 Final Thoughts
Bottom line, trading isn’t about proving one method superior — it’s about making the right decisions, and, let’s be frank, turning a profit. Whether you’re a chart junkie or an earnings aficionado, what matters most is having a strategy that works for you.
So now the big question… which side are you on? Fundamental analysis or technical analysis? Comment below and let’s see who’s who!
Technical

HERE ARE 10 COMMON TRADING INDICATORS MADE SIMPLE Chart has all 10.
Hope this helps.
Hope it's simple to understand if you still struggle with indicators.
Remember, no one indicator is good on its own.
Think of an indicator as a sign that you should pay attention to a possibility. For example, if I go to the ocean, maybe I have an indicator that says you're closer to sharks than in the great lakes, will I be eaten? Probably not, but also, there are more sharks and my indicator confirms that. I can't use this one indicator to say, I'm probably about to be eaten. BUT.. Let's say I have multiple indicators that I use to give me a better idea if I'll be eaten. Maybe an indicator tells me there is an oddly higher than avg number of a sharks number 1 food source within the area. Can I say I'll be eaten? No, but I could say, maybe due to the increased food supply, there may be more sharks. What if I have a few more indicators, one of which says there are 30 great whites within 10 miles, and another that says, usually at this time of the year, there are only ever between 2 to 7 great whites. Can I say, Yes, I'll be eaten? NOPE, not yet.
What if I have another indicator that says, across the globe, shark attacks are increasing by a certain percentage, and another that says, there is blood detected within the water you're swimming in, which is lower than the threshold for human's to detect, but higher than the threshold needed for sharks to smell. What if I combine that with an indicator that says, on avg there are 1000 swimmers here, but now, there are under 30. Can I say I'll be eaten? Nope, BUT, I can say, hmm. Something is up and if one of us were to get eaten, I'm more likely to be picked out of 30 people than 1000.
When can I say I'll be eaten? Probably if you build an indicator that can detect bite force and compare to known bit forces of sharks that could sense you're actively being eaten, but at that point, the stock moved already... err I mean, the shark ate already, and you're late to the show..
My point being, use them, but don't always assume when it comes to indicators. Take in all the data and then make a decision. Some indicators fit your style, some won't. Do I need 30 stacked indicators for sharks if I'm swimming in Lake Michigan? Probably not, it would make everything a mess.
So, here there are.
Relative Strength Index (RSI): Ah, the RSI, the “I’ve had too much” indicator of the stock market. When it hits above 70, it’s like your stock had too much to drink at the party and is likely to come crashing down. Below 30? It’s been left out in the cold and might be due for a warm-up (a.k.a. price increase). Remember, it’s not foolproof, but then again, neither is your weather app.
On-Balance Volume (OBV): This one’s all about following the crowd. If the volume is increasing, it’s like everyone’s rushing to get the latest iPhone. But remember, even if everyone jumps off a bridge, it doesn’t mean you should too. Always double-check before you follow the herd.
Simple Moving Average (SMA): The SMA is like that reliable friend who’s always a bit behind on the latest trends. It gives you the average closing price over a certain period. It’s simple, it’s moving, it’s average. It’s the SMA.
Exponential Moving Average (EMA): The EMA is the SMA’s hip younger sibling. It cares more about what happened recently than what happened way back when. It’s great for short-term trading, but remember, even the coolest kids can get things wrong.
Moving Average Convergence Divergence (MACD): This one sounds complicated, but it’s not. It’s like watching two rabbits on a race track. If the fast rabbit (the 12-day EMA) overtakes the slow rabbit (the 26-day EMA), it’s a bullish signal. If the slow rabbit overtakes the fast one, it’s a bearish signal. Just remember, rabbits are unpredictable!
Fibonacci retracements: Ah, Fibonacci, the Da Vinci of math. These horizontal lines indicate where support and resistance levels might be. It’s like trying to predict where you’ll meet your ex at a party. It could be useful, but don’t rely on it too much.
Stochastic oscillator: This one’s a bit like a pendulum. When it swings one way, it’s likely to swing back the other way soon. It’s great for spotting potential reversals, but remember, even a broken clock is right twice a day.
Bollinger bands: These are like the elastic waistband of your favorite sweatpants. If the price hits the upper band, it might be time to sell (or stop eating pizza). If it hits the lower band, it might be time to buy (or hit the gym).
Average Directional Index (ADX): This one tells you whether the price is trending strongly or just wandering around like a lost puppy. Above 25 is a strong trend, below 20 is weak. But remember, even lost puppies find their way home eventually.
Accumulation/Distribution (A/D) line: This one’s all about supply and demand. If the line is going up, the stock is being accumulated. If it’s going down, it’s being distributed. It’s like tracking whether more people are buying or selling fidget spinners.
Remember, these indicators are like tools in a toolbox. Don’t try to build a house with just a hammer. Use them in combination, understand their limitations, and always do your own research. Happy trading! 📈

Constructin of chartsThe first documented use of charts goes back to ancient Babylonia, where their early forms were used primarily for record-keeping by astrologists and merchants. Then, sometime between the 5th and 6th century A.D., these graphical representations developed into a form reminiscent of today’s charts. Further refinement and development of charting techniques continued through the centuries, influenced by advancements in mathematics, commerce, and technology, which propelled charts from hand-drawn illustrations to sophisticated computerized displays in the 20th century. Nowadays, there is a myriad of visualization options, but line charts, bar charts, and candlestick charts are the most widely used for the purpose of technical analysis.
Key points:
A chart is a graphical display of data, usually price and volume.
In the context of financial markets, charts serve as tools for analyzing trends, patterns, and relationships in data.
There is a wide array of visualization options available today, with line charts, bar charts, candlestick charts, and equivolume charts being among the most commonly used.
Different types of charts are suitable for analyzing different aspects of data, ranging from long-term trends to short-term price movements and volatility.
Line chart
A line chart is represented by a single line that provides information about the price on the vertical axis and time on the horizontal axis. It is typically constructed by connecting a closing price. This type of chart is suitable for analyzing long-term trends, but its main drawback is that it provides only one piece of information, unlike a bar graph or a candlestick graph.
Illustration 1.01
The illustration above shows the daily line graph of Bitcoin (BTCUSD) between 2020 and late 2022.
Bar chart
A bar chart is constructed with bars, each representing one particular time interval. These bars provide information about opening price, closing price, high, and low. As such, volatility and various price patterns can be easily observed. This type of chart fits short-term, medium-term, and long-term trend studies.
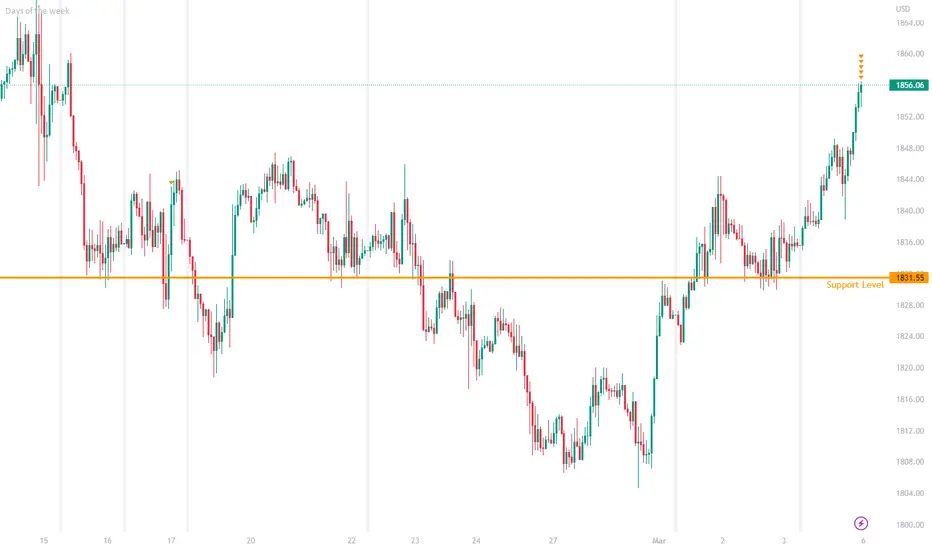
Illustration 1.02
The image portrays the daily bar chart of silver (XAGUSD) throughout 2022 and early 2023.
Candlestick chart
A candlestick chart is very similar to a bar chart and provides information about opening price, closing price, high, and low. It consists of the real body and shadow. The real body is a rectangular area between the opening and closing prices. Shadows are the price extremes that occur within a trading session and are represented by thin bars above and below the real body. The shadow above the real body is called the upper shadow, and the shadow below the real body is called the lower shadow. Candlestick charts are appropriate for analyzing short-term, medium-term, and long-term trends.
Illustration 1.03
Above is the weekly candlestick chart of gold (XAUUSD) between late 2007 and early 2017.
Equivolume chart
In an equivolume chart, the width of each bar or candlestick is proportional to the volume traded during that period, while the height represents the price range (high to low) for the same period. This type of chart aims to visually depict the relationship between trading volume and price movement, allowing traders to identify patterns and trends more effectively. Equivolume charts are especially useful for analyzing the strength of price movements in relation to trading activity.
Illustration 1.04
The equivolume chart of silver (XAGUSD) is depicted above.
Please feel free to express your ideas and thoughts in the comment section.
DISCLAIMER: This analysis is not intended to encourage any buying or selling of any particular securities. Furthermore, it should not be a basis for taking any trade action by an individual investor or any other entity. Therefore, your own due diligence is highly advised before entering a trade.

Finding Bottoms Using Monthly Inside Candles: SNOWThis past year, I shared many bottoms on names on my weekly WLs based on bottoming consolidation structures, mentioning a specific strategy as a reasoning for the trades. Aside from understanding price action, I used a simple method:
Monthly inside candles/bars.
----------------------------------------------
What is an inside candle/bar?
Inside candles trade “inside” its previous candle. The previous candle’s high and low can be used as resistance and support, respectively. Your trade execution comes on a break & hold above/below the range.
Here are a few examples of this:
pbs.twimg.com
----------------------------------------------
NYSE:SNOW
This has traded within it’s May ‘22 inside range for over a year. This has been one of my top watches earlier this year.
The range provides a macro resistance/support of $187.23 and $112.10, respectively. These levels can now be used as targets for your trades.
How do I execute on this?
Zoom into LTFs to find swing opportunities. In my 1/23/23 weekly watchlist, I provided NYSE:SNOW based on a previous bull div + key support/demand being held (red box).
pbs.twimg.com
All swing contracts provided on the WL printed, while NYSE:SNOW saw a massive upside move from $140 into $178.70 within 2 weeks.
You’ll also notice my invalidation for this was $133.10 while the low was $134.34. This invalidation was based on a breakdown of the range low.
Now once again, on 3/31/2023 I mentioned NYSE:SNOW as a potential high R:R trade.
Based on the exact same reasoning as my January WL.
Once again, NYSE:SNOW was able to hold its demand zone with a macro target of the monthly inside candle resistance.
NYSE:SNOW
The same exact entry & same exact analysis now provided a recent move into my $187.23 target. First move providing a 33% move, second providing a 42% move.
This is how you take advantage of macro inside ranges (specifically monthly candles in these examples).
pbs.twimg.com

Currencies are Rubber Bands - That is Why Bollinger Bands WorkIn the heat of the moment, when big news such as the optimism of over the US debt ceiling and US rate hike causes big bullish move in the USD, we tend to extrapolate that currencies will go in one direction. However, the truth is that currencies are like rubber bands. When it hits either bands, we should expect the currency to rebound back

Top Technical Indicators PairingsWhile there is no single definitive answer to which specific combinations of technical indicators is the most profitable, I can try to provide some popular combinations and their application in trading strategies.
The success of these strategies depends on various factors such as the trader's skill, market conditions, and risk management techniques.
1. Moving Averages and MACD (Moving Average Convergence Divergence):
Moving averages smooth out price data to help traders identify trends. Two commonly used types are the Simple Moving Average (SMA) and the Exponential Moving Average (EMA). A popular strategy is to use two moving averages with different timeframes, such as the 50-day and 200-day SMAs. When the shorter timeframe moving average (e.g., 50-day SMA) crosses above the longer timeframe moving average (e.g., 200-day SMA), it generates a bullish signal. Conversely, when the shorter timeframe moving average crosses below the longer one, it generates a bearish signal.
The MACD is a trend-following momentum indicator that calculates the difference between two EMAs of the price and then smooths it with another EMA. A common configuration is the 12-day EMA, the 26-day EMA, and the 9-day signal EMA. When the MACD line crosses above the signal line, it generates a bullish signal, while a bearish signal occurs when the MACD line crosses below the signal line. Combining moving averages with MACD can provide stronger signals, as the moving averages identify trends and the MACD helps confirm them.
2. RSI (Relative Strength Index) and Bollinger Bands:
The RSI is a momentum oscillator that measures the speed and change of price movements. The RSI ranges from 0 to 100 and is typically used to identify overbought or oversold conditions. An RSI above 70 is considered overbought, suggesting that the asset may be overvalued and due for a pullback. An RSI below 30 indicates oversold conditions, suggesting that the asset may be undervalued and due for a rebound.
Bollinger Bands consist of a moving average (usually the 20-day SMA) and two standard deviations above and below it. The bands expand and contract based on an asset's volatility. When the price touches the upper Bollinger Band, it could be a sign of overextension and an impending reversal to the downside. Conversely, when the price touches the lower Bollinger Band, it could indicate that the asset is oversold and due for a rebound.
By combining the RSI and Bollinger Bands, traders can identify potential reversal points with greater confidence. For instance, if the RSI indicates an overbought condition and the price touches the upper Bollinger Band, it could provide a stronger signal to exit long positions or enter short positions.
3. Stochastic Oscillator and ADX (Average Directional Index):
The Stochastic Oscillator is a momentum indicator that compares an asset's closing price to its price range over a specific period. The indicator consists of two lines: %K and %D. When %K crosses above %D, it generates a bullish signal, while a bearish signal occurs when %K crosses below %D. Traders often look for overbought or oversold conditions, similar to the RSI.
The ADX is a non-directional indicator that measures the strength of a trend. A rising ADX indicates a strengthening trend, while a falling ADX suggests a weakening trend. The ADX does not provide information on the direction of the trend; it merely indicates the trend's strength.
By combining the Stochastic Oscillator and ADX, traders can identify potential entry and exit points with greater confidence. For instance, if the Stochastic Oscillator signals a bullish crossover and the ADX is rising, it could indicate that the uptrend is strong, and a long position may be warranted. Conversely, if the Stochastic Oscillator signals a bearish crossover and the ADX is rising, it could suggest that the downtrend is strong, and a short position may be appropriate.
4. Support and Resistance with Volume Indicators:
Support and resistance levels are critical price points where buying or selling pressure tends to push the price back in the opposite direction. Support is a price level where buying pressure is strong enough to prevent the price from falling further, while resistance is a level where selling pressure is strong enough to stop the price from rising further.
Volume indicators, such as OBV (On-Balance Volume) or VPVR (Volume Profile Visible Range), can provide insights into the strength of price movements. The OBV is a cumulative indicator that adds volume on up days and subtracts volume on down days, reflecting buying and selling pressure. The VPVR displays the volume traded at different price levels, helping traders identify areas of high buying or selling interest.
By combining support and resistance levels with volume indicators, traders can better identify potential entry and exit points. For example, if the price is approaching a support level and the OBV is rising, it could suggest that buying pressure is increasing, and the price may bounce off the support level. Similarly, if the price is nearing a resistance level and the OBV is falling, it could indicate that selling pressure is increasing, and the price may reverse at the resistance level.
5. Fibonacci Retracements and Moving Averages:
Fibonacci Retracements are a popular tool used to identify potential support and resistance levels based on the Fibonacci sequence. By measuring the distance between a significant high and low in a price trend, traders can identify key retracement levels, typically at 23.6%, 38.2%, 50%, 61.8%, and 78.6%. These levels often act as support or resistance, where price reversals might occur.
Combining Fibonacci Retracements with moving averages can offer additional confirmation for potential reversal points. For instance, if a 50-day moving average aligns with a 61.8% Fibonacci retracement level, it could strengthen the case for a potential reversal at that price point.
6. Ichimoku Cloud and RSI:
The Ichimoku Cloud is a comprehensive technical analysis tool that provides information on trend direction, momentum, and support and resistance levels. It consists of five lines: Tenkan-sen, Kijun-sen, Senkou Span A, Senkou Span B, and Chikou Span. A bullish signal is generated when the price moves above the cloud, while a bearish signal occurs when the price moves below the cloud.
By combining the Ichimoku Cloud with the RSI, traders can obtain more robust signals for potential trend reversals or continuations. For example, if the price breaks above the Ichimoku Cloud and the RSI moves above 50, it could indicate a strong bullish momentum, suggesting a long position. Conversely, if the price falls below the Ichimoku Cloud and the RSI drops below 50, it could signal a strong bearish momentum, suggesting a short position.
While these combinations of technical indicators have been popular and potentially profitable for predicting the performance of SPY up to September 2021, it's crucial to remember that no strategy is foolproof. The success of a trading strategy depends on various factors, such as the trader's skill, market conditions, and risk management techniques.
7. Chart Patterns and Volume Indicators:
Chart patterns are visual representations of market psychology and can help traders identify potential trend reversals or continuations. Some common chart patterns include Head and Shoulders, Double Tops and Bottoms, Triangles, and Flags. These patterns often suggest impending price movements based on historical performance.
By combining chart patterns with volume indicators like OBV (On-Balance Volume) or VPVR (Volume Profile Visible Range), traders can gain insights into the strength of price movements and validate potential breakouts or reversals. For example, a bullish breakout from a chart pattern accompanied by increasing OBV could indicate strong buying pressure, supporting the likelihood of a sustained upward move. Conversely, a bearish breakdown from a chart pattern accompanied by decreasing OBV could suggest strong selling pressure, supporting the likelihood of a continued downward move.
8. Candlestick Patterns and Moving Averages:
Candlestick patterns are another form of visual analysis that can provide insights into market sentiment and potential price direction. Common candlestick patterns include the Hammer, Shooting Star, Engulfing Pattern, and Doji. These patterns can offer short-term signals for potential reversals or trend continuations.
Combining candlestick patterns with moving averages can help traders confirm potential trend changes or continuations. For example, a bullish candlestick pattern occurring near a rising moving average could suggest that the uptrend is likely to continue. Similarly, a bearish candlestick pattern near a falling moving average could indicate that the downtrend may persist.
9. Multi-timeframe Analysis:
Using multiple timeframes in technical analysis allows traders to gain a more comprehensive understanding of market trends and price action. By examining different timeframes, such as daily, weekly, and monthly charts, traders can identify the primary trend, intermediate trend, and short-term fluctuations.
By applying technical indicators and chart patterns across various timeframes, traders can obtain more robust trading signals and improve their decision-making process. For example, a moving average crossover on a daily chart may provide a more significant signal if it aligns with a key support or resistance level on a weekly chart.
10. Divergence Analysis with Oscillators:
Divergence analysis involves comparing the price action of an asset with an oscillator, such as the MACD, RSI, or Stochastic Oscillator. A divergence occurs when the price makes a new high or low, but the oscillator fails to follow suit, suggesting a potential reversal or weakening of the current trend.
For instance, if an asset's price reaches a new high but the RSI fails to make a new high, it could signal a bearish divergence, indicating that the uptrend may be losing momentum. Conversely, if the price makes a new low and the RSI fails to make a new low, it could signal a bullish divergence, suggesting that the downtrend may be losing steam.
By incorporating divergence analysis with other technical indicators or chart patterns, traders can enhance their decision-making process and identify potential trend reversals with greater confidence.
In conclusion, while various combinations of technical indicators, chart patterns, and analytical techniques have been popular and potentially profitable for predicting the performance, the success of a trading strategy depends on various factors, such as the trader's skill, market conditions, and risk management techniques.
Traders must continuously evaluate and adjust their strategies based on changing market conditions and consider other factors such as fundamentals, economic news, and global events. It's also essential to practice proper risk management techniques, such as setting stop-loss orders and position sizing, to minimize potential losses and enhance the overall success of a trading strategy.

Winning Combinations of Technical and Fundamental IndicatorsHere are some combinations of technical and fundamental indicators that investors often use to analyze stocks.
1. Moving Average, MACD , RSI + Valuation Ratios (P/E, P/B, P/S)
This combination of technical and fundamental indicators is commonly used by investors to analyze the short-term price trends of a stock and its long-term valuation. Moving averages, MACD , and RSI are technical indicators that can help investors identify short-term buy or sell signals, overbought or oversold conditions, and follow the trend. On the other hand, valuation ratios like P/E, P/B, and P/S can provide insights into the company's long-term valuation and potential for growth. For example, if a stock's P/E ratio is significantly lower than its industry average, it may indicate that the stock is undervalued and could present a buying opportunity.
2. Bollinger Bands , Ichimoku Cloud , Stochastic + Financial Statement Analysis, Interest Rates
This combination of technical and fundamental indicators is commonly used by investors to analyze a stock's price volatility and trend as well as its financial health and economic factors. Bollinger Bands , Ichimoku Cloud , and Stochastic are technical indicators that can help investors measure price volatility , identify overbought or oversold levels, and follow the trend. Financial statement analysis can provide insights into a company's financial health, including its revenue, earnings , and debt levels. Interest rates can also provide insights into the broader economic trends that may impact the stock's performance. For example, if interest rates are rising, it may indicate a stronger economy, which could positively impact the stock's performance.
3. Fibonacci Retracement , Support and Resistance , MACD + Economic and Political News, Key Economic Indicators ( Inflation Rate, GDP, Unemployment Rate)
This combination of technical and fundamental indicators is commonly used by investors to analyze a stock's short-term price trends, volatility , and support and resistance levels, as well as the overall economic performance and market trends. Fibonacci retracement , Support and Resistance , and MACD are technical indicators that can help investors identify short-term buy or sell signals, measure volatility , and identify support and resistance levels. Economic and political news, as well as key economic indicators like inflation rate, GDP, and unemployment rate, can provide insights into the overall economic performance and market trends that may impact the stock's performance. For example, if there is positive economic news or if key economic indicators like GDP and inflation rate are improving, it may indicate a growing economy and positively impact the stock's performance.
It is important to note that these combinations are just examples and their effectiveness may vary depending on market conditions and the trading strategy used. Investors should always exercise due diligence and research before using indicators in their trading strategy.
Feel free to share your own combinations of indicators and opinions in the comments section below.

10 Common Technical Indicators Simply Explained for Easy TradingTrend Indicators:
1. Moving Average (MA):
The Moving Average is a popular trend-following indicator that smooths out price data by creating a constantly updated average price.
The MA is used to identify the general direction of a trend, as well as potential support and resistance levels. The most commonly used MA types are the Simple Moving Average (SMA) and the Exponential Moving Average (EMA).
Short-term traders often use shorter MAs, such as the 10-day or 20-day MA, while longer-term traders may use the 50-day or 200-day MA.
2. Moving Average Convergence Divergence (MACD):
The MACD is another trend-following momentum indicator that shows the relationship between two moving averages of a security's price.
The MACD consists of a fast line (12-day EMA), a slow line (26-day EMA), and a signal line (9-day EMA). The MACD is used to identify trend reversals and momentum shifts.
When the fast line crosses above the slow line, it is considered a bullish signal, and when the fast line crosses below the slow line, it is considered a bearish signal.
Momentum Indicators:
3. Relative Strength Index (RSI):
The RSI is a popular momentum oscillator that measures the velocity and magnitude of price movements. The RSI compares the average gains and losses over a specific period of time to determine whether a security is overbought or oversold. The RSI typically ranges from 0 to 100, with readings above 70 indicating overbought conditions and readings below 30 indicating oversold conditions. The RSI can be used to confirm price trends and to identify potential trend reversals.
4. Stochastic Oscillator: The Stochastic Oscillator is another momentum oscillator that compares the closing price of a security to its price range over a specific period of time.
The Stochastic Oscillator consists of two lines: %K and %D. The %K line is the main line, and the %D line is a moving average of the %K line. The Stochastic Oscillator is used to identify overbought and oversold conditions and potential trend reversals. When the %K line crosses above the %D line, it is considered a buy signal, and when the %K line crosses below the %D line, it is considered a sell signal.
Volatility Indicators:
5. Bollinger Bands:
Bollinger Bands are a popular volatility indicator that consists of three lines: a moving average, an upper band, and a lower band. The upper and lower bands are typically set two standard deviations away from the moving average. The bands expand and contract as volatility increases and decreases.
When the price is at the upper band, it is considered overbought, and when it is at the lower band, it is considered oversold. Bollinger Bands can be used to identify potential trend reversals and to confirm price trends.
6. Average True Range (ATR):
The ATR is a volatility indicator that measures the average range of a security's price over a specific period of time.
The ATR is typically used to identify potential breakout opportunities and to set stop-loss orders. High ATR readings indicate high volatility, while low ATR readings indicate low volatility.
Oscillator Indicators:
7. Commodity Channel Index (CCI):
The CCI is an oscillator indicator that measures the difference between a security's price and its average price over a specific period of time.
The CCI typically ranges from -100 to +100, with readings below -100 indicating oversold conditions and readings above +100 indicating overbought conditions.
The CCI can be used to identify potential trend reversals and to confirm price trends.
8. Relative Vigor Index (RVI):
The RVI is another oscillator indicator that measures the strength of a security's price relative to its closing price range over a specific period of time.
The RVI typically ranges from 0 to 100, with readings above 50 indicating bullish conditions and readings below 50 indicating bearish conditions. The RVI can be used to identify potential trend reversals and to confirm price trends.
Volume Indicators:
9. On-Balance Volume (OBV):
The OBV is a popular volume indicator that measures the buying and selling pressure of a security based on its volume.
The OBV adds the total volume of a security when its price increases and subtracts the total volume when its price decreases.
The OBV can be used to confirm price trends and to identify potential trend reversals.
10. Chaikin Money Flow (CMF):
The CMF is another volume indicator that measures the buying and selling pressure of a security based on its volume.
The CMF takes into account both the price and volume of a security to determine its overall buying and selling pressure.
The CMF typically ranges from -1 to +1, with readings above 0 indicating buying pressure and readings below 0 indicating selling pressure.
The CMF can be used to confirm price trends and to identify potential trend reversals.
In conclusion, technical indicators are essential tools for traders to analyze securities and make informed decisions about buying and selling.
Each indicator has its own strengths and weaknesses, and traders often use a combination of indicators to confirm their trading decisions.
By understanding how these indicators work and what they measure, traders can gain a deeper insight into the behavior of the markets and potentially improve their trading performance.

reversal technical patterns overview part oneReversal Technical Patterns overview: Part One
Reversal patterns are frequently spotted at the end of the bear/bull market cycles. Here are some of the key patterns with higher probabilities. Can be applied to any market, including forex, crypto, stocks, indices and metals.
Double Bottom (Bulls)
Double Top (Bears)
🔸A double bottom pattern is a classic technical analysis charting formation showing a major change in trend from a prior down move. The double bottom pattern looks like the letter W.
🔸The double top is a type of chart pattern that is an indication that the prevailing trend may reverse, in the short or long term.
🔸The double top is a common occurrence towards the end of a bullish market. The price formation looks like two peaks that occur after one another.
🔸The double bottom formation typically occurs at the end of a downward trending or declining market.
🔸 The double bottom is similar to the double top, but the key difference between the two can be seen in the inverse or negative relationship in price.
Inverse Head and Shoulders (Bulls)
Head and Shoulders (Bears)
🔸The inverse head and shoulders pattern begins with a downtrend. This is the extended move down that eventually leads to exhaustion and a reversal higher as sellers exit and buyers step up. That downtrend is met by minor support, which forms the first shoulder. As the market begins to move higher, it bounces off strong resistance and the downtrend resumes. This resistance level forms the neckline.
🔸Pattern is defined by the head / left shoulder / right shoulder and neckline.
🔸The H*S pattern is a bearish market pattern will appear near market tops. The first shoulder forms after a significant bullish period in the market when the price rises and then declines into a trough. The head is then formed when the price increases again, creating a high peak above the level of the first shoulder formation. From this point, the price falls and creates the second shoulder, which is usually similar in appearance to the first shoulder.
🔸The pattern is completed, giving a market reversal signal, when the price declines again, breaking below the neckline. The neckline, as depicted above, is the horizontal line that connects the first two troughs to one another.
Three Drives (Bulls)
Three Drives (Bears)
🔸The three-drive is a rare price pattern formed by three consecutive symmetrical drives up or down. In its bullish form, the market is making three final drives to a bottom before an uptrend forms. In a bearish three-drive, it is peaking before the bears take over. A three-drive contains two overlapping ABCD patterns.
🔸There are multiple ways of trading a Three drives pattern:
You can trade the drive 3. Enter the market when you are sure that the market has formed the point B (buy in a bearish Three-Drive and sell in a bullish Three Drive).
You can trade when the entire pattern is complete.
🔸Extensions are always based on fibs, most of the time 1.27 and 1.62.
Falling Wedge (Bulls)
Rising Wedge (Bears)
🔸The falling wedge pattern is interpreted as both a bullish continuation and bullish reversal pattern which gives rise to some confusion in the identification of the pattern. Both scenarios contain different market conditions which must be taken into consideration.
🔸The Falling Wedge in the downtrend indicates a reversal to an uptrend. It is formed when the prices are making Lower Highs and Lower Lows compared to the previous price movements. It gives traders opportunities to take buy positions in the market.
🔸The rising wedge in an uptrend indicates reversal to the downtrend. It is formed when the prices are making Higher Highs and Higher Lows compared to the previous price movements. It gives traders opportunities to take short positions in the market
🔸Generally, traders will wait for a breakout before executing a trade on buy/sell side. Also traders may chose to wait for a re-test of the breakout area before executing a trade.

Mastering the Art of Technical Analysis (Part 6)Advantages of Technical Analysis
- Easy to Use: Technical analysis is easy to use and understand, making it accessible to traders of all levels of experience.
- Objective: Technical analysis is objective, as it relies on data and mathematical calculations rather than subjective opinions.
- Helps Identify Trends: Technical analysis helps traders identify trends, which can be used to make informed trading decisions.
- Provides Entry and Exit Points: Technical analysis can help traders determine entry and exit points for trades, allowing them to make profitable trades.
- Can be Used with Any Asset Class: Technical analysis can be used with any asset class, including stocks, commodities, and forex.
Disadvantages of Technical Analysis
- Past Performance Doesn't Guarantee Future Results: While technical analysis is based on historical data, it does not guarantee future results.
- Can be Subjective: Technical analysis can be subjective, as traders may interpret the same data differently.
- Not Suitable for All Market Conditions: Technical analysis may not be suitable for all market conditions, as some markets may be too volatile or have limited historical data.
- Overreliance on Indicators: Some traders may over rely on technical indicators, which can lead to false signals and poor trading decisions.
- Requires Constant Monitoring: Technical analysis requires constant monitoring of market data and indicators, which can be time-consuming.
Mastering the Art of Technical Analysis (Part 4)Candlestick Patterns
Candlestick charts are a popular type of chart used by traders to analyze price movements. They display the opening and closing prices, as well as the highs and lows, of an asset over a specific time period. Candlestick patterns are formed by the arrangement of multiple candlesticks and can provide insights into market trends and potential price movements.
Doji
A Doji is a candlestick pattern that has the same opening and closing price, or a very small difference between the two. This pattern often indicates indecision in the market and can be a signal for a potential trend reversal.
Hammer
A Hammer is a bullish reversal pattern that forms after a downward trend. It is characterized by a long lower shadow and a small body, and it indicates that buyers have gained control and are pushing the price up.
Shooting Star
A Shooting Star is a bearish reversal pattern that forms after an upward trend. It is characterized by a long upper shadow and a small body, and it indicates that sellers have gained control and are pushing the price down.
Engulfing
An Engulfing pattern is a reversal pattern that is formed by two candlesticks. The first candlestick is smaller and the second candlestick completely engulfs the first one. A bullish Engulfing pattern forms at the end of a downtrend and indicates a potential trend reversal. A bearish Engulfing pattern forms at the end of an uptrend and indicates a potential trend reversal.
Harami
A Harami pattern is a reversal pattern that is formed by two candlesticks. The first candlestick is larger and the second candlestick is smaller and is completely engulfed by the first candlestick. A bullish Harami pattern forms at the end of a downtrend and indicates a potential trend reversal. A bearish Harami pattern forms at the end of an uptrend and indicates a potential trend reversal.
Candlestick patterns are an important tool for technical analysis and can provide insights into market trends and potential price movements. By understanding the key principles of each candlestick pattern, traders can gain insights into market trends and make informed trading decisions. However, it is important to note that candlestick patterns are not foolproof and should be used in conjunction with other forms of analysis, such as fundamental analysis and market news.

Mastering the Art of Technical Analysis (Part 3)Technical indicators are mathematical calculations that are applied to price and volume data to identify potential trading opportunities. They are based on the belief that certain patterns or trends in price and volume data can provide insights into market trends and potential price movements. Technical indicators can be used to confirm trends, identify potential entry and exit points for trades, and to provide signals for when to buy or sell.
Moving Averages
Moving averages are one of the most common technical indicators used by traders. They are used to smooth out the price data and provide a clearer picture of the overall trend. Moving averages can be calculated using different time periods, such as 50-day moving average or a 200-day moving average. A crossover between a shorter-term moving average and a longer-term moving average is often used as a signal for when to buy or sell.
Relative Strength Index (RSI)
The Relative Strength Index (RSI) is a momentum oscillator that measures the speed and change of price movements. The RSI ranges from 0 to 100, with readings above 70 considered overbought and readings below 30 considered oversold. Traders often use the RSI to identify potential trend reversals or to confirm trends.
Bollinger Bands
Bollinger Bands are a technical indicator that is used to measure volatility. They consist of three lines - a simple moving average (SMA) in the middle, and two outer bands that are two standard deviations away from the SMA. The outer bands represent the upper and lower price ranges, and the width of the bands changes based on the volatility of the asset. Traders often use Bollinger Bands to identify potential entry and exit points for trades.
Moving Average Convergence Divergence (MACD)
The Moving Average Convergence Divergence (MACD) is a trend-following momentum indicator that uses two moving averages of different lengths to identify potential entry and exit points for trades. The MACD line is calculated by subtracting the 26-day exponential moving average (EMA) from the 12-day EMA. A signal line, which is a 9-day EMA, is then plotted on top of the MACD line. Traders often use the MACD to identify potential trend reversals or to confirm trends.
Fibonacci Retracement
The Fibonacci retracement is a technical indicator that is used to identify potential support and resistance levels based on the Fibonacci sequence. The Fibonacci sequence is a mathematical sequence of numbers, in which each number is the sum of the two preceding numbers. The retracement levels are calculated based on the high and low points of a particular price movement, and they are used to identify potential entry and exit points for trades.

Mastering the Art of Technical Analysis (Part 2)Understanding the Basics of Technical Analysis
Technical analysis is a method of analyzing financial markets that relies on studying past market data to identify patterns and make predictions about future price movements. The aim is to identify opportunities to buy low and sell high or vice versa.
What is technical analysis and why is it important for traders?
Technical analysis is the study of market data, primarily price and volume data, to identify patterns that can be used to make informed trading decisions. It is important for traders because it provides a way to interpret market trends and identify potential entry and exit points for trades.
Unlike fundamental analysis, which focuses on the underlying economic factors that influence a security's value, technical analysis relies solely on the price and volume data of a security. This means that technical analysis can be used on any asset class that has a price chart available, including stocks, bonds, currencies, and commodities.
Technical analysis can be used for short-term trading or long-term investing. For short-term traders, technical analysis can help identify potential entry and exit points for trades based on the movement of price and volume data. For long-term investors, technical analysis can help identify the overall trend of a market or a specific asset class.
The key principles of technical analysis: price action, trends, and support and resistance levels.
The key principles of technical analysis are price action, trends, and support and resistance levels.
Price action refers to the movement of an asset's price over time, and it is the primary focus of technical analysis. Price action can be analyzed using different types of charts, including line, bar, and candlestick charts.
Trends refer to the direction of price movement, and they can be classified as uptrends, downtrends, or sideways trends. Identifying the trend of a market or a specific asset is an essential part of technical analysis, as it helps traders understand the overall direction of price movement.
Support and resistance levels are points on a chart where the price has historically tended to stop moving or reverse direction. Support levels are areas where buyers tend to enter the market, as they believe the price is low enough to represent good value. Resistance levels are areas where sellers tend to enter the market, as they believe the price is high enough to represent good value.
Different types of charts: line, bar, and candlestick charts.
Different types of charts are used in technical analysis, including line, bar, and candlestick charts.
A line chart connects the closing prices of an asset over a period of time with a line, providing a simple view of the overall trend. Line charts are useful for identifying the direction of the trend but do not provide much detail about the price movement within a specific period.
A bar chart shows the opening and closing prices of an asset, as well as the high and low prices during a particular period. Each bar represents a specific time period, such as a day or an hour. Bar charts provide more detailed information about price movements than line charts, as they show the price range for each period.
Candlestick charts display the same information as bar charts, but they use a visual representation of candles to convey price movements. Each candle represents a specific time period, and the color of the candle represents whether the price closed higher or lower than it opened. Candlestick charts provide a more detailed view of price movements than bar charts and are widely used by traders.

Mastering the Art of Technical Analysis (Part 1)Technical analysis is an essential tool for traders to analyze market movements and make informed trading decisions. Whether you are a beginner or an experienced trader, mastering technical analysis can greatly improve your trading performance.
We will explore the basics of technical analysis, the different types of charts and indicators, and how to use them effectively.
Understanding the Basics of Technical Analysis
- What is technical analysis and why is it important for traders?
- The key principles of technical analysis: price action, trends, and support and resistance levels.
- Different types of charts: line, bar, and candlestick charts.
Types of Technical Indicators
- Moving averages: Simple Moving Average (SMA) and Exponential Moving Average (EMA).
- Oscillators: Relative Strength Index (RSI), Stochastic Oscillator, and Moving Average Convergence Divergence (MACD).
- Volume Indicators: On-Balance Volume (OBV) and Chaikin Money Flow (CMF).
- Fibonacci Retracement and Extension Levels.
How to Use Technical Analysis for Trading
- Identifying trading opportunities using technical analysis.
- Setting up trading strategies using technical indicators.
- Understanding risk management and position sizing using technical analysis.
- Combining technical analysis with other trading techniques.
Technical analysis is a valuable tool that traders can use to make informed trading decisions. By understanding the basics of technical analysis and using it effectively, traders can increase their chances of success in the markets.

🛠️ Trading Tools Cheat SheetFibonacci Levels, Pitchfork, Fibonacci Arcs, Gann Square, Gann Fan, and Elliot Wave are technical analysis tools used in trading to identify potential levels of support and resistance, anticipate future price movements, and make informed investment decisions. These tools are based on mathematical calculations and relationships between price, volume, and time. They are widely used by traders to gain insights into market trends and make investment decisions based on past market data. However, it's important to note that these tools are not a guarantee of future performance and can produce false signals, so they should be used in conjunction with other forms of analysis and with a solid understanding of market dynamics.
🔹 Fibonacci Levels
A technical analysis tool that uses horizontal lines to indicate areas of potential support or resistance based on the Fibonacci sequence.
🔹 Pitchfork
A technical analysis tool that uses three parallel lines to identify potential levels of support and resistance and to anticipate future price movements.
🔹 Fibonacci Arcs
A technical analysis tool that consists of several curved lines that originate from two extreme points (high and low) and converge at the fibonacci levels.
🔹 Gann Square
A technical analysis tool that uses a grid to identify potential support and resistance levels and to predict future price movements based on the relationship between time and price.
🔹 Gann Fan
A technical analysis tool that uses diagonal lines to identify potential levels of support and resistance and to anticipate future price movements.
🔹 Elliot Wave
A technical analysis tool that tries to identify patterns in financial market data, particularly in stock market prices, which in turn can be used to make investment decisions. It's based on the idea that market prices move in predictable waves.
👤 @AlgoBuddy
📅 Daily Ideas about market update, psychology & indicators
❤️ If you appreciate our work, please like, comment and follow ❤️

The 4 Most Common Indicatorshello dear traders,
Here are some educational chart patterns that you must know in 2022 and 2023.
I hope you find this information educational and informative.
We are new here so we ask you to support our views with your likes and comments,
Feel free to ask any questions in the comments, and we'll try to answer them all, folks.
Trend traders attempt to isolate and extract profit from trends. The method of trend trading tries to capture gains through the analysis of an asset's momentum in a particular direction; there are multiple ways to do this. Of course, no single technical indicator will punch your ticket to market riches; in addition to analysis, traders also need to be well-versed in risk management and trading psychology. But certain strategies have stood the test of time and remain popular tools for trend traders who are interested in analyzing certain market indicators.
Moving Averages:-
Moving Averages:-
Moving Average is a technical analysis tool that smoothes price data by creating a continuously updated average price. On a price chart, the moving average forms a single, flat line that effectively eliminates any variation due to random price fluctuations.
The average is taken over a specific period of time—25 days, or any time period that the trader chooses. For investors and long-term trend followers, the 200-day, 100-day, and 50-day simple moving averages are popular choices.
There are many ways to use moving averages. The first is to look at the angle of the moving average. If it is moving mostly horizontally for an extended period of time, the price is not trending, it is ranging. A trading range occurs when a security trades between high and low prices consistently for a period of time.
If the moving average line is in an upward direction, then an uptrend is underway. However, moving averages do not make predictions about the future price of a stock; They simply reveal what the price is doing on average over a period of time.
Another way is to use crossover moving averages. By plotting the 200-day and 50-day moving averages on your chart, a buy signal occurs when the 50-day crosses above the 200-day. A sell signal occurs when the 50-day crosses below the 200-day.
When the price moves above the moving average, it can also be used as a buy signal, and when the price moves below the moving average, it can be used as a sell signal.
However, the price is more volatile than the moving averages, so this method is more prone to false signals, as shown in the chart above.
Moving averages can also provide support or resistance to the price.
Moving Average Convergence Divergence (MACD):-
Moving Average Convergence Divergence (MACD):-
The Moving Average Convergence Divergence (MACD) is a type of oscillating indicator. An oscillating indicator is a technical analysis indicator that oscillates over time within a band (above and below the centerline; the MACD oscillates above and below zero). It is both a trend-following and momentum indicator.
A basic MACD strategy is to look at which side of the MACD line is zero in the histogram below the chart. If the MACD lines are above zero for a sustained period of time, there is a possibility of an uptrend for the stock. Conversely, if the MACD lines are below zero for a sustained period of time, the trend is likely to be down. Using this strategy, potential buy signals occur when the MACD moves above zero, and potential sell signals when it moves below zero.
Signal line crossovers can also provide additional buy and sell signals. The MACD consists of two lines – a fast line and a slow line. A buy signal occurs when the fast line crosses through and above the slow line. A sell signal occurs when the fast line crosses through and below the slow line.
Relative Strength Index (RSI):-
Relative Strength Index (RSI):-
The Relative Strength Index (RSI) is another oscillating indicator, but its movement ranges between zero and 100, so it provides different information than the MACD.
One way to interpret the RSI is to view the price as "overbought" - and due to a correction - when the indicator is above 70 in the histogram, and to view the price as oversold - and due to a bounce - when the indicator is below 70. is 30.
In a strong uptrend, the price will often reach 70 and above for sustained periods of time. For a downtrend, the price may remain at or below 30 for a long period of time. While general overbought and oversold levels can sometimes be accurate, they may not provide the most timely signals for trend traders.
One option is to buy near oversold positions when the trend is up and short near overbought positions in downtrends.
For example, suppose the long-term trend of a stock is up. A buy signal occurs when the RSI crosses below 50 and then crosses back above it. Essentially, this means that the price has come down. Hence the trader buys when the pullback appears to be over (according to the RSI) and the trend is resuming. The 50-level is used because the RSI typically does not reach 30 in an uptrend unless a potential reversal is taking place. A short-trade signal occurs when the trend is down and the RSI moves above 50 and then moves back below it.
Trendlines or moving averages can help establish the direction of the trend and in which direction to take trading signals.
On-Balance Volume (OBV):-
On-Balance Volume (OBV):-
Volume is a valuable indicator in its own right, and on-balance volume (OBV) takes important volume information and compiles it into a single-line indicator. The indicator measures cumulative buying and selling pressure by adding volume on "up" days and decreasing volume on "down" days.
Ideally, the volume should confirm the trends. With an increasing price there should be an increasing OBV; With a falling price, the OBV should also fall.
If the OBV is rising and the price is not rising, it is likely that the price will follow the OBV in the future and start rising. If the price is rising and the OBV is flat-lining or declining, the price may be nearing the top. If the price is falling and the OBV is flat-lining or rising, then the price may be nearing the bottom.
The Bottom Line:-
In addition to providing trend trading signals and warnings about reversals, indicators can simplify price information. The indicators can be used on all time frames, and for the most part, they have variables that can be adjusted to suit each trader's specific preferences. Traders can combine indicator strategies - or come up with their own guidelines - so the entry and exit criteria for trades are clearly established.
Learning to trade indicators can be a difficult process. If a particular indicator appeals to you, you may decide to do further research on it. Most importantly, it is a good idea to test it before using it to trade live. And for those who have never actively traded before, it is important to know that opening a brokerage account is an essential first step in gaining access to the crypto market.
Trade with care.
If you like our content, please feel free to support our page with a like, comment
Hit the like button if you like it and share your charts in the comments section.
Thank you

#Head&Shoulder chart pattern in action
Head and shoulder definition: A simple head and shoulders top formation is characterized by a peak representing
the left shoulder, followed by a higher peak which is referred to as the head of the formation. A lower peak representing the right shoulder is found on the right‐hand side of the head. The head should be the highest peak in the formation. The neckline is a trendline that connects the troughs that lie on either side of the head. Necklines may be horizontal or inclined which in our case is inclined. In an inverted head and shoulders formation (also referred to as a head and shoulders bottom), the head is the lowest
trough within the formation.
Head and shoulder pattern completion: The head and shoulders formation is completed with a valid breakout of the neckline Until a valid penetration has occurred, the formation is regarded as merely tentative. But as you can see in our case the pattern is completed since we can see upside breakout of the chart pattern neckline.
Head and shoulder pattern target: The minimum one‐to‐one price objective or target for a head and shoulders top formation is simply the vertical distance between the head and the neckline projected downward from the neckline breakout level. For an inverted head and shoulders formation, the vertical distance is projected upward from the neckline breakout level. You can see this vertical line in the chart.
Head and shoulder pattern entry:
■■ Short at a break of the right shoulder’s uptrend line with a stop placed above the right shoulder or head (see Point 1 in Figure 13.9)
■■ Short at the peak of the right shoulder with a stop placed above the right shoulder or head, especially when there is a significant resistive confluence comprising of significant Fibonacci retracement levels, Floor Trader’s Pivot Point levels, and
psychologically important price levels associated with double and triple zeros
■■ Short at the right shoulder when it is testing the left shoulder’s resistance level, with a stop placed above the resistance level or head
■■ Short on a valid penetration of the neckline with a stop placed above the neckline, right shoulder, or head (see Point 2 in Figure 13.9)
■■ Short on a retest of the neckline after a valid penetration with a stop placed above the neckline, right shoulder, or head (see Point 3 in Figure 13.9)
■■ Short on the penetration of the price associated with the trough created by the retest action, with a stop placed above the trough, neckline, right shoulder, or head (see Point 4 in Figure 13.9)
i.postimg.cc
Source: the handbook of technical analysis by Mark Andrew Lim

Difference Between Technical Analysis And Fundamental AnalysisHello Hello Traders ,
Please if you like the ideas, don't forget to support them with likes and comments.
Thank you very much.
Here we go ,
I want to talk to your about the differences between Fundamental analysis and Technical analysis .
Defination,
Coin analysis is trying to make various predictions by examining the crypto money market and the price graph of the crypto money analyzed. By performing coin analysis, investors can anticipate risks and opportunities. In this way, investors can invest at the right time.
If the price change in cryptocurrencies is analyzed correctly, taking into account environmental factors, it can make a profit in the changing and high-risk crypto money market. It depends on the luck factor that traders make profit or loss before analysis.
How is Fundamental Analysis Done?
There is no need for learning to do basic analysis. All of us who follow the market instantly can make fundamental analysis. Because what counts in fundamental analysis is research and attention. While doing the basic analysis, the economic situation of the global market, popular entrepreneurs and the point of view of the countries with strong economy are taken into account. At the same time, political competition in the world, the Coronavirus Pandemic and financial efficiency are also evaluated in the fundamental analysis process.
How is Technical Analysis Done?
If you want to do technical analysis, you need to know the charts. The sub-headings of technical analysis can be listed as; It is also necessary to have sufficient knowledge of terms such as support points, resistance points, ascending-descending trend, ascending channel, descending channel.
Step 1 ,
For technical analysis, it is necessary to do market research first. There are important cases in the world in terms of economic and social aspects. This situation affects the markets as well as the prices of cryptocurrencies. One of the most important points of technical analysis is to know the supply and demand balance well. If demand increases, the price of cryptocurrencies rises. However, if the demand decreases and the supply increases, this time there will be a decrease in prices.
Step 2 ,
Patterns are very important during technical analysis. Formations are formed by graphics. It helps us to determine the support and resistance points of cryptocurrencies with formations such as double top formation and double bottom formation. In this way, we can see the end or start point of a value. Thus, the downtrend or uptrend of cryptocurrencies occurs.
Step 3 ,
Another important rule when doing technical analysis is indicators. Thanks to the indicators, we can identify the momentum and support/resistance points of the cryptocurrency. Indicators showing the connection between the two-way movements show us in which direction the medium and short-term trend may continue.
Conclusion,
In order to properly analyze coin, it is necessary to examine many factors and developments regularly and carefully. Examining one of the factors can make the trader profit, but it is most important to minimize the risk, to evaluate all the factors simultaneously. Even the trader who invests by considering all the data can make a loss as a result of a sudden development in the market. Despite all the techniques and predictions, the cryptocurrency market, like any investment, includes risk factors.
I really hope it will be useful for you.
Make big profits!

HOW TO USE TECHNICAL INDICATORS TO MAKE PROFITS IN TRADING
Always combine technical analysis with fundamental analysis
Successful traders always combine the two types of analysis. This is because technical analysis tends to focus on the past events and fundamental analysis focuses on the present and future issues.
In addition, there are certain situations where technical analysis will not provide adequate solutions. For instance, technical indicators are not programmed to predict the outcome.
In such situations, it is important to rely on fundamental analysis and avoid the market because no one knows the exact number and how the market will react.
Understand the indicators
It is also important to understand the indicators to use. Different one have different ways of analysis.
It is important for you to take time to learn these indicators and how they should set up. There are many learning materials which one can use to learn how the indicators work.
I recommend that you take at least 2 months to learn the indicators using a demo account before using real money.
Use Few Indicators
As stated before, many traders make the sad mistake of using very many indicators at a go. Always remember that two is a company, three is a crowd.
Traders who use more than two indicators at a go make mistakes because of poor visibility and poor market data interpretation.
Therefore, I recommend that you use at most 2 indicators per trade.
Patience
In day trading, patience is an important aspect without which no trader can make it. In fact, some indicators are usually require more time before their predictions can come true.
Following these tips, your indicator-trading will go to the next level.
Do you agree with all these tips?
Hey traders, let me know what subject do you want to dive in in the next post?

How to select effective indicators for your strategyNot all indicators are useful: most are not, and some are downright misleading. Previous posts and studies, such as LuxAlgo's(1), determined that effective indicators need to: 1) produce data to support the trader's decision-making process, not substitute it with automated strategies, 2) produce non-redundant infos. But how do you select indicators in practice? Here, I share my own step-by-step process to select effective indicators for your strategy.
My approach is to use a two-stages process: 1) Expansion, 2) Contraction.
This is the same process that happens in our brains when they develop, first there is neuronal and synaptic expansion, creating lots of new connections that are not necessarily efficient, then there is contraction, which weeds out useless, redundant or ineffective connections. Here, the idea is similar.
## Expansion: try all the indicators you want ##
In the first stage, you just try any indicator that sounds like an interesting idea. The way you select the indicators is up to you, either it can be because it sounds like a good idea, or because it's in line with your main strategy (eg, a volatility indicator when your strategy is contrarian).
Whatever criteria you choose, you should:
1) Remain open to new types of indicators potentially outside your main field, as they can broaden your horizons,
2) Remain skeptic of any claims of effectiveness until you test the indicators and see tha they work for yourself (in the second stage: contraction),
3) Study the indicator to understand how it works and why it works. Don't just blindly use an indicator without knowing what it actually represents precisely, otherwise you will get bit by its limitations and false positives at some point in the future, likely when you will have a lot of money on the table to lose!
Once you have selected a set of indicators, or if you have reached the maximum number of indicators you can add in your TradingView plan (as it happens to me!), then you can go to the next step to weed indicators out.
## Contraction: drop everything that isn't directly useful to you##
In the second stage, we will extensively test the indicators for ourselves, on the assets we are interested in, and in others as well, to "field test" them and see if they work in our strategy. Indeed, trading and investment rely on a balance between collecting enough infos and keeping it simple enough (KISS principle(2)) to support our systematic decision-making process, without information overload which can produce decision paralysis.
The contraction/filtering process is more involved than the first stage, because you have to do the manual, dirty work of testing, it takes time, but this is the only way you can see whether the indicator work as intended and that they work for you. No two people will use the same indicator the same way as I explain in another post (3), so bear in mind that some indicators that may not work for someone else may work for you, and inversely an indicator that works for someone else's strategy may not for you, so the popularity of an indicator is no indication of effectiveness.
Here is a step-by-step outline of my process, feel free to add more steps depending on your needs:
1) Signal-to-Noise test: test on weekly and daily. If the indicator can't be reliable, can't produce good signals with low false positives and high true positives on these long timeframes that are much less noisy than shorter timeframes, then they are useless. Some people claim that there are indicators that work exclusively on lower timeframes, I am not trading such smaller timeframes although I can trade down to 15min, so your mileage may vary, but I remain yet to be convinced that this is true.
2) Redundancy test. If you already found a good indicator that works reasonably well for you, then compare any new indicator to this "best" indicator as a benchmark reference point. This will allow to weed out indicators that cannot provide new, non-redundant data. For example, in the chart of this post, I study correlations, which I compare against the signals generated by my RSI+ (alt) indicator which I consider one of my most reliable. Of course, the signal is of a different kind, but it still provides me a reference point as to whether the correlations can provide me with an additional edge or whether I should just stick to using only the RSI+ indicator. In practice, if the new indicator(s) can provide new, non redundant data, as shown by slightly different predictions in different scenarios or maybe a bit earlier, then great, I keep them. If not, for example the indicator does provide reliable info but it would lead me to take the same decisions at the same time, or worse, later than my best indicator, then I remove it.
3) Generalizabiliy test. Test on multiple markets, on mutiple timeframes, to check generalizability: if it doesn't generalize, the model is overfit on one target market's history, and this likely won't even work for the future if this same market, ie, this is an issue often encountered for models made specifically for bitcoin or ethereum.
4) Misleading test. Use bar replay, to check how the indicator behaves in realtime: does it sprout a lot of false positive in realtime, or is it as useful and predictive, or better, in real-time than when used for historical bars? Or worst being repainting indicators rewriting the past, such as pivots or zigzag, they look super accurate aposteriori but it's only because they cheat (see tradingview pinescript fage about that), using bar replay will help you detect them 100% of the time. Bar replay is one of the best tools you have to test indicators, don't underestimate it. Yes, it's time consuming, but it's well worth it, and you'll become quicker and quicker to use it over time with experience. For more information about the different types of repainting indicators, there is an excellent article in the PineScript documentation, it's worth reading even for non-coders(4).
5) Grouping and intra-class comparison. Finally, group indicators on the same study, so you can quickly answer a question eg about volume and volatility, or about market cycles, etc by checking the adequate chart. Otherwise, if you mix indicators between different charts, it will take you longer to analyze and compare the various signals. Also this allows to compare similar indicators between them to see if they really are useful, non-redundant. For example, in the chart above, it's a Correlations grouped study, so I added almost exclusively correlations indicators; while the delta-agnostic and (pearson) correlation coefficient both provide non-redundant infos, Spearman correlation and Kendall correlation indicators are redundant, although they shouldn't (they should capture non-linear relationships, whereas Pearson can only capture linear ones), their results aren't any different in practice with the pearson correlation coefficient in terms of significant signals they generate that would change my decision process, so we could drop two out of these three correlation coefficients, which would unclutter our chart without losing any data.
## Wrapping-up: continually refine your indicators ##
At the end of the day, it's important to continually try to adapt to the markets. Indicators can continue working, while others may fail, or in the end you find them too difficult to use in practice with your strategy. Your strategy may also evolve over time, and so your indicators should too. Don't ever feel attached to your indicators, you can revisit and question their utility at anytime, and you can go through the steps above again, and drop any indicator at anytime, even if they were useful before, what matters is whether they are still useful now.
There is also a next step for those who are open to learn programming: creating your own indicators. Not so much to create unique opportunities, although they might, but to better understand the market. You should view indicators as a way to better understand some facet of the market, indicators answer the specific questions their authors wanted to find an answer for. So by using indicators of other authors, you are reading the solutions to others questions. But you can also form your own questions, and then the next logical step is to develop your own indicators to find your own answers. And hopefully share them under open-source, so that we can all learn together (and this likely won't impact your profitability, to the contrary, as I explain elsewhere!(3)).
In summary, we can quote Bruce Lee, who described a very similar process for his mastery of martial arts as he taught his own named Jeet Kune Do:
"Absorb what is useful, reject what is useless, add what is essentially your own."
I hope this post was useful to you, and if you have an idea of a criterion or a step you use to select indicators that I didn't list above, please share it in the comments!
Enjoy, Trade Safely!
Tartigradia
(1): Technical indicators: what is useful and what isn't , by LuxAlgo
(2): en.wikipedia.org
(3): Why my indicators are open-source, and why yours should be too , by Tartigradia
(4): Repainting — Pine Script™ v5 User Manual v5 documentation

Educational Series: Trading with Bollinger Bands (Part 3)The last feature of the Bollinger Band involves a slight addition to the standard indicator. Another set of Bollinger Band is added, but this time, a 0.75 standard deviation is used (instead of the 2 standard deviations).
The 0.75 standard deviations Bollinger Band is indicated by the black lines.
Now, look at the space between the 2 standard deviations and 0.75 standard deviations Bollinger Band. This is indicated by the white space. When price trades within the white space, I'd call it the Bollinger Trend.
What you should notice is that
- When the price trades within the white space, it enters into a trending scenario.
- A dynamic channel is formed, with the Bollinger Bands providing the diagonal support/resistance levels.
- When the price breaks through the 0.75 standard deviation Bollinger Band and moves towards the moving average, the trend ceases.
The Bollinger Trend is not easy to use UNLESS
- You pair it with key support/ resistance level
- Apply this only to the H1 or H4 timeframe
- Deploy a trailing Stop Loss, BUT Take Profit must be fixed

Educational Series: Trading with Bollinger Bands (Part 2)The Bollinger Reversal is my absolute favorite and most valuable perspective of the Bollinger Bands.
Have you ever
- seen the price move strongly in a direction, but the moment you get into a trade, the price reverses almost immediately?
or
- held on to a profitable trade, hoping to hit a take-profit level, only to see your profits whittle away as the price reverses.
The Bollinger Band can help prevent
1) FOMO leading to Late Entry and
2) Greed leading to Late Exit
Look at the yellow spots on the charts
- The spots indicate when the price had traded outside of the 2std deviation of the Bollinger Band (either the lower or the upper bound).
- When the price trades outside of the Bollinger Band, two things are highly likely to happen :
1) the price reverses back before the current candle loses , leading to possibly the development of a pin bar (which usually signals a strong reversal candlestick pattern).
2) the price closes outside of the Bollinger Band and the subsequent candle is a strong retracement , back toward the Moving Average and possibly a stronger reversal.
The Bollinger Reversal can be applied to ANY timeframe (M1 through to D1)
When the price is outside of the Bollinger Band, you should choose to avoid entering a trade , as the price is likely to reverse. And if you are currently in a trade, and the price has broken out of the Bollinger Band, you might want to consider securing the profit .
However, some more aggressive traders could even choose to trade the short-term reversal.
Remember....
- This is a technical indicator. You shouldn't use technical indicators solely.
- Combine it with other forms of analysis, Price Action, Fundamental Analysis, Sentiment, and Other types of indicators.
The more confluences you can have, the more confidence you will have

Educational Series: Trading with Boxes (Part 2)Remember from Part 1, that boxes
- identify momentum
- is trend-following
- is reactionary, and does not predict or anticipate a move.
In addition to using boxes to identify support/resistance levels, we can use boxes to identify breakout levels.
Breakout levels are identified when the price breaks from a previous day's low/high. If the price breaks from the low/high of multiple days, then you can expect a more significant move in that direction.
In Example 1:
- Price rejects the resistance level (formed by the confluence of 2 previous day's high)
- Breaking below the previous day's low
- Selling opportunity, SL beyond the box high, TP at the lower support level formed by the confluence of 2 box lows.
In Example 2:
- Price rejects resistance level (formed by the confluence of 4 previous days' high)
- Breaking below the previous day's low
- Selling opportunity, SL beyond the resistance level, TP at the lower support level, formed by the confluence of 2 box lows.
Note: In this case, the Risk:Reward ratio is lower than 1.
When using boxes, because it is reacting to price, it can have a tendency to be slightly lagging.
It is always a good practice to combine at least 2 different types of indicators in your analysis.
