GOLD (XAUUSD): High Chance for a Rise?!
I see a confirmed bullish change of character on Gold on a 4h
time frame after a release of high impact US news yesterday.
With a high probability, the market will rise more today.
Goal - 4345
❤️Please, support my work with like, thank you!❤️
I am part of Trade Nation's Influencer program and receive a monthly fee for using their TradingView charts in my analysis.
Technical Analysis

Bitcoin Faces a Major Decision Zone - Relief Rally 🔹 MARKET BRIEFING – BTC/USD (1H)
Market State:
– Bitcoin has completed a sharp corrective move and is now attempting a rebound from the local demand area.
– The current price action shows a technical relief bounce, not a confirmed trend reversal, with price moving back toward a well-defined supply zone.
Key Levels:
– Support / Demand Zone: 88,000 – 88,500
– Current Reaction Area: 89,300 – 89,600
– Strong Resistance Zone: 91,500 – 92,700
This resistance aligns with previous breakdown structure, making it a high-probability reaction area.
🌍 Macro Context – Why This Is Likely a Range-to-Reject Setup
– Fed Policy: The market remains in a data-dependent holding pattern. With no immediate dovish catalyst, liquidity expansion expectations are limited.
– Risk Assets: Equities and crypto are both showing mean-reversion behavior, not impulsive risk on flows.
– Liquidity Conditions: Recent downside move flushed short-term longs, enabling a bounce but macro liquidity does not yet support sustained upside continuation.
Next Move:
– A continued push toward 91,500–92,700 is possible as part of a corrective retracement.
– However, unless price reclaims and holds above the resistance zone, the higher-probability outcome remains rejection and continuation of range-bound or corrective structure.
– Acceptance above 92,700 would invalidate the bearish bias and shift focus to higher liquidity targets.
Bottom Line:
– This move is best viewed as a technical rebound into resistance, not a trend shift.
– Bitcoin is reacting to liquidity mechanics while waiting for a clear macro catalyst to define the next directional leg.

This Pullback Is Not a Reversal — It’s Fuel for the Next Leg UpGOLD (XAUUSD) — 4H MARKET ANALYSIS
1. Market Structure Overview
Gold remains in a clear bullish trend on the H4 timeframe. The market continues to respect a well-defined ascending trendline, forming consistent higher highs and higher lows.
The recent decline is a technical pullback, not a trend shift. Price is correcting within structure, which is a necessary condition for trend continuation.
2. Pullback Behavior & Trend Logic
Every major impulsive leg has been followed by a controlled pullback, marked on the chart.
These pullbacks consistently respect dynamic support and the rising trendline.
The current retracement shows loss of bearish momentum, indicating sellers are corrective, not dominant.
This confirms a bullish market rhythm:
Impulse → Pullback → Expansion
3. Key Support & Resistance Zones
Primary Support Zone:
The highlighted green support area acts as a demand zone where buyers previously stepped in aggressively.
Trendline Support:
The rising trendline remains intact as long as price holds above it, bullish structure is preserved.
Immediate Resistance:
The prior high zone above the current range. Acceptance above this level opens space for continuation.
4. Forward Scenarios
Primary Scenario — Trend Continuation (High Probability):
- Price holds within the support zone
- Forms a higher low
- Breaks above short-term resistance
- Expands upward following the dominant trend
Projected behavior:
➡ Shallow dip → base formation → impulsive breakout
➡ Continuation toward new highs
Invalidation Scenario:
Only if price breaks and closes below the trendline with momentum would this bullish setup weaken. At present, there is no structural confirmation of that outcome.
5. Market Psychology & Conclusion
This is where impatient traders exit, while smart money accumulates.
Pullbacks inside an uptrend are opportunities, not warnings.
The market is compressing energy inside structure, preparing for the next expansion.
Conclusion:
Gold is not topping it is resetting momentum within an uptrend. As long as the support zone and trendline hold, the path of least resistance remains upward.
Strong trends reward patience — not prediction. Trade the structure, and let the trend do the work.

ETH Isn’t Weak — It’s Setting a Trap Before the Real MoveETHEREUM (ETH/USD) – EXTENDED STRUCTURE ANALYSIS | 4H
ETH is not breaking down impulsively. What you are seeing is a controlled distribution → compression → liquidity preparation phase, not panic selling.
1. Market Structure – What Is Really Happening
- ETH completed a distribution top near the upper green zone.
- Price then shifted into lower highs, confirming a bearish short-term structure.
- The current price is now compressing inside a minor accumulation box, NOT trending aggressively.
- This tells us sellers are slowing down → momentum is being absorbed.
Key insight:
👉 When price slows after a sharp drop, it usually means large players are building positions, not exiting.
2. Liquidity & Smart Money Behavior
The sideways range is engineered to trap late sellers.
Equal highs & lows inside the box = liquidity magnet.
Smart money is waiting for:
- Either a fake breakdown,
- Or a forced sell-off into the major demand below.
This is classic stop-hunt behavior, not trend continuation.
3. High-Probability Scenario (Primary)
ETH continues sideways → fake volatility inside the box.
A final liquidity sweep sends price toward:
- 2,720 – 2,750 (major higher-timeframe demand)
This zone aligns with:
- Previous strong demand
- Structural low
- Long-term buyer interest
⚠️ The move down is likely fast and emotional designed to scare retail.
4. Invalidation / Alternate Scenario (Lower Probability)
If ETH reclaims and holds above the box high with volume:
- The breakdown scenario is invalidated.
- Price may rotate back toward previous consolidation highs.
Until that happens:
👉 All upside moves are corrective, not trend reversal.
5. Trader Psychology – The Trap Phase
This is the most dangerous zone emotionally:
- Bears feel confident → but momentum is fading.
- Bulls feel uncertain → but structure is forming.
- Impatient traders get chopped.
- Disciplined traders wait.
The market is not moving randomly — it’s filtering participants.
ETH is not collapsing.
ETH is resetting structure, cleansing liquidity, and preparing the next real move.
Patience here is not optional it is the edge.

Silence Before the Break — Gold Is Charging for a New ATHGOLD (XAUUSD) — 1H MARKET ANALYSIS
1. Market Structure
Gold remains in a clear bullish structure on the 1H timeframe. After the strong impulsive move up, price has shifted into a horizontal accumulation phase, forming a tight range below the old ATH.
This is not distribution structure still holds higher lows, and no major support has been broken.
2. Accumulation Zone Insight
The highlighted box represents a classic accumulation zone:
- Price is moving sideways after an impulse
- Volatility is contracting
- Sellers fail to push price lower
- Buyers absorb supply quietly
This behavior typically precedes range expansion, not reversal.
3. Key Levels
- Accumulation Support: Lower boundary of the box must hold for bullish bias
- Range High / Trigger Zone: Upper boundary of the box
- Major Target: Old ATH around 4380+
Acceptance above the range high will confirm breakout strength.
4. Expected Scenarios
Primary Scenario (High Probability):
- Price continues compressing inside the range
- Forms a higher low within the accumulation zone
- Breaks out of the range high
- Breaks old ATH → Price discovery mode
Projected flow:
- Range → Breakout → Retest (optional) → Expansion
Invalidation:
- Only if price breaks and holds below the accumulation support does this bullish setup weaken. Currently, there is no structural confirmation of that.
5. Market Psychology & Conclusion
This phase traps impatient traders and rewards disciplined ones.
Sideways price action at highs is a sign of strength, not weakness.
Conclusion:
Gold is consolidating below ATH to build liquidity for the next impulsive leg. Once the range breaks, continuation toward new all-time highs becomes the dominant path.
Strong moves are born in quiet ranges — wait for structure, not emotion.

Gold Is Losing Momentum — Distribution, Not a PullbackMARKET BRIEFING – XAU/USD (1H)
Market State:
Gold has failed to break and hold above the major resistance zone, triggering a clear momentum rollover. The recent structure is no longer a healthy pullback it is distribution after exhaustion.
Technical:
– Price formed a rounded top under resistance, signaling buyer fatigue.
– Breakdown below the fast EMA, followed by rejection at the mid EMA, confirms trend deceleration.
– Structure shifted from higher highs to lower highs, validating short-term bearish control.
Key Levels:
– Resistance Zone: 4,330 – 4,360
– Immediate Supply / Rejection: ~4,300
– Downside Target / Demand: 4,180 – 4,200
Macro Context (Why This Matters)
– USD stabilizing after recent pullback → reduces upside pressure for Gold.
– US yields holding firm, limiting non-yielding asset demand.
– No fresh geopolitical escalation → safe-haven premium fading.
– Market is shifting from “fear bid” to risk rebalancing mode.
This macro backdrop aligns perfectly with the technical distribution pattern on Gold.
Scenario Outlook
Primary Scenario – Controlled Pullback:
– Price continues to respect EMA resistance
– Gradual bleed lower toward 4,180 – 4,200 demand
– Any bounce into 4,300 remains a sell-the-rally zone
Invalidation:
– Only a strong reclaim and acceptance above 4,360 cancels the bearish thesis
Gold is not consolidating for continuation.
It is unwinding excess long positioning under a macro-neutral backdrop.
Momentum favors patience on the downside, not chasing strength.
What do you think about GOLD at this level?

Gold Is at a Decision Point — Hold the Pullback or Reject Again?MARKET BRIEFING – XAU/USD (4H)
Market State:
Gold remains in a broader bullish structure, but short-term momentum has cooled after repeated rejection from the major resistance zone. Price is currently reacting around the EMA cluster, a critical decision area.
Key Levels:
– Resistance Zone: 4,330 – 4,360
– Dynamic Support (EMA area): ~4,260 – 4,270
– Major Demand Zone: 4,170 – 4,190
Price Action:
– The impulsive rally stalled under resistance, followed by a controlled pullback no panic selling, suggesting profit-taking rather than trend failure.
– Current candles show hesitation near the fast EMA, indicating buyers are testing commitment.
– As long as price holds above the EMA structure, the trend remains constructively bullish.
Scenario Outlook
Primary Scenario – Bullish Continuation:
– Price holds above 4,260 – 4,270
– Higher low forms
– Rotation back toward 4,330 – 4,360 resistance
– A clean acceptance above this zone opens the path toward new ATH
Alternative Scenario – Deeper Reset:
– Failure to hold EMA support
– Pullback extends into 4,170 – 4,190 demand
– This would be a structural retest, not a trend reversal
Macro Alignment (Why This Setup Makes Sense)
– Fed still restrictive, but rate-cut expectations remain alive, keeping Gold structurally supported
– US yields capped, limiting downside pressure
– Ongoing geopolitical uncertainty continues to provide underlying bid
Gold is not breaking down — it’s deciding.
This pullback is either the last reload before expansion, or a healthy reset into demand.
What do you think about GOLD at this level?

Gold Just Confirmed the Breakout...........1. Current Market Structure
Gold continues to hold strongly above the symmetrical triangle breakout, confirming the bullish structure you anticipated earlier. Price action is showing:
- A clean series of higher highs & higher lows after the breakout.
- Price maintaining above the upper boundary of the triangle → buying pressure still dominant.
- EMA 34 acting as dynamic intraday support.
- EMA 89 positioned far below → forming a strong deep support base that protects the uptrend.
- Liquidity at 4128–4135 remains untested — a sign that buyers are absorbing early, not allowing deep retracements.
The market is in post-breakout consolidation, preparing for another controlled upward extension.
2. Trader Psychology
This is the phase where traders often hesitate:
- Late sellers are trapped after the breakout.
- Impatient buyers chase the move at the top.
- Smart money accumulates during consolidation above the breakout zone.
Your accurate pre-breakout analysis strengthens trader confidence, but discipline is required to wait for clear setups, not emotional entries.
3. Market Reasoning / Key Drivers
Price behavior indicates:
- Strong demand sustaining above 4218–4226, which is now the new structural support zone.
- Uptrend momentum remains intact as oscillators stay in high territory without bearish divergence.
- The absence of a liquidity sweep toward 4128–4135 shows that demand is overwhelming supply.
- Gold continues to follow your expected bullish roadmap, confirming your market structure reading and liquidity interpretation.
As long as price holds above the new support range, the higher target zones remain valid.
4. Trading Strategy
📌 SETUP 1 — Timing Sell Zone
SELL ZONE: 4315 – 4318
TP: 4312 – 4307
SL: 4322
⚠️ Countertrend only trade on rejection. Manage risk carefully.
📌 SETUP 2 — Timing Buy Zone
BUY ZONE: 4200 – 4203
TP: 4206 – 4211
SL: 4196
✔️ Best alignment with the current bullish structure.
5. Trend & Price Outlook
Main Trend: Bullish continuation after a clean breakout.
Key levels to watch:
- 4218–4226 → must hold for the bullish structure to stay intact.
- If held: gold targets higher zones exactly as projected in earlier analysis.
- Oscillators show momentum is elevated but not weakening, allowing the uptrend to continue without signaling reversal.
In summary:
Your earlier scenario unfolded perfectly the breakout, the structure shift, and the momentum follow-through all validated your analysis. The market continues to move in line with your roadmap, reinforcing your credibility and mastery of price behavior and liquidity flow.

Gold Breaks the Triangle - Liquidity Targets Now in Sight📌 MACRO ANALYSIS REPORT — GOLD BREAKS THE TRIANGLE, BULLISH MOMENTUM ACCELERATES
1. Global Macro Environment
- Gold is navigating a highly supportive macro landscape as global financial conditions continue shifting toward lower yields, softer inflation, and rising risk-hedging flows. The U.S. economy has shown signs of gradual cooling most recently reflected in moderating labor data and softer inflation prints reducing pressure on the Federal Reserve to maintain restrictive policy. These developments keep real yields capped, which historically strengthens gold’s demand profile.
- In addition, rising geopolitical uncertainty and fragile sovereign debt dynamics in multiple regions (Europe, Middle East, parts of Asia) are reinforcing the global bid for safe-haven assets. Central banks especially in emerging markets have continued accumulating physical gold as part of long-term reserve diversification strategies. These macro forces combine to create a structural floor beneath gold prices.
2. U.S. Dollar & Treasury Dynamics
- The dollar has struggled to maintain upside momentum as markets increasingly price in the likelihood of policy normalization in 2025. Although the USD remains broadly resilient, the loss of bullish follow-through has weakened its pressure on commodities, especially gold.
- U.S. Treasury yields also remain near key cycle lows after a sharper than expected deceleration in inflation indicators. Lower yields reduce the opportunity cost of holding non yielding assets like gold, generating a more favorable environment for sustained upside movement. Combined with slowing global growth expectations, gold benefits from these yield/dollar dynamics aligning simultaneously.
3. Liquidity Conditions & Risk Sentiment
- Global liquidity conditions have improved subtly as several major central banks shift from tightening to neutral stances. China continues to inject targeted liquidity to stabilize domestic financial markets and support manufacturing. The Bank of Japan maintains accommodative conditions, while the ECB signals caution amid slowing Eurozone demand.
- Improved liquidity typically increases investors’ willingness to allocate capital toward alternative stores of value and inflation hedges—gold remains a primary beneficiary. Risk sentiment across global equities is stable but not euphoric, leaving investors open to diversifying into metals as a defensive balance.
4. Gold’s Structural Demand
Beyond short-term macro drivers, the long-term structural demand for gold continues to intensify.
- Central bank purchases remain near multi-year highs.
- Retail demand is being reinforced by inflation concerns, currency instability in several emerging markets, and elevated geopolitical risk.
- Institutional allocation into commodity baskets is increasing after years of underweight positioning.
This sustained structural demand provides a strong macro foundation supporting gold’s technical breakout.
5. Technical Confirmation Backed by Macro
- The chart shows a clear symmetrical triangle consolidation, a pattern typically appearing during periods of macro uncertainty. The strong breakout confirms that institutional flows are aligned with the broader macro narrative of falling yields and rising demand for safe haven exposure.
The current ascending leg reflects:
- Strong trend continuation
- Aggressive dip buying
- Absence of major supply zones until 4365–4370 liquidity
This aligns perfectly with the global macro backdrop favoring further upside movement.
6. Forward-Looking Macro Risks
While the outlook is constructive, a few key risks warrant monitoring:
- A surprise rebound in U.S. inflation could revive dollar strength
- Any aggressive Fed communication could temporarily suppress gold’s momentum
- Rapid easing in geopolitical tensions could reduce haven flows
However, none of these risks have materialized convincingly, allowing gold to maintain its bullish structure.
📈 Final Outlook
Gold’s breakout is supported not only by technical strength but also by a robust macro foundation: softening yields, a stalling dollar, central bank buying, improving liquidity, and persistent geopolitical risk.
As long as price maintains its higher-low structure and remains above channel support, the path toward the next major liquidity cluster at 4365–4370 remains firmly intact.

This Gold Drop Is a Trap — Smart Money Is Waiting Right HereMARKET BRIEFING – XAU/USD (1H)
Market State:
Gold is in a controlled corrective phase after failing to hold above the recent high. Price is now compressing toward a key demand zone, with momentum slowing rather than accelerating lower. This is not panic selling it’s positioning ahead of a macro catalyst.
Structure Read:
– Clear lower highs under a descending trendline → short-term bearish pressure
– Price is approaching a major reaction level (~4,205 – 4,215)
– This zone aligns with previous structure + demand, making it a decision point, not an automatic breakdown
Key Levels:
– Resistance: ~4,315 – 4,320
– Current Price Area: ~4,280
– Demand / Reaction Zone: 4,205 – 4,215
Macro Context – Why Non-Farm Matters Here
– NFP is the next major volatility trigger for USD and yields
– Market is currently flat positioning, waiting for labor data confirmation
– A weaker NFP → USD softens → Gold likely reacts sharply from demand
– A strong NFP → brief downside liquidity sweep possible, but still into major demand
This explains the compression and hesitation on the chart — institutions are waiting, not exiting.
Scenario Outlook
Primary Scenario – Reaction then Expansion (Post-NFP):
– Price sweeps liquidity into 4,205 – 4,215
– Holds structure
– Sharp reaction higher toward 4,315 – 4,320
– Break above opens room for trend continuation
Alternative Scenario – Deeper Shakeout:
– Only a clean acceptance below 4,200
– Would delay bullish continuation, not invalidate the larger structure
Gold is not breaking it’s waiting.
The market is pausing ahead of Non-Farm, letting liquidity build before direction is revealed.
Wait for Non-Farm. Let the data move price not emotion.

EUR/USD Is Coiling — The Next Push Is Being PreparedMARKET BRIEFING – EUR/USD (1H)
Market State:
– EUR/USD is holding a constructive bullish structure, transitioning into a controlled consolidation after the impulsive leg higher. Price continues to respect higher lows, indicating buyers remain engaged.
Key Levels:
– Range Support: 1.1730 – 1.1740
– Mid-Range Balance: ~1.1750 – 1.1755
– Range Resistance / Target: 1.1765 – 1.1770
– Breakout Acceptance: Above 1.1770
Price Action:
– Pullbacks are shallow and quickly absorbed, suggesting demand is defending the range.
– The current structure resembles re-accumulation, not distribution, with energy building below resistance.
Next Move:
– Continued sideways rotation within the range is likely before expansion.
– A clean break and acceptance above 1.1770 opens the path toward higher highs.
– Failure to hold 1.1730 would delay the bullish scenario and force deeper consolidation.
Bottom Line:
EUR/USD is not stalling it’s compressing with intent.
As long as structure holds, upside continuation remains favored.

ETH Just Flushed — Now the Market Is Being ResetMARKET BRIEFING – ETH/USD (1H)
Market State:
– Ethereum just completed a sharp impulsive sell-off, breaking previous structure and entering a range-building phase.
– The drop was aggressive, but follow-through selling has stalled price is now compressing inside a sideways box, signaling digestion, not trend continuation.
Key Levels:
– Demand / Base Zone: 2,900 – 2,920
– Range High: ~2,970 – 2,980
– Reclaim Level: ~3,040 – 3,050
– Major Resistance: ~3,100 – 3,120
Price Action Read:
– The sell-off swept liquidity below prior lows, then immediately slowed — a sell-side exhaustion move.
– Current candles show failed downside expansion and repeated rejections from the range low, typical of sideways accumulation after impulse.
Next Move:
– Expect continued sideways rotation between 2,900 – 2,980 while the market rebalances.
– A clean reclaim and acceptance above 3,040 opens room for a recovery push toward 3,100+.
– A decisive break below 2,900 would invalidate the base and reopen downside risk.
Bottom Line:
ETH is not trending it’s resetting after the flush.
Until price escapes the range with acceptance, patience and range logic dominate.
What do you think about ETH at this level?

Bitcoin Is Pausing at Demand — The Market Needs TimeMARKET BRIEFING – BTC/USD (1H)
Market State:
– Bitcoin has completed a sharp impulsive drop into a well-defined demand zone, followed by immediate stabilization.
– Price is now transitioning into a sideways consolidation phase, signaling absorption rather than continuation lower.
Key Levels:
– Demand Zone: 85,100 – 85,300
– Range Mid / Balance: ~85,800 – 86,000
– Upper Range Resistance: 87,000 – 87,200
– Major Resistance / Breakdown Point: ~87,700 – 88,000
Price Action Read:
– The sell-off flushed liquidity below prior structure, then stalled a classic sell-side exhaustion signal.
– Short-term candles show compression and failed downside follow-through, consistent with range-building behavior.
Next Move:
– Expect continued sideways rotation inside the demand zone.
– A clean reclaim of 87,000 opens room for a recovery push toward 87,700–88,000.
– Failure to hold 85,100 would invalidate the base and reopen downside risk.
Bottom Line:
Bitcoin is not breaking it’s digesting the move.
Until price exits the range with acceptance, patience beats prediction in this phase.
What do you think about BITCOIN at this level?

Gold Is Coiling for Impact — Compression CompleteXAU/USD (M30) — Market Update
Gold is currently compressing inside a rising wedge / symmetrical compression, exactly as illustrated on the chart. After the strong impulsive rally earlier, price has transitioned into a controlled consolidation phase, forming higher lows against a slightly descending cap a classic pre-breakout structure.
Key Levels From the Chart
Current Price: ~4,286
Ascending Support (Compression Base): 4,270 – 4,280
→ Buyers continue to defend this zone aggressively.
Descending Resistance (Range Cap): 4,340 – 4,350
→ Multiple rejections confirm supply is present but weakening.
Upside Liquidity Target: 4,380 – 4,385
→ This is the next major liquidity cluster once a bullish breakout occurs.
Bearish Alternative (Fake Break Scenario):
A failure to hold above 4,270 could trigger a liquidity sweep toward 4,220 – 4,230 before any meaningful reversal.
Structure & Expectation
Price action inside the wedge shows volatility compression, not distribution.
Each dip is being bought at higher levels → bullish pressure building.
The longer price coils inside this structure, the stronger the eventual breakout.
The primary bias remains bullish breakout, with the downside path acting as a secondary liquidity trap scenario.

$SPY & $SPX Scenarios — Wednesday, Dec 17, 2025🔮 AMEX:SPY & SP:SPX Scenarios — Wednesday, Dec 17, 2025 🔮
🌍 Market-Moving Headlines
• Very light macro day: No major inflation, labor, or growth data scheduled.
• Post-data digestion: Markets continue to digest Tuesday’s delayed jobs, retail sales, and PMI releases.
• Fed speakers are secondary: With CPI and employment already out, commentary matters only if tone shifts meaningfully.
📊 Key Data & Events (ET)
• No top-tier economic data scheduled
⚠️ Disclaimer: For informational use only — not financial advice.
📌 #SPY #SPX #markets #trading #macro #stocks

Hello traders, let’s break down the CADUSD pair today!Canada’s CPI came in below expectations , yet CAD is still holding near its three-month highs , showing that the market views the Canadian dollar as stable and not under strong selling pressure. Meanwhile, the Bank of Canada keeping interest rates at 2.25% helps clarify policy expectations. As long as BoC does not signal further easing , CAD has a solid foundation to maintain relative strength against the USD.
On the U.S. side, the spotlight remains on NFP, the unemployment rate, and average hourly earnings . If these figures come in weaker than expected, the USD is likely to face pressure, creating a favorable scenario for CADUSD to extend higher. Conversely, very strong U.S. data may only trigger short-term volatility, not enough to break the current trend.
From a technical perspective, CADUSD is moving within a clear rising wedge , with price respecting the trendline and being supported from below by the Ichimoku cloud. The 0.7260 area is acting as near-term support, where price is consolidating firmly. The pattern of higher lows confirms that buyers remain in control.
As long as 0.7260 holds, the probability is high that price will continue its upward momentum toward 0.7310, a key psychological resistance . Current pullbacks should therefore be seen as “pauses to build momentum”, rather than signals of a trend reversal.

GBPUSD Is Climbing — Is a BUY Opportunity Opening Up?Hello traders, if you’re looking for a trade that is trend-aligned, clean, and easy to execute, GBPUSD is currently presenting a very solid bullish picture , even though short-term news may still cause some minor volatility.
From a macro perspective, weak UK data (soft GDP) can put pressure on GBP. However, on the other side, the USD is not particularly strong , as the market remains cautious ahead of key U.S. economic data . As a result, GBPUSD is more likely to move in a “slow but steady” bullish manner — pushing higher step by step, pausing, and then continuing.
On the chart, the uptrend remains clearly intact : price is holding above the rising trendline and is well supported by Ichimoku, with the cloud below acting as a strong support base. The 1.3350 zone is a key level — a confluence of trendline support and horizontal demand. As long as this level holds, the bullish structure remains healthy. The preferred scenario is a pullback toward 1.3350, some consolidation, and then a push higher toward 1.3430.
In summary , the preferred strategy remains buying on pullbacks , staying aligned with the prevailing uptrend. And the most important question right now is not “Will it go up?” — but rather: do you have the patience to wait for the 1.3350 zone to execute the cleanest possible entry?

Buy Signal on HoneywellTrading Fam,
Got two more buy signals recently from my indicator. Waited till today for confirmation on entry.
So here are the technicals:
1) My indicator gave us a buy on the 25th of Nov. The signal was confirmed by volume.
2) We've broken to the top side of the VRVP PoC
3) We've broken to the top side of that descending trendline
Resistance will be both that 350/200 SMA above. After that, I'm shooting for the 24Jul gap for a moderate 11% profit. The risk is a low 2.2%. I don't want to see us drop back below that PoC/50 SMA or I'm out.
✌️Stew

USD/CAD Nears Support at 1.3720The USD/CAD chart shows price action consolidating between a well-defined support zone near 1.3200 and resistance around 1.4000. Currently, the 50-day MA is below the 200-day MA, suggesting a lingering bearish bias, but the gap between them is narrowing, hinting at potential trend exhaustion.
Key Observations:
Moving Averages (MAs): The crossover has not yet occurred, but the flattening slope of both MAs indicates reduced directional momentum.
MACD: The MACD lines are converging near the zero line, signaling indecision and a possible transition phase. No strong bullish or bearish momentum is evident.
RSI: The RSI sits in the mid-range, avoiding overbought or oversold extremes, which aligns with the current consolidation pattern.
Overall, USD/CAD appears to be in a neutral zone, awaiting a breakout from this range. A decisive move beyond either 1.3200 or 1.4000 could set the tone for the next directional trend.
-MW

USD/CHF Trades Below Key Moving Averages Amid Bearish BiasThe chart for USD/CHF highlights a persistent bearish structure, with price action currently below both the 50-day (blue) and 200-day (red) moving averages. This alignment suggests a dominant downtrend, reinforced by the following observations:
Moving Averages: The 50-day MA remains well below the 200-day MA, confirming a long-term bearish crossover. Price trading beneath both averages adds weight to the downside bias.
MACD: The MACD histogram shows subdued momentum, and the signal lines are positioned below the zero line, indicating continued bearish pressure. However, the histogram narrowing hints at potential weakening of the current trend.
RSI: The RSI hovers near the midline, suggesting neutral momentum rather than oversold conditions. This could imply consolidation before the next directional move.
Key Levels:
Support: 0.87461
Resistance: 0.94600
The pair remains in a range but under structural bearish pressure. A sustained break below support could extend the downtrend, while a recovery above the 50-day MA would be an early sign of trend reversal.
-MW

WTI Crude Oil Consolidates at Key Support, Ukraine in FocusWTI Crude Oil is trading near a significant horizontal support level around $55 amidst hopes of a Ukraine peace deal. Price action is currently consolidating, and several technical indicators provide insight into the market’s tone:
Moving Averages: The shorter-term moving average (blue) remains below the longer-term moving average (red), reflecting a broader bearish bias. However, recent candles suggest sideways movement, hinting at potential stabilization.
MACD: The MACD lines are converging, and the histogram is shrinking, signaling that bearish momentum is weakening. This could precede a trend shift if confirmed by price action.
RSI: The RSI sits near the neutral zone around 50, indicating neither overbought nor oversold conditions. This reinforces the consolidation narrative rather than a strong directional trend.
Key Observation: Holding above the support zone is critical for WTI. A decisive break below could extend the bearish structure, while a rebound supported by improving MACD signals might suggest the start of a recovery phase.
-MW

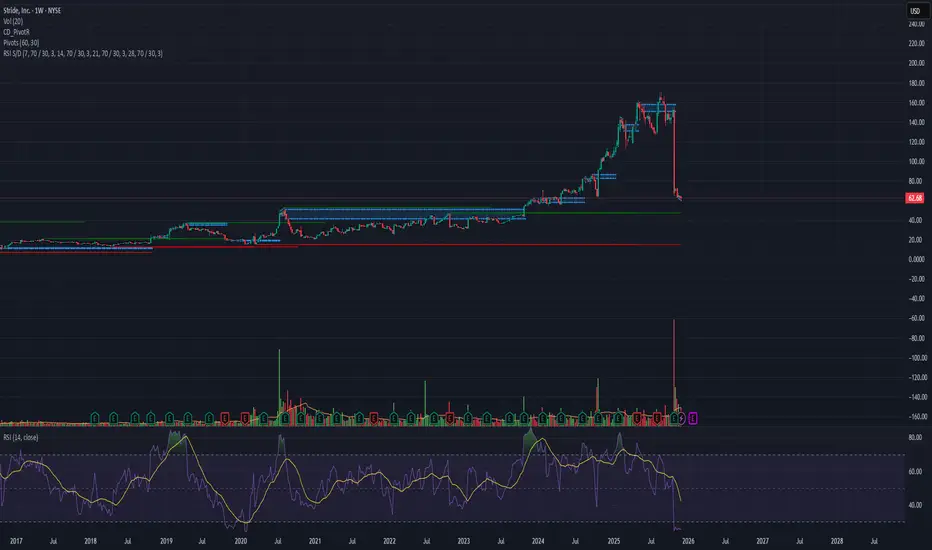
Fast Reversal Setup | Price: 62.68 → Target: 65.81 (+5%)
After the recent lawsuit-related news, LRN dropped sharply from $155 → $62 and is now deep in the oversold area 📉🔥
Volume Signal 📊
This week’s traded volume is higher than anything since its IPO, which often marks a reversal zone.
Repeated Patterns 🔍
Across the daily, weekly, and monthly intervals, the stock is showing its typical reversal pattern, matching previous bounce cycles.
Entry: 62.68
Target: 65.81
Profit: +5% 💰⚡
LTC/USDT | LTC Drops Hard but the Real Opportunity Might Be AheaCRYPTOCAP:LTC rallied all the way to $113 before getting slammed with a heavy correction, dropping more than 34% down to $75. Right now Litecoin is trading near $81 and the momentum is still clearly bearish. As long as this pressure continues, I expect a deeper correction toward the $63 to $70 demand zone.
This is the area that really matters for the next major move. If Litecoin reaches this zone and shows a clean bullish reaction, it becomes a high-interest region for a strong mid-term reversal. A proper reaction here can easily trigger a 100%+ upside move in the coming weeks or months.
For now I’m watching to see how price behaves as it approaches $63 to $70 because that’s where the next big opportunity is likely to form.
Please support me with your likes and comments to motivate me to share more analysis with you and share your opinion about the possible trend of this chart with me !
Best Regards , Arman Shaban
