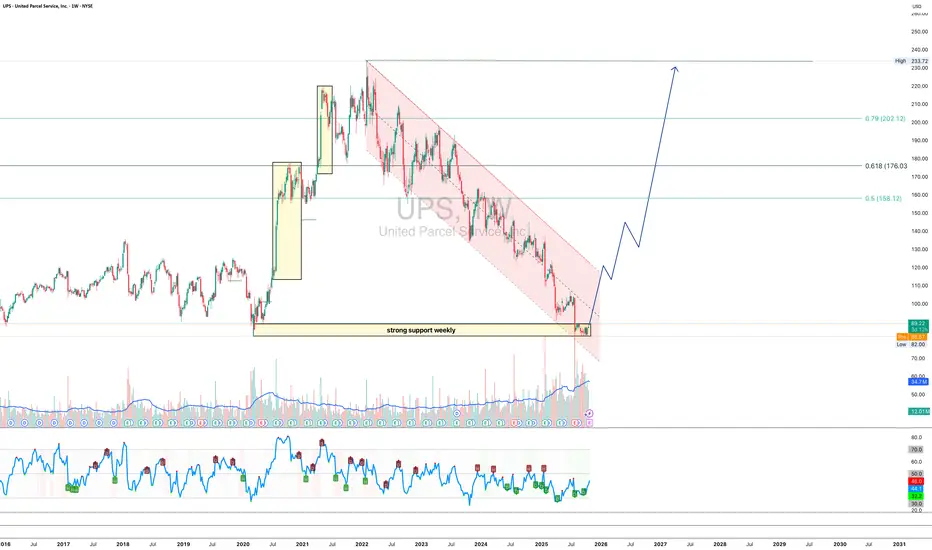
UPS 1W - delivery of a trend reversal is on the way?On the weekly chart, UPS is holding strong around the $82–90 support zone - a key level where buyers historically step in. The structure suggests the end of the long corrective channel and the potential start of a bullish reversal.
Technically, a confirmed breakout above the channel could trigger momentum toward $158, $176, and $202 - attractive targets for mid-term traders.
From a fundamental standpoint, UPS continues to streamline operations, improve automation, and prepare for peak season shipping. Growing e-commerce volumes and steady fuel costs may support stronger margins ahead. If earnings start to reflect these improvements, the stock could easily shift gears into a sustainable uptrend.
* UPS announced that it will report its Q3 results on October 28, 2025.
* The company is introducing increased seasonal charges and shipping rates starting October 26 ahead of the holiday season, which may temporarily reduce demand.
* UPS also announced plans to equip 5,000 of its trucks with air conditioning in the hottest regions of the US, a step to improve working conditions but at a cost.
* The high dividend yield (~7.5%) raises questions about sustainability, as the payout is almost equal to free cash flow.
Tactical play: as long as $82–90 holds, bulls have the initiative. Once the breakout is confirmed - the next big delivery might just be profits.
Technical Analysis
$SPY & $SPX Scenarios — Friday, Dec 19, 2025🔮 AMEX:SPY & SP:SPX Scenarios — Friday, Dec 19, 2025 🔮
🌍 Market-Moving Headlines
• Housing + sentiment check: Existing home sales and consumer sentiment close out the week, offering a read on demand resilience after a heavy CPI and labor stretch.
• Light macro, positioning matters: With no inflation or labor surprises today, flows, OPEX dynamics, and technical levels take priority.
📊 Key Data & Events (ET)
10 00 AM
• Existing Home Sales (Nov): 4.1 million
• Consumer Sentiment, Final (Dec): 53.5
⚠️ Disclaimer: For informational use only — not financial advice.
📌 #SPY #SPX #markets #housing #consumer #trading #stocks

SOL mid-term TASolana is still very bearish on mid-term trend, as well as long-term there's no change in direction. Daily time frame is strictly bearish and currently Solana is entering the bearish area again, which may pull the price deeper to the previous lows around $90ish area.

ETH mid-term TAEthereum as well as Bitcoin has stopped the distribution on daily time frame and both may have a relief X-mas rally, but it's too early to confirm yet and it's not a reversal of a downtrend either, the indicators remain in the bearish territory which may result in a short-lived rally. Be cautious of the current high risk. Technically mid-term trend remains bearish.

CHZ mid-term TAChiliz can be an outperformer on crypto market in the upcoming weeks or months, as of now the volumes on CHZ have accelerated and there's a positive accumulation on weekly time frame as well, it's yet in the early stage of bullish formation but it's something to keep an eye on.
Recently they have announced a partnership with Assetera and that could be a price pusher.

QQQ mid-term TANasdaq uptrend is still not fully restored, and it's having a negative trampoline move, the recent pump is overbought on indicators, watch out for the correction in the near future.
If SMA50 test won't be successful then it may go down to test the previous lows again, watch the blue line as a pivot for the support.

Review and plan for 19th December 2025 Nifty future and banknifty future analysis and intraday plan.
Tcs-analysed.
This video is for information/education purpose only. you are 100% responsible for any actions you take by reading/viewing this post.
please consult your financial advisor before taking any action.
----Vinaykumar hiremath, CMT

GOLD: Decision Point at $4,320 Fundamental + Technical Update 💎 Market Sentiment
Gold is currently consolidating after its recent historic rally. While the long-term fundamental case remains Strongly Bullish due to central bank accumulation and Fed rate cut expectations, the intraday price action is showing signs of exhaustion. We are waiting for a liquidity grab before the next leg up.
📍 Key Levels to Watch
Major Resistance: $4,350 - $4,356 (The "Glass Ceiling")
Immediate Support: $4,319 - $4,322 (Our "Buy Zone")
Invalidation Point: A H4 candle close below $4,285.
📝 The Game Plan
Today I am STAYING NEUTRAL and observing the $4,319 level.
Scenario A (Bullish): A successful test and "rejection wick" at $4,319 confirms buyer strength. This would be our entry for a move back toward $4,350.
Scenario B (Wait) : If the price breaks $4,315 with high volume, we may see a deeper correction toward $4,290 before the next rally.
Patience is a position. Don't force a trade in the middle of a range.
⚠️ Disclaimer
This idea is for educational purposes only. Always manage your risk and wait for confirmation candles before entering.
👇 What’s your view on Gold today? Let me know in the comments!

EURUSD Potential UpsidesHey Traders, in today's trading session we are monitoring EURUSD for a buying opportunity around 1.16800 zone, EURUSD is trading in an uptrend and currently is in a correction phase in which it is approaching the trend at 1.16800 support and resistance area.
Trade safe, Joe.

Silver Bullish Structure into Supply, Pullback Targets MarkedThis 1H Silver (XAGUSD) chart highlights a well-defined bullish market structure with multiple BOS (Break of Structure) confirmations as price trends higher along a rising trendline. After a strong impulsive move, price enters a consolidation phase, then continues upward, respecting the dynamic trendline support.
Price is currently trading just below a clearly marked Supply Zone, signaling potential short-term exhaustion. The projection illustrates a possible corrective pullback from supply, with downside targets aligned at prior structure and liquidity levels.
1st target sits near the previous support (~63.37)
2nd target aligns deeper into the range (~61.17)
Below, a higher-timeframe Demand Zone is marked, representing a strong area of interest if deeper retracement occurs.
Overall, the chart presents a trend-continuation context with a tactical short-term pullback scenario from premium prices.

FETCH – Weekly AnalysisFETCH is currently trading at a key HTF support zone that has acted as
support → resistance → support multiple times in the past.
Price is also compressing against a descending trendline, which increases the probability of a volatility expansion.
Key observations:
Strong historical support around current price
Downtrend structure still intact
Potential trendline breakout if buyers step in
No confirmation yet → patience required
Bullish scenario:
Weekly close above the descending trendline
Support holds as higher low
➡️ Possible trend reversal / expansion
Bearish scenario:
❌ Loss of HTF support
➡️ Continuation of the macro downtrend
Always wait for confirmation. What’s your bias here?

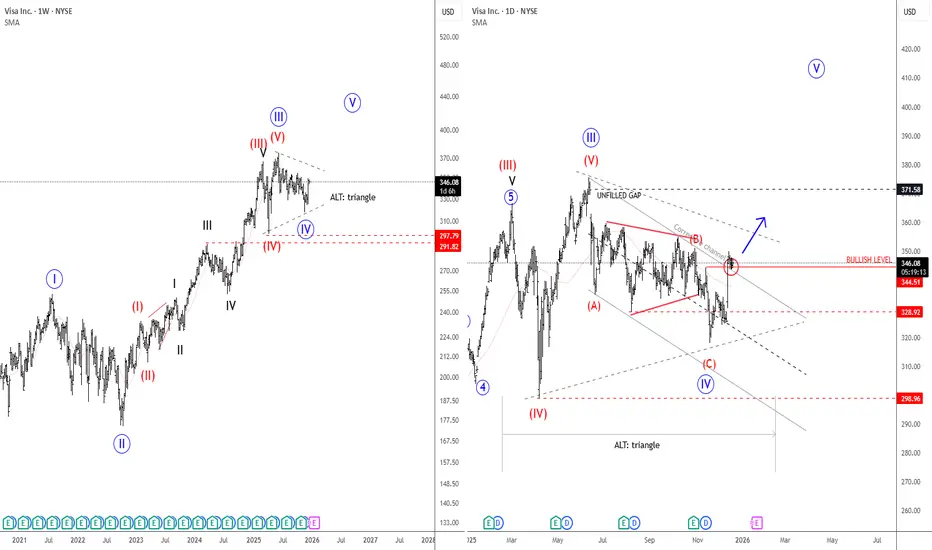
Visa: Completing Correction, Upside Potential AheadVisa Inc. is a global payments technology company that operates one of the world’s largest electronic payment networks. It enables secure electronic transactions between consumers, merchants, and banks in over 200 countries, focusing on fast, reliable, and cashless payments.
Visa has pulled back roughly 15% from its highs and appears to be completing a clear A-B-C corrective decline. Moves out of triangle formations are often final legs within corrective structures, suggesting a new bullish push could be approaching. This outlook is reinforced by the unfilled gap near 371, which historically tends to act as a price magnet over time. As a result, a reversal to the upside over the coming weeks or months would not be surprising. A breakout above the corrective channel would serve as a key confirmation for trend resumption.
Highlights:
Visa appears to be completing an A-B-C decline
Channel break signals potential upside continuation
Unfilled gap at 371 remains a key upside target for 2026
Bullish confirmation above 344.50
Support levels at 311 and 298 on deeper pullbacks
EUR/USD | EURUSD Pullback From Supply, Buyers Step Back In!By analyzing the #EURUSD chart on the 6 hour timeframe, we can see that price moved up as expected and reached the supply zone between $1.178 and $1.182. As soon as price hit this key area, selling pressure appeared and EURUSD dropped to $1.17.
After reaching this level, buyers stepped in again and demand increased. Right now, #EURUSD is trading around $1.17330. I expect to first see another upward move, and then we should watch the price reaction again at the $1.178 to $1.182 supply zone.
THE LATEST TA on EURUSD :
Please support me with your likes and comments to motivate me to share more analysis with you and share your opinion about the possible trend of this chart with me !
Best Regards , Arman Shaban

GBPJPY: Bullish Wave Almost Confirmed?! 🇬🇧🇯🇵
GBPJPY turned bullish after the news today.
The price is currently breaking a resistance line of a bullish flag pattern.
If a today's daily candle closes above its trend line, there
will be a high chance to see more growth.
Next resistance will be 209.5 then.
❤️Please, support my work with like, thank you!❤️
I am part of Trade Nation's Influencer program and receive a monthly fee for using their TradingView charts in my analysis.

MRNA long-term TAModerna had a solid consolidation and currently is on the move to break through the resistance into long-term uptrend, watch for the final test of SMA50 on daily to confirm the rising uptrend.

Gold (XAU/USD) Analysis: Triangle Breakout Strategy Aaj Gold (XAU/USD) ke 1-hour chart par ek clear Symmetrical Triangle pattern banta nazar aa raha hai. Price ne triangle ki lower support line ko break kiya hai, jo ek potential Bearish Move ka ishara hai.
Entry: Current market price ($4,326 ke aas-paas) ya retest par.
Stop Loss: $4,351 (Triangle ke pichle high ke upar).
Take Profit: $4,292 (Next support zone).
Market mein volatility ho sakti hai, isliye hamesha proper risk management ka istemal karein. Aapka is setup ke baare mein kya khayal hai? Comment mein batayein! 🚀
#GoldAnalysis #ForexTrader #TechnicalAnalysis #XAUUSD #PriceAction #TradingTips #TradingView

EURUSD 30M : Bearish Breakdown + Waiting for Reaction DemandEURUSD (30-Minute) – Bearish Continuation Toward a Key Reversal & Liquidity Zone
This EURUSD 30-minute chart highlights a clear shift in momentum from bullish correction to bearish continuation, with price now moving aggressively toward a well-defined reversal and liquidity area. The structure, candle behavior, and zones marked on the chart suggest that the market is entering a decision phase where patience and confirmation are essential.
Market Structure & Price Behavior
Initially, EURUSD experienced a sharp bullish impulse, followed by a corrective phase that formed a rounded / sloping structure (highlighted in green). This type of price action often represents distribution, where buyers gradually lose control while sellers build positions.
As price reached the upper boundary of this corrective structure, bullish momentum clearly weakened. The market then produced a strong bearish displacement candle, breaking below short-term support and signaling that sellers had regained control.
Momentum Shift & Breakdown
The recent bearish candles show strong body closes with minimal lower wicks, which confirms selling pressure rather than stop-hunting. This is not a random pullback — it is a decisive move, suggesting that price is likely to continue lower unless strong buying appears at a key zone.
The break of structure (BOS) to the downside confirms that EURUSD is currently bearish on the intraday timeframe.
Reversal Zone (Primary Area of Interest)
The marked Reversal Zone below current price is a high-probability area where:
Previous buying interest was present
Liquidity may be resting
Short-term sellers may take partial profits
However, the chart clearly states “Pattern Need”, which is critical. This means:
No blind buying in the zone
Wait for price action confirmation such as a strong rejection, bullish engulfing, or clear structure shift
Only if such a pattern appears does a counter-trend buy become valid.
Failure Scenario & Drafted Zone
If price fails to react at the first reversal zone and breaks through it with momentum, the probability increases for a deeper bearish continuation. In that case, price is likely to move toward the Drafted Zone, which represents a deeper liquidity pool and a more attractive area for potential reactions.
The vertical projection on the chart highlights a 2x measured move, reinforcing the idea that momentum can extend if buyers remain absent.
Trading Psychology & Risk Management
This setup is a textbook example of waiting, not predicting. The market has already shown its bearish intent. The correct mindset here is:
Sell with the trend after pullbacks
Or buy only after confirmation at key zones
Entering without confirmation increases risk and reduces probability.
Summary
EURUSD is currently bearish on the 30-minute timeframe, with price approaching a critical decision area. The next valid trade depends entirely on how price behaves inside the marked zones. Either we get a confirmed reversal pattern for a short-term bounce, or continuation toward deeper liquidity.

EURUSD Analysis : Bullish Bias Setup + Demand Zone + ReversalEURUSD – 30 Minute Chart Analysis
Market Structure Overview
EURUSD initially moved in a strong bullish trend, creating higher highs and higher lows. This impulsive rally shows aggressive buying pressure and momentum expansion. However, after reaching the recent high, price failed to sustain upside continuation and started showing loss of bullish strength.
This shift marked the beginning of a distribution phase, where smart money began offloading positions rather than pushing price higher.
Breakdown from Consolidation
After the top formation, price entered a tight consolidation / triangle structure, signaling indecision and compression. This pattern acted as a continuation structure to the downside. Once price broke below the triangle, it triggered a strong bearish continuation, confirming that sellers had taken control.
The breakdown was clean, impulsive, and backed by strong candle bodies — a clear sign of bearish displacement.
Liquidity Sweep & OPL Reaction
Following the breakdown, price aggressively moved lower, sweeping liquidity below recent lows. The OPL level acted as a minor pause point but failed to hold, confirming that buyers were weak and stops were being consumed.
This move was necessary to clean out weak longs before price reached a more meaningful demand area.
Reversal Zone (Demand Area)
The highlighted Reversal Zone at the bottom is a key demand / accumulation area, where price previously showed strong bullish reactions. As price entered this zone, selling pressure slowed, and small bullish candles began to appear, signaling potential absorption of sell orders.
This behavior suggests that smart money may be accumulating long positions at discounted prices.
Potential Recovery Scenario
If price continues to hold above the reversal zone and forms:
Higher lows
Bullish engulfing candles
Strong rejection wicks
Then a corrective bullish move becomes likely. The projected path shows a step-by-step recovery rather than an aggressive reversal, which is typical after a sharp sell-off.
Bearish Invalidation
If price closes decisively below the reversal zone with strong momentum, this bullish recovery idea becomes invalid. In that case, the market may continue lower toward deeper liquidity zones.
Trader’s Mindset
This is a reaction-based setup, not a prediction. The best trades will come only after confirmation inside the reversal zone. Patience here separates disciplined traders from emotional ones.
Key reminders:
Zones are areas, not exact prices
Confirmation > early entry
Protect capital first
Final Thoughts
EURUSD is currently trading at a high-decision demand zone after a strong bearish move. The next candles will be crucial in defining whether this is just a pause or the beginning of a meaningful recovery. Let price confirm before committing to a trade.

XAUUSD Daily: Tightening Trendlines Ahead of High-Impact Events
Gold remains in a strong bullish structure on the daily chart, but price action is now approaching a critical juncture where multiple trendlines are tightening and converging. This compression typically precedes a breakout, and given the current macro backdrop, volatility is expected to rise.
Key technical levels to watch:
Resistance Zones:
4,352 – Psychological level and short-term pivot (PDH and PWH)
4,381 – Upper resistance and breakout target (previous record high).
Above 4,381, the path opens toward new record highs.
Support Belt:
4,320 – 4,300 – Strong demand zone; as long as this area holds, selling remains unattractive.
The price is currently consolidating near the upper channel boundary, signaling potential energy buildup for the next directional move.
Macro Drivers & Volatility Risks
Today’s calendar is packed with high-impact events that could significantly influence the U.S. Dollar Index (DXY) and, by extension, gold:
BoE Interest Rate Decision
ECB Interest Rate Decision
U.S. CPI Data
Initial Jobless Claims
These events collectively create a scenario for heightened volatility, as markets reassess inflation trends and central bank policy stances.
Trading Scenarios
Bullish Breakout:
A decisive move above 4,352 will likely accelerate momentum toward 4,381, with potential extension to new record highs beyond that level.
Support-Based Entry:
If price retraces into the 4,320 – 4,300 belt, this zone offers a favorable risk-reward for long positions.

Gold Is Holding Firm Into Year-End — A Santa Rally Is Setting UpGold on H4 continues to trade in a strong bullish structure, consolidating just below the key resistance zone around the previous high. Price is holding comfortably above the rising EMA base, with higher lows intact, confirming that buyers remain in control despite short-term pullbacks. This sideways-to-higher behavior beneath resistance signals absorption rather than distribution, as selling pressure fails to force acceptance below the support zone. Structurally, this is a classic bullish consolidation, where the market pauses to build liquidity before the next directional move.
From a macro perspective, the setup is supported by typical year-end dynamics. As liquidity thins into the Christmas period, markets often shift into range compression followed by sharp directional expansions. At the same time, expectations around U.S. monetary policy remain tilted toward easing in 2025, keeping real yields capped and limiting sustained USD strength. Combined with ongoing geopolitical and macro uncertainty, this environment continues to favor Gold as a defensive asset.
As long as price holds above the support zone and maintains acceptance below resistance, the bullish bias remains intact. A clean breakout and hold above resistance would likely open the path toward a new ATH, while failure to break simply extends consolidation rather than signaling a top. For now, this is a patience phase OANDA:XAUUSD is not stalling, it is positioning.

EURUSD Is Correcting Inside an Uptrend — Not Rolling OverHELLO GUYS
TICKMILL:EURUSD on H4 remains structurally bullish, with price continuing to respect a well-defined ascending channel. The recent pullback from the upper boundary is a normal corrective move rather than a breakdown, as price has rotated back toward the mid-to-lower channel area where dynamic support from the rising EMAs is converging. Higher highs and higher lows are still intact on the broader structure, indicating that buyers remain in control despite short-term volatility.
From a price-action perspective, the current decline looks corrective and overlapping, not impulsive. As long as price holds above the channel base and the 1.1700–1.1720 support region, the bullish structure remains valid. This zone acts as a decision area: holding it favors another rotation higher toward the channel top, while a clean break below would signal a deeper correction rather than immediate trend reversal.
From a macro standpoint, this technical behavior aligns with ongoing EUR–USD dynamics. While the U.S. dollar has seen intermittent strength from short-term data releases, the broader rate differential outlook between the Fed and ECB is no longer widening aggressively. Markets are increasingly pricing a stabilization phase in monetary policy expectations, which limits sustained USD upside and allows EURUSD to remain bid within its trend. This macro backdrop supports corrective pullbacks being bought rather than extended sell-offs.
In summary, FOREXCOM:EURUSD is in a healthy pullback within a bullish channel. As long as structural support holds, the path of least resistance remains higher toward the upper channel and prior highs. This is a wait for Support reaction environment patience is required until price confirms continuation or invalidation with clear intent.

Ethereum Is Absorbing Supply — The Break Comes After PatienceEthereum on H1 is holding inside a well-defined sideways range following the sharp impulsive sell-off, with price now rotating between a defended support zone and a capped resistance band around the 3,000–3,020 area. This type of tight consolidation after an aggressive move lower signals absorption rather than continuation, as sellers fail to push price into acceptance below support while buyers are not yet strong enough to reclaim resistance. The structure suggests balance and compression, not trend resolution, with liquidity building on both sides of the range.
From a macro perspective, this behavior aligns with the broader crypto environment. Risk sentiment has stabilized, and while liquidity conditions are not expanding aggressively, there is no fresh macro shock to justify another impulsive leg down. Expectations around U.S. monetary policy remain relatively steady, limiting USD strength and allowing crypto assets like ETH to consolidate instead of breaking down. However, the lack of strong liquidity inflows also explains why upside remains capped and corrective for now.
As long as ETH continues to hold the support zone, downside is likely limited to range rotation rather than trend continuation. A clean acceptance above the resistance zone would signal alignment between technical structure and macro conditions, opening the path toward a stronger recovery move. Until that breakout occurs, this is a patience phase the edge appears only when price leaves the range with clear intent.

Gold Is Trapped Between Control ZonesGold on H1 remains locked inside a clearly defined range, with price oscillating between a well-defended support zone around 4,260 and a heavy resistance band near 4,350–4,360. The broader structure is still constructive, as higher lows continue to form above the rising EMA base, confirming that buyers have not lost control. Repeated failures to accept above resistance show that sellers are active at the highs, compressing price rather than reversing the trend a classic balance phase where liquidity is building on both sides. From a macro perspective, this consolidation aligns with a cautious market stance ahead of key U.S. data and ongoing uncertainty around Fed policy, where neither USD strength nor risk-off flows are decisive enough to force a breakout. As long as real yields remain capped and expectations around rate cuts stay supportive, downside moves in Gold are more likely corrective than trend-breaking. A clean acceptance above the resistance zone would signal macro and technical alignment for expansion toward new highs, while rejection simply prolongs consolidation and reinforces patience. In this environment, chasing moves inside the range offers low edge the opportunity emerges only when price exits the box with clear intent.
