Wheat in Focus: How Ukraine, China, and Weather could move WheatWheat is one of the world’s most widely traded agricultural commodities, essential for food and animal feed. Prices are heavily influenced by global supply and demand, with major producers including the U.S., Russia, the EU, Canada, Australia, and Ukraine. Weather conditions, geopolitical events, and large importer activity can all create significant volatility in the market. Let’s break it down.
1. What Drives Wheat Prices
Supply Factors
Wheat supply is heavily shaped by the major exporting regions—Russia, the EU, Australia, the U.S., Canada, and Ukraine. Weather is the biggest swing factor: drought, heat stress, floods, or winterkill can quickly tighten global supply and spark rallies. Crop progress reports and yield updates show how each production cycle is developing, while geopolitics—especially in the Black Sea—can disrupt export flows overnight. Input costs like fertilizer and fuel influence how much farmers plant, and currency moves affect which exporters are most competitive. Together, these factors determine how much wheat the world can actually deliver to the market. To summarize:
Major producers: Russia, EU, Australia, U.S., Canada, Ukraine
Weather: drought, heat stress, winterkill, floods
Crop progress: planting pace, crop conditions, yield expectations
Geopolitics: Black Sea tensions, export bans, sanctions, port disruptions
Input costs: fertilizer, fuel, logistics
Currency impact: strong USD usually weighs on wheat prices
Demand Factors
Demand for wheat is driven by global food consumption, animal feed needs, and the buying behavior of major importers such as China, Egypt, and Indonesia. Economic conditions matter because stronger economies consume more food and feed. Price relationships with other grains like corn and rice can shift demand toward or away from wheat. Changes in trade flows—such as China sourcing more from the U.S. instead of the Black Sea—can quickly redirect global shipments. These factors help traders understand whether demand is strengthening or weakening relative to available supply. To summarize:
Global consumption (food + feed use)
Large importer buying: China, Egypt, Indonesia, Turkey
Economic conditions in EM (Emerging Markets)
Substitution vs. corn/rice
Global trade flow shifts
2. Key Reports Traders Actually Need to Track
Instead of monitoring everything, wheat traders focus on the handful of reports that truly move price:
WASDE (Monthly) – The most important report in wheat trading. This is where global production, consumption, exports, and ending stocks get revised.
Wheat can rip or dump instantly on WASDE changes. If you track only one thing, track WASDE.
Weekly USDA Export Sales – This shows an immediate view of demand. Watch for:
Big purchases from China, Egypt, Indonesia
Surprising cancellations
Shifts from Black Sea to U.S. buying
It’s one of the fastest ways to spot demand changes ahead of price.
Crop Progress (Weekly, in season) – Important only during planting, growing and harvesting periods. The report tracks:
% planted
% harvested
Crop condition (% good/excellent)
Poor Conditions generally = bullish. Strong Conditions generally = bearish
Geopolitical headlines – In our opinion wheat is the most geopolitically sensitive commodity. Anything related to the following can cause immediate moves.:
Corridor shutdowns
Port attacks
Export bans
Ceasefire rumors
This is the intraday volatility driver that news traders capitalize on.
Weather in key regions (Daily / weekly) – Focus on the key regions of the U.S. Plains, Black Sea, Australia.
Drought in these regions generally = bullish. Good moisture generally = bearish.
Use simple sources like NOAA maps or short ag weather summaries (weather reports that impact agriculture).
CFTC COT (Weekly) – This is for context and is not used for trading signals. It shows whether funds are heavily long or short. Only the extremes matter:
Funds very short → short-covering rallies possible
Funds very long → risk of liquidation selloffs
This report is more relevant for swing and position traders.
3. Recent Market Drivers
Peace-proposal speculation:
Reports of a U.S. proposal involving Ukraine ceding Donbas triggered a fast selloff as markets priced in the possibility of Ukrainian exports normalizing.
Zelenskiy has stated he won’t accept territorial concessions, so a confirmed ceasefire remains unlikely unless U.S./EU pressure increases.
Market reaction:
Wheat dumped immediately on the headline, but the move didn’t sustain — traders want confirmation, not speculation.
China buying U.S. wheat:
Ongoing chatter that China is shifting some purchases to the U.S. (no official tonnage yet). This is a supportive demand story worth monitoring.
4. Chart Analysis: Recent Price Action and What to expect
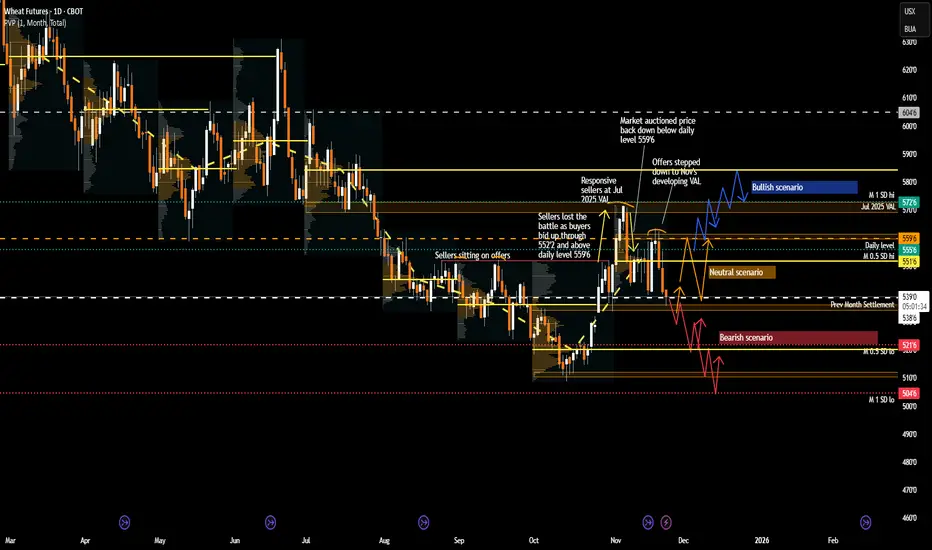
The developing monthly VPOC for November 2025 has shifted higher, marking a potential change in market sentiment after three consecutive months of declining VPOCs. In addition, the developing VA for November appears unlikely to overlap with the previous month’s VA. This suggests that market conditions are changing and that the recent downward trend may be ending.
Market based out around 520 and rallied from mid-October to early November, breaking 552’4 (previous seller defense) and reclaiming back above 559’6 daily level.
This rally was likely supported by the potential U.S.–China trade deal and initial Chinese wheat purchases in early November.
However, sellers stepped in at 570 (July’s VAL + monthly 1SD high), offering price back below 559’6. Market is now rotating inside a developing range between 559’6 and the 540–535’6 zone (October settlement/LVN) to establish value.
Bearish Scenario
A break and acceptance below 540 opens the door toward:
520 (October’s VPOC + monthly 0.5SD low)
510 (October low)
504’6 (monthly 1SD low)
Catalyst: Any news of confirmed progress toward a Russia–Ukraine ceasefire → removal of war-premium → likely downside.
Bullish Scenario
If market accepts back above 559’6, sets up a move toward:
570 (July VAL / M 1SD high) — expect sellers here.
585’6 (July VPOC) if 570 is cleared
Catalyst: Headline reversal or escalation in the conflict between Russia and Ukraine.
Neutral Scenario
Without fresh catalysts, expect continued range rotation between 559’6 and 540, with the market establishing value in this zone.
5. Conclusion
Wheat remains a headline-driven and weather-sensitive market, where geopolitical developments, major buyer activity, and crop conditions can quickly shift sentiment. Traders should monitor key reports and technical levels while staying aware of global supply and demand dynamics. With multiple factors in play, range rotations and sudden spikes or drops are likely until a clear catalyst drives the market decisively.
What are your thoughts? Are you watching the headlines, weather, or technical levels for clues? Please share your insights below and give this post a boost so the rest of the community can join the conversation.
Glossary Index for technical terms used:
VAH (Value Area High)
VAL (Value Area Low)
VPOC (Volume Point of Control)
SD (Standard Deviation)
LVN (Low Value Node)
VA (Value Area)
Technical Analysis
XAUUSD – The UP Trend Is Still Well ProtectedThe gold market is no longer asking “will it go up or not” — the real question now is how the rally unfolds . When we combine the news backdrop with the price structure on the chart, the bullish picture of XAUUSD becomes increasingly clear.
On the fundamental side , recent U.S. economic data shows a cooling labor market , while expectations for the Fed to continue easing monetary policy remain intact . Yields and the USD are not strong enough to trigger a deep sell-off, and safe-haven demand is still present. This creates a solid macro foundation supporting higher gold prices, rather than a random technical bounce.
From a technical perspective , the uptrend remains clean and well-structured:
• Price is above the Ichimoku cloud, and the cloud is sloping upward → the primary trend remains bullish.
• The 4,300 zone is acting as both a dynamic and psychological support, where price has just pulled back and reacted positively.
• The long-term ascending trendline remains intact → the Higher Low structure is still preserved.
The most logical scenario at this stage is consolidation above 4,300, followed by a continuation toward the 4,380 – 4,390 zone, where the upper trendline resistance converges. This is a classic behavior of a strong market: no sharp sell-offs, no panic — just a pause before the next leg higher.
👉 In summary:
The UPTREND in XAUUSD continues to dominate. As long as 4,300 holds, any pullback should be viewed as a trend-following opportunity, not a reversal signal.

XRPUSD - ETF Inflows Hit $1.2B But Whales Dumpingb]Executive Summary
BITSTAMP:XRPUSD is trading at approximately $1.92 after recovering from recent lows, currently testing the critical $1.95 resistance level. Despite the historic launch of US spot XRP ETFs accumulating $1.2 billion in assets with ZERO negative outflow days, the price remains under pressure. On-chain data reveals a troubling divergence: while retail piles into ETFs, whales have been systematically offloading holdings on exchanges. This analysis examines whether XRP can break through $1.95 resistance or if continued whale selling will push price toward the $1.50-$1.66 support zone.
NEUTRAL BIAS - Two Scenarios Presented
I'm presenting both bullish and bearish scenarios because the data is genuinely mixed. ETF inflows are historically bullish, but whale behavior is bearish. Let the market show its hand.
Current Market Context - December 21, 2025
XRP finds itself at a fascinating crossroads:
Price: $1.9249 (up 0.18% on the day)
Day's Range: $1.9014 - $1.9257
52-Week Range: $1.6106 - $3.662
Market Cap: $116.52 billion (battling BNB for #3 spot)
24h Trading Volume: $2.36 billion
Down 50% from July 2025 ATH of $3.65
The broader context:
Crypto market shed over $1.3 trillion since October
XRP down 30%+ over past three months
Fed hawkishness pressuring all risk assets
Yet XRP ETFs seeing unprecedented inflows
THE BIG STORY: ETF Success vs. Whale Dumping
Historic ETF Launch - $1.2 Billion in Assets
Canary Capital launched the first US spot XRP ETF, hitting nearly $250 million in volume on its first day - a RECORD for non-Ethereum altcoin ETFs. The numbers are impressive:
Total XRP ETF Assets: $1.2 billion
Net Inflows: $1 billion since launch
Canary XRP ETF: $335 million AUM (market leader)
21Shares: $250+ million
Grayscale: $220+ million
Bitwise and Franklin Templeton also participating
ZERO negative outflow days since debut
This should be massively bullish. With Bitcoin and Ethereum, ETF launches drove significant price appreciation. So why isn't XRP responding?
The Whale Problem - On-Chain Data Reveals the Truth
CryptoQuant analyst PelinayPA uncovered the issue: whales started offloading their holdings on exchanges as ETF expectations heightened. They provided the sell-side liquidity for retail investors buying the ETF launch news.
Key findings from Exchange Inflow data:
Majority of inflows coming from 100K-1M XRP and 1M+ XRP bands (whales)
After each major inflow spike, price forms lower highs and lower lows
Supply is overwhelming demand despite ETF buying
Whales not aggressively dumping, but continuous supply increase keeps pushing price lower
This explains why XRP faces selling pressure each time it approaches $1.95
CRITICAL: Exchange inflows would need to dry up first before XRP can see a sustained bullish run.
Technical Structure Analysis
Price Action Overview - 45 Minute Timeframe
The chart shows a clear pattern evolution:
Phase 1 - Descending Channel (Previous Weeks):
Price was trapped in a descending channel/wedge pattern
Lower highs and lower lows dominated
Breakdown from the channel led to capitulation
Phase 2 - V-Bottom Recovery:
Sharp selloff found support at major support zone
V-shaped recovery initiated
Price reclaimed lost ground quickly
Phase 3 - Ascending Channel (Current):
Price now trading within an ascending channel
Higher lows forming off the bottom
Currently testing upper resistance of the channel
Fair Value Gap (FVG) identified in the middle of the range
Decision point: breakout or rejection?
Key Support and Resistance Levels
Resistance Levels:
$1.95 - CRITICAL resistance (whale selling zone, repeated rejections)
$2.00 - Psychological round number resistance
$2.10-$2.15 - Secondary resistance zone
$2.50 - Major resistance / bullish target
$3.00 - Major psychological level
$3.65 - All-time high (July 2025)
Support Levels:
$1.90 - Immediate support (current price area)
$1.82-$1.87 - FIRST MAJOR SUPPORT ZONE (historical buying activity)
$1.77 - CRITICAL SUPPORT (large accumulation zone per Glassnode)
$1.66 - Secondary support
$1.50-$1.60 - Deep support if whale selling continues
$0.79 - Next meaningful support if $1.77 breaks (THIN LIQUIDITY between)
WARNING: Ali Martinez's Glassnode data shows a THIN LIQUIDITY ZONE below $1.77. If that level breaks, there's limited support until $0.79. This is a critical risk factor.
Chart Pattern Analysis
Current structure shows an ascending channel within a larger recovery:
Channel support: Rising trendline from recent lows
Channel resistance: Parallel line connecting recent highs
Price currently testing upper channel resistance near $1.95
Fair Value Gap (FVG) sits in the middle of the range - potential retest zone
Two clear scenarios: breakout above channel or rejection back to FVG/support
Fibonacci Analysis
Measuring from the July ATH ($3.65) to recent lows:
Current price ($1.92) represents approximately 47% decline from ATH
Key Fib levels to watch for recovery targets
0.382 retracement would target ~$2.50 area
0.5 retracement would target ~$2.70 area
Fundamental Analysis
Bullish Fundamentals
1. XRP ETF Ecosystem Thriving
$1.2 billion in assets - unprecedented for altcoin ETF
Zero negative outflow days
Multiple major issuers participating (Canary, 21Shares, Grayscale, Bitwise, Franklin Templeton)
Institutional infrastructure now established
2. Ripple Ecosystem Developments
XRPL Lending Protocol launching for institutions
Fixed-term, fixed-rate loans (30-180 days)
Secured by Single Asset Vaults
Validator voting expected late January 2026
Protocol-native credit markets coming to XRPL
3. Ripple Escrow System - Institutional Design
According to XRP investor Lord Belgrave, Ripple's escrow mechanism was deliberately structured for institutional deployment:
55 billion XRP locked in escrow contracts
1 billion XRP scheduled for release monthly
700-800 million typically re-locked
Only 200-300 million effectively released monthly
NDAs with institutions across Europe, Middle East, Asia
Discussions allegedly included central banks, IMF, BIS
NDAs may be nearing disclosure phase as systems move to active deployment
4. Banks May Favor Higher XRP Price
Finance expert Dr. Camila Stevenson argues:
Banks look at whether a system can handle stress and move large sums
XRP has fixed supply - price is the only way to support larger volumes
Banks moving billions prefer fewer units representing more value
Fewer tokens = simpler settlement, less slippage risk
Higher XRP price could support smoother transfers at scale
5. Market Cap Battle
XRP market cap: $116.36 billion
BNB market cap: $117.71 billion
Only $1.35 billion difference
XRP vying for #3 spot in crypto
Bearish Fundamentals
1. Whale Selling Pressure
100K-1M XRP and 1M+ XRP bands driving exchange inflows
Whales offloaded as ETF expectations heightened
Continuous supply increase overwhelming demand
Price forms lower highs after each inflow spike
$1.95 resistance repeatedly defended by sellers
2. Thin Liquidity Risk
Below $1.77, next meaningful support is $0.79
Limited accumulation between these levels
If $1.77 breaks, could see rapid decline
3. Analyst Skepticism on Altcoin ETFs
Markus Thielen (10x Research founder) predicts:
Most non-Bitcoin crypto ETFs unlikely to achieve lasting success
Institutional demand centers on Bitcoin
Bitcoin's "digital gold" narrative resonates with institutions
Altcoins like XRP lack compelling institutional narrative
4. Macro Headwinds
Crypto market shed $1.3 trillion since October
Fed projecting only two rate cuts for 2026
Risk-off sentiment persisting
XRP down 30%+ over three months
Analysts warn of potential cooling period in 2026
5. Price Performance Lagging
7-Day: -2.78%
1-Month: -12.91%
3-Month: -7.49%
Down 50% from ATH despite ETF success
ETF inflows not translating to price appreciation
SCENARIO ANALYSIS - NEUTRAL STANCE
BULLISH SCENARIO - Breakout Above $1.95
Trigger Conditions:
Daily close above $1.95 with volume confirmation
Exchange inflows from whales decrease significantly
ETF inflows continue/accelerate
Bitcoin stabilizes above $95,000
Break above ascending channel resistance
Price Targets if Bullish:
Target 1: $2.00 - Psychological level
Target 2: $2.15-$2.20 - Secondary resistance
Target 3: $2.50 - Major resistance / analyst target
Extended: $3.00+ if momentum sustains
Bullish Catalysts to Watch:
XRPL Lending Protocol validator voting (late January 2026)
Potential NDA disclosures from institutional partners
Continued ETF inflows
Altcoin season rotation (expected January 2026)
XRP flipping BNB for #3 market cap
BEARISH SCENARIO - Rejection at $1.95
Trigger Conditions:
Rejection candle at $1.95 with increased volume
Whale exchange inflows continue/increase
Break below ascending channel support
Bitcoin weakness below $90,000
ETF inflows slow significantly
Price Targets if Bearish:
Target 1: $1.82-$1.87 - First major support zone
Target 2: $1.77 - Critical support (Glassnode accumulation zone)
Target 3: $1.50-$1.66 - Deep support if whale selling persists
DANGER ZONE: Below $1.77 = thin liquidity to $0.79
Bearish Risks to Monitor:
Continued whale offloading on exchanges
ETF narrative failing to drive price
Broader crypto market weakness
Fed maintaining hawkish stance
Break of $1.77 critical support
Trade Framework
Bullish Trade Setup
Entry Conditions:
45-minute candle closes above $1.95 with volume
RSI breaks above 55
Ascending channel breakout confirmed
Trade Parameters:
Entry: $1.96-$2.00 on confirmed breakout
Stop Loss: $1.85 below recent support
Target 1: $2.15 (Risk-Reward ~1:1.5)
Target 2: $2.50 (Risk-Reward ~1:3.5)
Target 3: $3.00 (Extended)
Bearish Trade Setup
Entry Conditions:
Rejection candle at $1.95 with upper wick
Break below $1.87 support
Volume confirmation on breakdown
Trade Parameters:
Entry: $1.86-$1.87 on support break
Stop Loss: $1.96 above resistance
Target 1: $1.77 (Risk-Reward ~1:1)
Target 2: $1.60 (Risk-Reward ~1:2.7)
Target 3: $1.50 (Extended)
Range Trade Setup (If Consolidation Continues)
Parameters:
Buy Zone: $1.82-$1.87
Sell Zone: $1.93-$1.95
Stop Loss: $1.75 (below range)
This setup works while price remains in the ascending channel
Risk Management Guidelines
Position sizing: 2-3% max risk per trade
CRITICAL: Respect the $1.77 level - thin liquidity below
Watch whale exchange inflows via CryptoQuant
Monitor ETF flow data daily
Reduce exposure during holiday low-liquidity period
Use hard stops - whale selling can accelerate moves
Scale out at targets rather than all-or-nothing exits
Invalidation Levels
Bullish thesis invalidated if:
Price closes below $1.77 on daily timeframe
Whale exchange inflows spike significantly
ETF outflows begin (first negative day)
Bitcoin breaks below $88,000
Bearish thesis invalidated if:
Price closes above $2.00 with volume
Whale exchange inflows dry up
ETF inflows accelerate significantly
XRP flips BNB for #3 market cap
Conclusion
BITSTAMP:XRPUSD presents a genuinely mixed picture. The ETF success story ($1.2B in assets, zero outflow days) should be bullish, but whale behavior tells a different story. On-chain data shows large holders systematically offloading at the $1.95 resistance level, providing sell-side liquidity for retail ETF buyers.
The Key Question: Will ETF demand eventually overwhelm whale supply, or will whales continue to cap rallies?
Critical Levels:
$1.95 - THE level to watch. Break above = bullish, rejection = bearish
$1.77 - Must hold. Thin liquidity below to $0.79
$2.50 - Bullish target if breakout occurs
$1.50-$1.60 - Bearish target if whale selling continues
My Stance: NEUTRAL
I'm not calling a direction here. The data genuinely supports both scenarios. Let price action at $1.95 determine the next move. Trade the reaction, not the prediction.
Watch For:
Whale exchange inflow data (CryptoQuant)
ETF flow momentum
XRPL Lending Protocol news (January 2026)
Bitcoin correlation and direction
This is not financial advice. Always conduct independent research and manage risk appropriately.

GBPUSD is Nearing an Important Support Area!!Hey Traders, in tomorrow's trading session we are monitoring GBPUSD for a buying opportunity around 1.33250 zone, GBPUSD is trading in an uptrend and currently is in a correction phase in which it is approaching the trend at 1.33250 support and resistance area.
Trade safe, Joe.

$SPY & $SPX Scenarios — Week of Dec 22 to Dec 26, 2025🔮 AMEX:SPY & SP:SPX Scenarios — Week of Dec 22 to Dec 26, 2025 🔮
🌍 Market-Moving Headlines
• Holiday week liquidity: Thin volumes amplify moves, especially around Tuesday’s data dump.
• Delayed macro catch-up: GDP and durable goods hit at once, giving markets a late-cycle growth read before year-end positioning.
• Consumer confidence update: One of the few forward-looking signals in a quiet, holiday-shortened week.
📊 Key Data & Events (ET)
Tuesday, Dec 23
8 30 AM
• GDP Q3 (delayed): 3.2 percent
• Durable Goods Orders (Oct, delayed): -1.1 percent
9 15 AM
• Industrial Production (Oct): 0.1 percent
• Capacity Utilization (Oct): 75.9 percent
• Industrial Production (Nov): 0.1 percent
• Capacity Utilization (Nov): 76.0 percent
10 00 AM
• Consumer Confidence (Dec): 91.7
Wednesday, Dec 24
8 30 AM
• Initial Jobless Claims (Dec 20): 225,000
Thursday, Dec 25
• Christmas Holiday — Markets Closed
Friday, Dec 26
• No major data scheduled
⚠️ Disclaimer: For informational use only — not financial advice.
📌 #SPY #SPX #markets #macro #holidayweek #GDP #durablegoods #consumerconfidence

ETHUSD - Leverage Ratio Hits ALL-TIME HIGH
BITSTAMP:ETHUSD is trading at approximately 2976 USD after a sharp 28 percent correction from the December 14-15 highs near 3980 USD to the December 18-19 lows around 2850 USD. While the hawkish Federal Reserve meeting triggered this selloff, on-chain data is flashing unprecedented bullish signals. Binance's Estimated Leverage Ratio just hit an ALL-TIME HIGH of 0.611, and the Taker Buy/Sell Ratio spiked to 1.13 - levels not seen since September 2023. Traders are positioning aggressively for upside. The question now: is the capitulation complete, or does high leverage create liquidation risk?
Current Market Context - December 21, 2025
Ethereum experienced one of its sharpest weekly declines in recent months, dropping from nearly 4000 USD to below 2900 USD in just four days. The catalyst was the Federal Reserve December 18 meeting where the central bank delivered a more hawkish stance than markets anticipated, projecting only two rate cuts for 2026.
The selloff was exacerbated by:
Broad risk-off sentiment across all crypto assets
Bitcoin dropping from 108000 USD to below 92000 USD
Over 1 billion USD in crypto liquidations within 24 hours
Ethereum ETF outflows as institutional investors reduced exposure
Year-end profit taking and portfolio rebalancing
However, the bounce from 2850 USD and current stabilization around 2976 USD suggests the initial panic selling may be exhausted. More importantly, on-chain metrics are telling a different story than price action.
CRITICAL ON-CHAIN DATA - Record Bullish Positioning
Estimated Leverage Ratio - ALL-TIME HIGH
Data from CryptoQuant shows Ethereum's Estimated Leverage Ratio on Binance has climbed to 0.611 - the highest level EVER recorded for this metric. This ratio compares open interest to exchange reserves, revealing how much borrowed capital traders are deploying relative to available liquidity.
What this means:
Traders are committing record leveraged positions anticipating favorable price movement
Current reading surpasses ALL previous cycle peaks
This environment amplifies price moves - modest spot changes can trigger large liquidations
Risk appetite among traders is at unprecedented levels
Taker Buy/Sell Ratio - Highest Since September 2023
The Taker Buy/Sell Ratio recently spiked to 1.13 on Binance - a level last observed in September 2023. A reading above 1 indicates market participants are executing more buy orders than sell orders.
Strong taker demand combined with rising leverage reveals optimism dominating short-term sentiment
Historical data shows spikes in this ratio often coincide with increased volatility
Traders are positioning ahead of a potential attempt to reclaim 3000 USD
This buying pressure is notable given ETH is trading around 2900-3000 USD
WARNING: While these metrics are bullish, record leverage is a double-edged sword. If price moves against leveraged positions, liquidation cascades can accelerate downside moves dramatically.
Technical Structure Analysis
Price Action Overview - 45 Minute Timeframe
Analyzing the chart from December 14-21, 2025:
Phase 1 - Distribution and Initial Decline (Dec 14-16):
Price peaked near 3980 USD on December 14
Initial breakdown below 3900 USD signaled distribution
Steady decline through 3800, 3700, 3600 levels
Lower highs forming on each bounce attempt
Volume increasing on down moves - classic distribution signature
Phase 2 - Capitulation Event (Dec 17-19):
Sharp acceleration of selling on December 17-18
Price crashed through multiple support levels without pause
Breakdown from 3400 to 2850 USD in approximately 36 hours
This represented a 16 percent drop in less than two days
Capitulation volume spike visible on the December 18-19 lows
Long wicks on candles near 2850 USD showing buyer absorption
Phase 3 - Stabilization and Accumulation (Dec 19-21):
Strong bounce from 2850 USD low
Price recovered to 2976 USD representing 4.4 percent recovery from lows
Higher lows forming: 2850 to 2880 to 2920 to current levels
Consolidation range establishing between 2950-3000 USD
Decreasing volatility suggesting selling pressure exhaustion
On-chain data confirms accumulation phase is active
Key Support and Resistance Levels
Resistance Levels:
3000-3020 USD - Immediate psychological resistance and round number
3080-3100 USD - Previous support turned resistance from December 17
3200-3250 USD - Major horizontal resistance zone
3400-3450 USD - Secondary resistance from pre-crash consolidation
3600-3650 USD - Major resistance zone
3900-4000 USD - December highs and psychological barrier
Support Levels:
2950-2960 USD - Immediate support from current consolidation
2900-2920 USD - Recent higher low support
2850-2870 USD - Capitulation low and critical support
2700-2800 USD - MAJOR DEMAND ZONE (Analyst Confluence)
2600-2650 USD - Deep support from November 2025 levels
The 2700-2800 Demand Zone - Analyst Confluence
Crypto analyst Ted Pillows has outlined a clear technical roadmap identifying the 2700-2800 USD zone as a major demand area . According to his analysis, ETH recently tapped into this important demand zone and has started to rebound. This move occurred when Ethereum broke below 3000 USD to reach a low of 2781 USD on December 18.
Multiple analysts are highlighting this zone as critical support with strong buyer interest. The fact that price bounced sharply from this area and on-chain metrics show record bullish positioning suggests smart money is accumulating here.
Chart Pattern Analysis
The current structure shows characteristics of a potential falling wedge pattern:
Lower highs connecting from 3980 to 3400 to 3100 area
Lower lows from 3600 to 3000 to 2850
However, the most recent price action shows higher lows forming off 2850
This divergence between lower highs and higher lows creates compression
Breakout direction will determine next major move
Falling wedges typically resolve to the upside
Fibonacci Retracement Analysis
Measuring from the November 2025 low (approximately 2400 USD) to the December 2025 high (3980 USD):
0.236 retracement: 3607 USD - Already broken
0.382 retracement: 3376 USD - Already broken
0.5 retracement: 3190 USD - Already broken
0.618 retracement: 3004 USD - Currently testing this level
0.786 retracement: 2739 USD - Held as support (low was 2850)
The bounce from near the 0.786 Fibonacci level is significant. This deep retracement level often marks the end of corrections in strong trends. The current test of the 0.618 level (3004 USD) will be crucial - a reclaim would be bullish, rejection would suggest more downside.
Fundamental Analysis
Federal Reserve Impact
The December 18, 2025 FOMC meeting was the primary catalyst for the selloff:
Fed held rates steady but projected only two rate cuts for 2026
Markets had priced in three to four cuts, creating hawkish surprise
Fed Chair emphasized data dependency and willingness to maintain restrictive policy
Higher-for-longer rates increase opportunity cost of holding crypto assets
Risk assets across the board sold off following the announcement
Altcoin Season Approaching - January 2026
A growing number of market analysts believe the long-awaited altcoin season may finally arrive in January 2026, with new data suggesting a shift in liquidity conditions. Ethereum's market behavior has attracted analysts who are highlighting a shift in leadership, typically seen only after a strong Bitcoin rally.
This is significant because:
Bitcoin has already made its major move from 60K to 108K
Capital rotation into altcoins typically follows BTC dominance peaks
ETH historically leads altcoin rallies
January sees fresh institutional allocations entering the market
Ethereum-Specific Fundamentals
Despite the price decline, Ethereum fundamentals remain constructive:
Ethereum staking continues to grow with over 34 million ETH staked
Layer 2 adoption accelerating with Base, Arbitrum, and Optimism seeing record activity
Ethereum ETF infrastructure now established providing institutional access
Pectra upgrade scheduled for Q1 2026 bringing account abstraction improvements
DeFi Total Value Locked on Ethereum remains above 60 billion USD
Security Concerns - Risk Factor
The crypto space continues to face security challenges:
December 20: A trader lost nearly 50 million USD in USDT to an address poisoning attack
2025 has seen over 3.4 billion USD in crypto thefts - a record year
The February Bybit hack (1.4 billion USD) accounted for 44 percent of annual losses
These incidents create headline risk and can spook retail investors
However, institutional infrastructure and security practices continue improving
ETF Flow Analysis
Ethereum ETF flows have been mixed:
December saw net outflows as institutions reduced risk exposure ahead of year-end
The post-Fed selloff accelerated ETF redemptions
However, long-term institutional interest remains intact
January typically sees renewed institutional buying as new year allocations begin
ETF structure provides easier access for institutions to re-enter on dips
Ethereum vs Bitcoin Analysis
The ETH/BTC ratio provides important context:
ETH has underperformed BTC during this correction
ETH/BTC ratio declined from 0.037 to 0.032 area
This underperformance is typical during risk-off periods
However, ETH tends to outperform during recovery phases
Vitalik Buterin himself said years ago he would respect a technically competent rival - but none has emerged
A stabilization in ETH/BTC would be early signal of ETH strength returning
Directional Bias Assessment
Arguments for Bullish Reversal:
LEVERAGE RATIO AT ALL-TIME HIGH (0.611) - Record bullish positioning
TAKER BUY/SELL RATIO AT 1.13 - Highest since September 2023
Capitulation volume and price action suggest panic selling exhausted
Bounce from 0.786 Fibonacci level is technically significant
2700-2800 demand zone confirmed by multiple analysts
Higher lows forming off the 2850 USD bottom
Exchange outflows during dip suggest accumulation occurring
Altcoin season expected January 2026 per multiple analysts
Strong fundamental backdrop with staking growth and L2 adoption
Pectra upgrade catalyst approaching in Q1 2026
Arguments for Bearish Continuation:
Price remains below all major moving averages
No confirmed trend reversal pattern yet
Fed hawkishness could continue pressuring risk assets
RECORD LEVERAGE = LIQUIDATION RISK if price drops
ETH underperforming BTC suggests relative weakness
Holiday liquidity conditions could exacerbate any selling
3000 USD psychological resistance may cap rallies
Security concerns (50M hack, 3.4B stolen in 2025) create headline risk
ETF outflows may continue into year-end
My Assessment - Bullish with Leverage Caution:
The weight of evidence leans bullish. Record on-chain metrics showing unprecedented trader positioning for upside, combined with technical support holding and analyst confluence on the 2700-2800 demand zone, suggests the capitulation low should hold.
HOWEVER - the record leverage is a double-edged sword. If 2850 breaks, liquidation cascades could accelerate the move down significantly.
Bullish Confirmation: A daily close above 3050 USD with volume would confirm the bottom and open path to 3200-3400 USD.
Bearish Confirmation: A break below 2850 USD would trigger leveraged liquidations and open path to 2600-2750 USD.
Short-term (next 1-2 weeks): Bullish bias. On-chain data strongly supports upside. Expect attempt to reclaim 3000 USD and test 3200 USD.
Long-term (1-3 months): Bullish. Altcoin season catalyst in January, Pectra upgrade in Q1, and structural drivers intact. Targets of 3400-3600 USD valid for Q1 2026.
Trade Framework
Scenario 1: Bullish Breakout Trade
Entry Conditions:
45-minute candle closes decisively above 3020 USD
Volume on breakout candle exceeds recent average
RSI breaks above 55 confirming momentum shift
Trade Parameters:
Entry: 3025-3050 USD on confirmed breakout
Stop Loss: 2920 USD below recent higher low
Target 1: 3150-3200 USD previous support zone
Target 2: 3350-3400 USD major resistance
Target 3: 3550-3600 USD extended target
Risk-Reward: Approximately 1:2.5 to first target
Scenario 2: Buy the Dip at Demand Zone
Entry Conditions:
Price retests 2700-2800 USD demand zone
Bullish rejection candle with long lower wick
RSI showing oversold bounce
Volume spike on the bounce candle
Trade Parameters:
Entry: 2750-2800 USD on demand zone retest
Stop Loss: 2650 USD below demand zone
Target 1: 3000-3020 USD psychological resistance
Target 2: 3150-3200 USD major resistance
Target 3: 3350-3400 USD extended target
Risk-Reward: Approximately 1:3 to first target
Scenario 3: Bearish Breakdown Trade
Entry Conditions:
45-minute candle closes below 2850 USD
Volume confirmation on breakdown
Leverage liquidations begin cascading
Trade Parameters:
Entry: 2840-2850 USD on confirmed breakdown
Stop Loss: 2920 USD above recent consolidation
Target 1: 2750-2780 USD secondary support
Target 2: 2650-2700 USD major support
Target 3: 2500-2550 USD extended target
Risk-Reward: Approximately 1:2 to first target
Risk Management Guidelines
Position sizing should not exceed 2-3 percent risk per trade
CRITICAL: Record leverage means volatility will be amplified
Reduce size during holiday period due to lower liquidity
Use hard stop losses - liquidation cascades can move price fast
Scale into positions using multiple entries rather than single entry
Take partial profits at each target level (33 percent at each)
Move stop to breakeven after first target achieved
Monitor BTC price action as correlation remains high
Invalidation Levels
Bullish thesis invalidated if:
Price closes below 2700 USD on 4-hour or daily timeframe
Lower low forms below the December 18-19 capitulation low
ETH/BTC ratio breaks to new lows below 0.030
BTC breaks below 88000 USD triggering broader selloff
Bearish thesis invalidated if:
Price closes above 3200 USD with volume
Higher high forms above 3100 USD
RSI breaks above 60 with momentum
ETH/BTC ratio recovers above 0.036
Conclusion
BITSTAMP:ETHUSD has experienced a sharp 28 percent correction from the December highs near 3980 USD to the capitulation low around 2850 USD. While the Fed meeting triggered the selloff, on-chain data tells a powerfully bullish story.
The Numbers That Matter:
Leverage Ratio: 0.611 - ALL-TIME HIGH
Taker Buy/Sell Ratio: 1.13 - Highest since September 2023
Demand Zone: 2700-2800 USD - Multiple analyst confluence
Fibonacci Support: 0.786 level held (2739 USD)
Key Levels to Watch:
3000-3020 USD - Breakout confirmation level
2850 USD - Critical support / capitulation low
2700-2800 USD - Major demand zone
3200 USD - Major resistance for trend confirmation
Trading Approach:
The on-chain data strongly favors bulls, but record leverage means you must respect risk management. Wait for either:
Bullish breakout above 3020 USD with volume to confirm bottom
Retest of 2700-2800 USD demand zone for lower-risk long entry
Breakdown below 2850 USD to flip bearish (watch for liquidation cascade)
Altcoin season approaching in January 2026 provides a macro tailwind. The setup favors patient bulls who manage risk appropriately.
Drop your comments below on the next move for ETH!

WETUSDT: : short setup from daily support at 0.17900BINANCE:WETUSDT.P has been falling practically since its listing. Today, the price hit the all-time low formed 2 days ago, and it is noteworthy that it hit the 0.179 level precisely. This level is now confirmed. All that remains is to wait for the market to be ready for its break. It is important to wait for the signals listed below, in a list format, before taking any short, as the asset is new and not entirely predictable.
Key factors for this scenario:
Global & local trend alignment
Price void / low liquidity zone beyond level
Volatility contraction on approach
Immediate retest
Repeated precise tests of the level
Closing near the level
Closing near the bar's extreme
Factors that contradict this scenario:
Lack of consolidation
Was this analysis helpful? Leave your thoughts in the comments and follow to see more.

1000LUNCUSDT.P: short setup from daily support at 0.04315BINANCE:1000LUNCUSDT.P , following a strong rally, consolidated briefly and then started returning to where it came from, as is often the case. We currently have a local level at 0.04315, above which the price is consolidating. The crucial criterion in this situation will be to wait for the daily bar close (UTC). If the close is near the level and close to the day's low, these will be good signals for a short position.
Key factors for this scenario:
Price void / low liquidity zone beyond level
Volatility contraction on approach
Immediate retest
Closing near the level
Closing near the bar's extreme
Factors that contradict this scenario:
Lack of consolidation
Was this analysis helpful? Leave your thoughts in the comments and follow to see more.

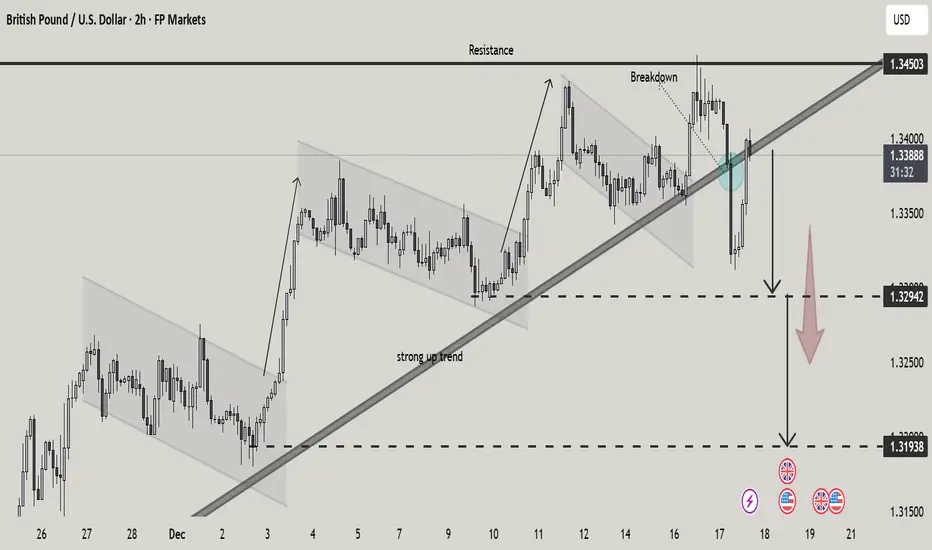
GBPUSD Trendline Breakdown Deeper Pullback from Key ResistanceThis 2-hour GBP/USD chart highlights a strong bullish structure built on a rising trendline, with price respecting higher lows throughout early December. Multiple ascending and corrective channels show controlled upside momentum.
Price recently tested a major resistance zone near 1.3450, failed to hold above it, and then broke down below the rising trendline, marked by the highlighted breakdown area. This loss of structure suggests a trend exhaustion / corrective phase rather than immediate continuation.
Key downside levels are clearly mapped:
1.3294 as the first support / breakdown confirmation level
1.3194 as a deeper downside target if bearish momentum accelerates
The chart effectively illustrates a transition from trend continuation to corrective risk, with sellers gaining short-term control after rejection at resistance.
EURUSD: Support & Resistance Analysis For Next Week 🇪🇺🇺🇸
Here is my latest structure analysis and important
supports and resistances for EURUSD for next week.
Consider these structures for pullback/breakout trading.
❤️Please, support my work with like, thank you!❤️
I am part of Trade Nation's Influencer program and receive a monthly fee for using their TradingView charts in my analysis.

What to Expect From Gold on Monday?!
As Christmas Holidays are just around the corner, we see that
many instruments started to slow down and overall volatility dropped
significantly.
Gold remained relatively calm the last week too.
The price formed a narrow horizontal range on an hourly time frame,
respecting that from Tuesday.
I think that we will see a continuation of such a consolidation after the market opening.
Gold will likely stay calm at least till the release of the US Core PCE Price Index
after the NY Session opening.
Expect price movements within the range.
❤️Please, support my work with like, thank you!❤️
I am part of Trade Nation's Influencer program and receive a monthly fee for using their TradingView charts in my analysis.

Key Levels – Where Gold Reacts, Not Indicators?Many traders start trading gold using indicators, and that’s something almost everyone goes through. However, the longer you stay in the market, the more clearly you realize one important truth: gold does not react to indicators; it reacts at key levels . Indicators only describe what price has already done, while key levels are where real money actually makes decisions.
Price does not move randomly. It reacts at important price zones.
Key levels are areas where the market has shown clear reactions in the past — strong reversals, repeated rejections, or consolidation before a breakout. In gold trading, these zones often align with major highs and lows, round numbers, or areas of concentrated liquidity.
This is where both retail traders and large capital are paying attention.
One major reason many traders consistently enter too late is over-reliance on indicators. Indicators are always based on past price data, so when a signal appears, the key reaction has often already happened. At that point, entries are less attractive, risk-to-reward deteriorates, and the probability of false breaks or stop hunts increases.
Indicators are not wrong, but they always lag behind price.
Professional traders don’t try to predict whether price will go up or down. They wait for price to reach a key level and then observe how the market reacts. Is price strongly rejected, or does it break through easily? Is real buying or selling pressure actually showing up?
Key levels are not places to predict — they are places to observe and react.
This doesn’t mean indicators are useless. Indicators still have value for momentum confirmation or for understanding market context. But they should not be the primary factor for making entry decisions.
Key levels tell you where to trade.
Indicators only help you understand how price is behaving.
Conclusion
If you are trading gold and still searching for the “best indicator for XAUUSD,” you may be asking the wrong question.
The better question is:
Which key level is the market respecting right now?
Because in the end, price reacts at levels — not at indicators.

$SPY: 15m Structural Repair & Dynamic Trend BreakoutWhat I’m Seeing: I am currently observing a confluence on the AMEX:SPY 15-minute chart following the Friday close at $680.59. My Structure Engine shows that price has fully cleared the $679 intraday demand threshold, effectively 'repairing' the liquidity void created during the mid-morning dip. Simultaneously, the Automatic Trend Line script has printed a fresh support level at $679.50, confirming that the short-term trend is now realigned with the larger bullish bias.
Why It Matters: This 15m confluence is a high-confidence signal for intraday expansion. By 'sealing' the void below $679, the market has established a new structural floor. When the Automatic Trend Line engine identifies support right on top of a repaired zone, it indicates that the 'path of least resistance' has shifted upward. It suggests that intraday sellers have been absorbed and momentum is now being guided by the dynamic trend.
What I Expect to See Next: I expect the 15m trend to hold as price targets the immediate pivot high at $681.50. If we see a 15m candle body close above $681.50, the 'void' to the next major resistance at $684.22 (Monday's projected range high) becomes the primary target. I will be watching for the Trend Engine to maintain its slope; a breakdown below the $676.75 support would invalidate this short-term structural repair thesis.

XAUUSD 51st Record High of 2025 | Symmetrical Triangle BreakoutHistoric Context - A Record-Breaking Year
According to the Wall Street Journal and Dow Jones Market Data released December 19, 2025:
Gold futures have closed at record highs 51 times in 2025
Price has surged 66 percent year-to-date to 4387.30 USD per troy ounce
This is gold's best annual performance since 1979
Silver has soared 131 percent in 2025, hitting 14 record highs
Both metals are on pace for their biggest gains since 1979, the last year they hit this many records
This historic context is critical for understanding current price action. We are not in a normal market environment. Gold is experiencing a generational bull run driven by central bank accumulation, geopolitical uncertainty, and monetary policy expectations.
Current Market Context - December 20, 2025
Gold experienced volatility following the Federal Reserve December 18, 2025 policy decision. The central bank maintained its hawkish stance, projecting fewer rate cuts for 2026 than markets anticipated. Despite this headwind, gold recovered and hit another record high on December 19.
The resilience above 4300 USD despite hawkish Fed rhetoric demonstrates the strength of underlying demand from central banks and institutional investors.
Key Events This Week:
December 18: Federal Reserve held rates steady, projected only two rate cuts for 2026 versus market expectations of three to four
December 18: US Dollar Index surged following hawkish Fed commentary, initially pressuring gold
December 19: Gold recovered to close at 51st record high of 2025 at 4387.30 USD according to WSJ
December 19: CFTC COT report released showing strong speculative long positioning
December 20: Price consolidating near 4338 USD within symmetrical triangle pattern
Ongoing: PBOC and Chinese ETF buying continues despite record high prices
Ongoing: Physical demand weakness in India and China as discounts widen to multi-year highs
Technical Structure Analysis
Pattern Identification - Symmetrical Triangle
The 45-minute chart displays a textbook symmetrical triangle formation characterized by:
Converging trendlines with lower highs and higher lows
Decreasing volatility as price compresses toward the apex
Volume declining during the consolidation phase
Pattern duration of approximately 10-12 days
Apex convergence point approaching within the next 24-48 hours
Symmetrical triangles are continuation patterns approximately 55-60 percent of the time, but given the preceding choppy price action, this formation could break in either direction.
Triangle Boundaries
Upper Trendline (Descending Resistance):
Connects the highs from December 12-13 around 4380-4390 USD
Currently intersecting near 4355-4360 USD
A decisive close above this trendline signals bullish breakout
Lower Trendline (Ascending Support):
Connects the lows from December 9-10 and December 18-19
Currently providing support near 4300-4310 USD
A decisive close below this trendline signals bearish breakdown
Key Price Levels
Resistance Levels:
4355-4360 USD - Descending trendline resistance immediate
4380-4390 USD - Recent swing high and horizontal resistance
4400-4410 USD - Psychological resistance and previous rejection zone
4450-4475 USD - Major resistance from November 2025 highs
4500 USD - Psychological round number and measured move target
Support Levels:
4310-4320 USD - Ascending trendline support immediate
4280-4290 USD - Horizontal support from December lows
4250-4260 USD - Previous consolidation zone
4200-4220 USD - Major support and psychological level
4150-4175 USD - Secondary support if breakdown accelerates
Moving Average Analysis
Price is oscillating around the 20-period moving average indicating indecision
The 50-period moving average is relatively flat confirming the consolidation phase
The 200-period moving average on higher timeframes remains in uptrend supporting long-term bullish bias
A sustained move above the 20 and 50 MAs would confirm bullish momentum
A breakdown below both MAs would signal bearish continuation
RSI Analysis
RSI on the 45-minute timeframe is currently neutral oscillating between 45-55
No overbought or oversold conditions present
RSI is forming a similar compression pattern to price suggesting energy building for directional move
Watch for RSI to break above 60 for bullish confirmation or below 40 for bearish confirmation
Volume Analysis
Volume has been declining during the triangle formation typical behavior before breakout
Expect volume surge on the breakout candle to confirm validity
Low volume breakouts often result in false moves and should be treated with caution
Watch for volume at least 150 percent of average on breakout candle
Fibonacci Analysis
Measuring from the December low near 4200 USD to the December high near 4390 USD:
0.236 retracement: 4345 USD - Currently testing this level
0.382 retracement: 4317 USD - Aligns with triangle support
0.5 retracement: 4295 USD - Key level if support breaks
0.618 retracement: 4273 USD - Strong support zone
Current price action around 4338 USD is testing the 0.236 Fibonacci level, a relatively shallow retracement suggesting buyers remain interested.
CFTC Commitments of Traders Analysis - December 19, 2025
The latest COT report released December 19, 2025 provides critical insight into market positioning:
Gold Futures Only Positions as of December 9, 2025:
Open Interest: 432,569 contracts
Non-Commercial Long: 268,485 contracts ( 62.1 percent of open interest)
Non-Commercial Short: 44,599 contracts (10.3 percent of open interest)
Commercial Long: 63,707 contracts (14.7 percent)
Commercial Short: 326,286 contracts ( 75.4 percent )
Changes from December 2, 2025:
Open Interest increased by 14,079 contracts
Non-Commercial Longs added 7,154 contracts
Non-Commercial Shorts added only 828 contracts
Commercial Shorts added 10,791 contracts
COT Interpretation:
The positioning data reveals several important dynamics:
Speculators (Non-Commercial) are heavily net long with 62.1 percent long versus only 10.3 percent short
This represents a 6:1 long to short ratio among speculators - extreme bullish positioning
Commercial hedgers (producers and merchants) are heavily short at 75.4 percent, which is normal hedging behavior in a bull market
Open interest is increasing alongside price, confirming the uptrend has participation
The continued addition of speculative longs suggests momentum traders remain committed to the bull case
Warning Signal: Extreme speculative long positioning can precede corrections when longs begin to take profits. However, in strong trending markets, positioning can remain extreme for extended periods. The key is watching for a shift in the weekly changes - if longs start liquidating while price stalls, that would be a bearish signal.
Physical Demand Analysis - Asia Market Weakness
Reuters reported on December 19, 2025 that physical gold demand in Asia has weakened significantly due to record high prices:
India Market:
Dealers offering discounts of up to 37 USD per ounce to official domestic prices, up from 34 USD last week
Domestic gold prices hit fresh record of 135,590 rupees per 10 grams
Demand is roughly one quarter of normal levels according to PN Gadgil and Sons CEO
Wedding season jewelry purchases dampened despite being peak demand period
Demand expected to remain subdued as prices continue rising
China Market:
Bullion trading at discounts of up to 64 USD to global benchmark - highest in over five years
This is the widest discount since August 2020 during COVID-19 pandemic
Wholesale and retail demand described as incredibly weak by analyst Ross Norman
However, ETF buying and PBOC purchases continue despite weak physical demand
Other Asian Markets:
Singapore: Trading from 0.5 USD discount to 2.2 USD premium
Hong Kong: Trading from par to 1.8 USD premium
Japan: Discounts up to 6.0 USD, though retail shops out of gold bar stocks
Physical Demand Interpretation:
The divergence between weak physical demand and strong prices is significant:
Traditional price-sensitive buyers in India and China are stepping back at these levels
However, institutional demand (ETFs, central banks) is offsetting physical weakness
PBOC continues accumulating gold as part of reserve diversification strategy
This suggests the rally is being driven by institutional and speculative flows rather than traditional jewelry demand
A correction could occur if institutional buying slows, as physical demand is unlikely to provide support at current prices
Fundamental Analysis
Federal Reserve Policy Impact
The December 18, 2025 FOMC meeting delivered several key takeaways affecting gold:
Interest rates held steady as expected but forward guidance was more hawkish than anticipated
Dot plot projections showed median expectation of only two rate cuts in 2026
Fed Chair emphasized data dependency and willingness to maintain restrictive policy longer if needed
Inflation concerns remain despite progress with services inflation proving sticky
Labor market remains resilient reducing urgency for rate cuts
Implications for Gold:
Higher-for-longer interest rates are traditionally bearish for gold as they increase the opportunity cost of holding non-yielding assets. However, gold has shown remarkable resilience to rate expectations in 2024-2025, suggesting other factors are driving demand.
US Dollar Dynamics
The US Dollar Index strengthened following the hawkish Fed reaching multi-week highs
Dollar strength typically pressures gold prices due to inverse correlation
However the correlation has weakened in recent months as both assets attract safe-haven flows
Watch DXY price action for confirmation of gold direction
A reversal in dollar strength would provide tailwind for gold
Central Bank Demand
Central bank gold purchases remain a crucial support factor despite weak retail demand:
Global central banks have been net buyers of gold for consecutive years
PBOC (People's Bank of China) continues accumulating gold alongside Chinese ETF buying according to analyst Ross Norman
India central bank has increased gold reserves significantly
Emerging market central banks continue accumulating gold as reserve diversification from USD
This institutional and central bank demand is offsetting weak physical retail demand in Asia
Central bank buying provides structural floor under prices even when retail demand weakens
Geopolitical Factors
Safe-haven demand remains elevated due to:
Russia-Ukraine conflict continues with no resolution in sight
Middle East tensions remain elevated with ongoing regional instability
US-China relations remain strained with trade and technology disputes
Global election cycle creating policy uncertainty
Debt ceiling and fiscal concerns in major economies
These factors support gold safe-haven bid and help explain its resilience despite hawkish Fed policy.
Directional Bias Assessment
Arguments for Bullish Breakout:
Gold has hit 51 record highs in 2025 - momentum clearly favors bulls
Best annual performance since 1979 with 66 percent YTD gains
Long-term uptrend remains intact on daily and weekly timeframes
COT data shows speculators adding to long positions with 62.1 percent long exposure
Central bank and ETF demand continues despite weak physical demand
PBOC accumulation ongoing according to analyst reports
Geopolitical tensions maintaining safe-haven bid
Technical measured move target of 4480-4500 USD if triangle breaks higher
Arguments for Bearish Breakdown:
Extreme speculative long positioning (6:1 ratio) creates correction risk
Physical demand in India at one quarter of normal levels
China discounts at 64 USD - widest since August 2020
Hawkish Fed policy supporting stronger dollar and higher yields
Price has risen 66 percent in one year - mean reversion risk elevated
Holiday liquidity reduction could exacerbate any profit-taking
Technical measured move target of 4200-4220 USD if triangle breaks lower
My Assessment - Cautiously Bullish with Correction Risk:
The weight of evidence supports the bull case given the historic momentum and institutional demand. However, several warning signs warrant caution:
Extreme speculative positioning creates vulnerability to profit-taking
Physical demand weakness in Asia suggests price-sensitive buyers are exhausted
The rally is increasingly dependent on institutional flows rather than broad-based demand
Short-term (next 1-2 weeks): Neutral to slightly bearish. The combination of extreme positioning, weak physical demand, and holiday liquidity conditions creates correction risk. A pullback to 4280-4320 USD would be healthy and provide better entry for longs.
Long-term (1-3 months): Bullish. The structural drivers (central bank buying, geopolitical uncertainty, monetary policy expectations) remain intact. Any correction should be viewed as buying opportunity. Targets of 4500-4600 USD remain valid for Q1 2026.
Trade Framework
Scenario 1: Bullish Breakout Trade
Entry Conditions:
45-minute candle closes decisively above 4360 USD upper trendline
Volume on breakout candle exceeds 150 percent of 20-period average
RSI breaks above 60 confirming momentum
Ideally accompanied by dollar weakness DXY declining
Trade Parameters:
Entry: 4365-4370 USD on confirmed breakout
Stop Loss: 4330 USD below triangle midpoint
Target 1: 4400-4410 USD previous resistance
Target 2: 4450-4460 USD November highs
Target 3: 4500-4520 USD measured move target
Risk-Reward: Approximately 1:2.5 to first target
Scenario 2: Bearish Breakdown Trade
Entry Conditions:
45-minute candle closes decisively below 4300 USD lower trendline
Volume on breakdown candle exceeds 150 percent of 20-period average
RSI breaks below 40 confirming bearish momentum
Ideally accompanied by dollar strength DXY rising
Trade Parameters:
Entry: 4295-4300 USD on confirmed breakdown
Stop Loss: 4340 USD above triangle midpoint
Target 1: 4250-4260 USD horizontal support
Target 2: 4200-4220 USD major support
Target 3: 4150-4175 USD measured move target
Risk-Reward: Approximately 1:2 to first target
Risk Management Guidelines
Position sizing should not exceed 1-2 percent risk per trade given current volatility
Reduce position size during holiday period due to lower liquidity
Use hard stop losses do not move stops further from entry
Scale out of positions at each target level 33 percent at each target
Move stop to breakeven after first target achieved
Avoid holding large positions over weekend given geopolitical risks
Monitor DXY and Treasury yields for confirmation of gold direction
Be prepared for false breakouts wait for candle close confirmation
Invalidation Levels
Bullish thesis invalidated if:
Price closes below 4250 USD on daily timeframe
Triangle breaks down with volume confirmation
DXY breaks to new highs above 110
Bearish thesis invalidated if:
Price closes above 4410 USD on daily timeframe
Triangle breaks up with volume confirmation
DXY reverses sharply below 106
Conclusion
OANDA:XAUUSD has delivered a historic performance in 2025 with 51 record highs and 66 percent gains - the best year since 1979. The precious metal is currently consolidating within a symmetrical triangle near 4338 USD, setting up for the next directional move.
Key Data Points:
51 record highs in 2025 according to Dow Jones Market Data
66 percent YTD gains - best since 1979
COT shows 62.1 percent speculative long positioning (6:1 long/short ratio)
India physical demand at 25 percent of normal levels
China discounts at 64 USD - widest since August 2020
PBOC and ETF buying continues despite weak retail demand
Key Takeaways:
The symmetrical triangle is approaching its apex suggesting a breakout is imminent within the next 24-72 hours
Historic momentum (51 records) supports bullish bias but extreme positioning creates correction risk
Physical demand weakness in Asia is a warning sign that price-sensitive buyers are exhausted
Institutional demand (central banks, ETFs) is currently offsetting retail weakness
Short-term bias is neutral with correction risk; long-term bias remains bullish
Bullish breakout targets 4450-4500 USD; bearish breakdown targets 4250-4280 USD
Risk management is critical given extreme positioning and holiday liquidity conditions
The optimal approach is to wait for confirmed breakout with volume rather than anticipating direction. Given the extreme speculative positioning, any breakdown could trigger rapid profit-taking. Conversely, a breakout to new highs could accelerate as shorts cover.
Trade the breakout, not the anticipation. Let price confirm direction before committing capital.
This is not financial advice. Always conduct independent research and manage risk appropriately.

Don’t Rush to Call the Top on EURUSDEURUSD in the late December 20–21 period is showing a clearly bullish picture , supported by both fundamental news and technical structure . This is not a euphoric phase , but rather a period where the market slows down to accumulate before making its next move.
From a fundamental perspective, the ECB has kept interest rates unchanged and delivered a relatively positive outlook, while the USD lacks fresh momentum as U.S. data has not been strong enough to push the Fed back into a hawkish stance. This backdrop allows the euro to maintain a short-term advantage.
On the chart, price remains firmly above the 1.1680 support zone , and the Higher Low structure is still intact. The Ichimoku setup shows sideways movement above a thin cloud , a condition that often appears before a trend continuation rather than a reversal.
As long as the current support holds , the preferred scenario remains EURUSD pushing higher toward 1.1750, with the potential to retest the upper resistance zone. When the trend has not broken , following the flow is far wiser than trying to predict a top.

SOLUSD - December Distribution Structure
Executive Summary
COINBASE:SOLUSD has declined approximately 52 percent from its November 2024 all-time high of 264 USD to current levels around 126 USD. This analysis examines the technical structure, on-chain metrics, and fundamental catalysts to determine high-probability trade zones. The evidence suggests further downside toward the 100-115 USD accumulation zone before a sustainable recovery can begin.
Technical Structure Analysis
Price Action Overview
Solana is currently trading within a descending channel that formed after the November 2024 peak. The structure shows:
Lower highs at 264, 220, 180, and 145 USD forming clear descending resistance
Lower lows indicating sustained selling pressure
Current price testing the 125-130 USD zone which previously acted as resistance in October 2024
Volume declining on bounces and increasing on selloffs - classic distribution signature
Key Support and Resistance Levels
Resistance Zones:
140-145 USD - Recent swing high rejection zone
160-165 USD - Previous support turned resistance
180-185 USD - Major structural resistance
Support Zones:
115-120 USD - Minor support, likely to break
100-105 USD - Major support, November 2024 breakout origin
85-90 USD - Secondary support if macro deteriorates
Moving Average Analysis
Price is trading below the 20, 50, and 200 period moving averages on the daily timeframe
The 20 MA has crossed below the 50 MA, confirming short-term bearish momentum
The 200 MA is flattening and beginning to slope downward
Moving averages are fanning out in bearish alignment
RSI and Momentum
Daily RSI is currently in the 35-40 range, approaching oversold but not yet at extreme levels
RSI has been making lower highs alongside price, confirming the downtrend
No bullish divergence present yet - divergence at the 100-115 zone would be a strong buy signal
Weekly RSI has room to decline further before reaching oversold extremes seen at previous bottoms
Volume Profile
High volume node exists at the 100-115 USD zone from the November 2024 accumulation period
Current price zone shows relatively low volume, suggesting lack of strong buyer interest
Volume has been declining during recent bounce attempts - weak demand
A volume spike at the 100-115 zone would confirm institutional accumulation
Fibonacci Retracement
Measuring from the September 2024 low of 120 USD to the November 2024 high of 264 USD:
0.382 retracement: 209 USD - Already broken
0.5 retracement: 192 USD - Already broken
0.618 retracement: 175 USD - Already broken
0.786 retracement: 151 USD - Already broken
Full retracement: 120 USD - Currently testing
The breakdown through the 0.786 level suggests the move is corrective in nature and a full retracement to the 100-120 USD origin zone is probable.
On-Chain and Fundamental Analysis
Network Activity Metrics
Solana network statistics show mixed signals:
Daily active addresses have declined from peak levels during the meme coin mania
Transaction counts remain elevated compared to other Layer 1 networks
Total Value Locked in Solana DeFi protocols has decreased from highs
NFT trading volume on Solana marketplaces has cooled significantly
Supply Distribution
Large holder concentration remains high with significant whale wallet activity
Exchange inflows have increased in recent weeks, indicating selling pressure
Staking participation remains strong, reducing liquid supply
FTX bankruptcy estate continues systematic liquidation of SOL holdings
Macro Factors Affecting Solana
Bearish Catalysts:
Federal Reserve December 2025 meeting maintained hawkish stance with fewer rate cuts projected for 2026
Risk-off sentiment affecting high-beta assets disproportionately
BITSTAMP:BTCUSD dominance rising, indicating capital rotation from altcoins to Bitcoin
Regulatory uncertainty regarding Solana ETF approval timeline
FTX estate selling pressure creating persistent supply overhang
Meme coin speculation that drove the 2024 rally has cooled substantially
Bullish Catalysts:
Solana network upgrades improving transaction throughput and reliability
Growing institutional interest in Solana ecosystem projects
Potential Solana ETF approval could drive significant inflows
Strong developer activity and ecosystem growth metrics
Firedancer client development progressing, promising improved network performance
Solana remains the preferred chain for new DeFi and consumer applications
Competitive Positioning
Solana maintains advantages over competing Layer 1 networks:
Transaction costs remain significantly lower than BITSTAMP:ETHUSD mainnet
Transaction speed and finality superior to most competitors
Developer ecosystem continues expanding despite price decline
Institutional partnerships and integrations increasing
However, challenges persist:
Network outages and congestion issues have damaged reputation
Centralization concerns regarding validator distribution
Competition from Ethereum Layer 2 solutions intensifying
Regulatory classification uncertainty in United States
Whale and Institutional Activity
Recent on-chain data indicates:
Large wallets have been net sellers over the past 30 days
Exchange deposits from whale addresses have increased
Institutional funds have reduced Solana allocation according to fund flow data
However, accumulation signals are appearing at lower price levels
The pattern suggests distribution at current levels with potential accumulation beginning at the 100-115 USD zone.
Trade Framework
Primary Scenario - Bearish Continuation (Higher Probability)
The weight of evidence supports further downside before a sustainable bottom forms:
Technical structure remains bearish with lower highs and lower lows
Price below all major moving averages
Macro environment unfavorable for risk assets
On-chain metrics showing distribution
No bullish divergence on momentum indicators yet
Short Setup:
Entry Zone: 130-140 USD on relief bounces
Stop Loss: Above 148 USD
Target 1: 115-118 USD
Target 2: 105-108 USD
Target 3: 95-100 USD
Secondary Scenario - Accumulation at Support
The 100-115 USD zone represents a high-conviction long opportunity if confirmation signals appear:
This zone was the origin of the November 2024 rally
High volume node from previous accumulation period
Full Fibonacci retracement level
Psychological round number support at 100 USD
Long Setup:
Entry Zone: 100-115 USD
Stop Loss: Below 92 USD
Target 1: 130-135 USD
Target 2: 150-160 USD
Target 3: 180-200 USD
Confirmation Signals Required for Long Entry:
Bullish RSI divergence on daily timeframe
Volume spike on bullish candle at support
Price reclaiming the 20 period moving average
Higher low formation on 4-hour timeframe
Decrease in exchange inflows from whale wallets
Risk Management
Position sizing should not exceed 2-3 percent of portfolio for short setups
Long setups at the 100-115 zone warrant 3-5 percent allocation due to higher conviction
Scale into positions using 3 tranches rather than single entry
Move stop loss to breakeven after first target achieved
Avoid trading the 120-130 USD range without clear directional confirmation
Monitor BITSTAMP:BTCUSD price action as correlation remains high
Invalidation Levels
Bearish thesis invalidated if:
Daily close above 150 USD with increasing volume
Price reclaims 50 and 200 moving averages
RSI breaks above 60 with momentum
Bullish thesis invalidated if:
Daily close below 92 USD
Volume spike on breakdown below 100 USD
Bitcoin breaks below 75000 USD triggering broader market selloff
Timeline Expectations
Short-term (1-4 weeks): Expect continued weakness toward 100-115 USD support zone
Medium-term (1-3 months): Potential basing pattern formation if support holds
Long-term (3-6 months): Recovery rally possible if macro conditions improve and Solana-specific catalysts materialize
Conclusion
COINBASE:SOLUSD is in a clear distribution phase following the November 2024 peak. The technical structure, on-chain metrics, and macro environment all point to further downside before a sustainable bottom forms.
The 100-115 USD zone represents the highest probability accumulation area based on:
Historical significance as the November 2024 breakout origin
Fibonacci full retracement level
High volume node from previous accumulation
Psychological support at 100 USD round number
The recommended approach is patience. Avoid buying at current levels where distribution is occurring. Wait for price to reach the 100-115 USD zone and confirm with bullish divergence and volume signals before establishing long positions.
For traders seeking short exposure, relief bounces to the 130-140 USD zone offer favorable risk-reward entries with defined stops above 148 USD.
This is not financial advice. Always conduct independent research and manage risk appropriately.

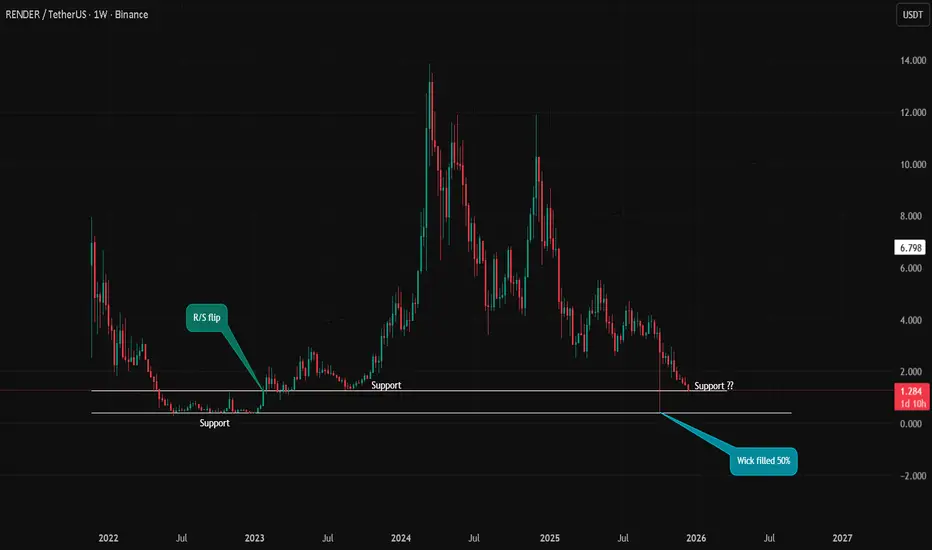
RNDR – Weekly Structure Price is currently trading at a major HTF support zone around $1.20–$1.30.
This level previously acted as strong support and resistance, making it a key decision area.
The recent downside wick has been partially filled (~50%), which often signals temporary demand, but structure is still bearish on the higher timeframe.
Key levels to watch:
Support: $1.20 – $1.30
Next downside risk: If this level fails → possible continuation lower
Bias:
As long as price holds above support → potential range / relief bounce
Weekly close below support → bearish continuation scenario
Patience is key here. Let price confirm direction before entering.
Not financial advice. Always manage risk.
MrC
BCH: $700–$800 Before the Next Bear MarketBCH Macro Resistance Before Bear Market
Based on historical price structure, Bitcoin Cash (BCH) appears to be approaching a macro resistance zone around $700–$800 , which has previously marked the final upside before major bear markets.
In 2018 and 2022, BCH followed a very similar pattern:
A prolonged accumulation phase
A strong push into a horizontal resistance zone
A rejection from that zone, followed by a deep bear market decline
The current structure closely mirrors those past cycles. Price is once again testing the same historical supply zone, where sellers previously stepped in aggressively.
Key idea:
I expect BCH to reach the $700–$800 range
This level could act as the last distribution zone before the broader market transitions into a new bear market phase
This is not a short-term trade idea, but a macro perspective based on repeating market behavior and long-term resistance reactions.
⚠️ As always, confirmation is needed, and this scenario is invalidated i f price accepts and holds above the resistance zone.

Market Panic: Gold or Crypto?When the market enters a state of panic, the question is no longer “How much profit can I make?” but rather “Which asset helps me survive and protect my capital?”
In moments like these, gold and crypto are often placed side by side. Both are seen as safe havens—but in very different ways, and that difference is the key to making the right decision.
1) Gold – Where Capital Flows When Confidence Breaks
Gold has existed for thousands of years with one core purpose: preserving value.
When inflation rises, geopolitical tensions escalate, or the financial system shows signs of stress, large capital tends to move into gold first.
Why gold performs well during crises:
High global liquidity, accepted across all markets
Relatively “orderly” volatility, suitable for defensive positioning
Often benefits when real interest rates fall and the USD weakens
In other words, gold won’t make you rich overnight, but it helps you avoid being washed away when the storm hits.
2) Crypto – An Asset Driven by Expectations and Emotion
Crypto represents a new generation of assets, where value is heavily influenced by future expectations, technology narratives, and speculative capital.
In normal or euphoric market conditions, crypto can rise very quickly.
But when panic sets in, the story changes.
Here’s the reality we need to face:
Crypto reacts extremely sensitively to “risk-off” sentiment
High leverage + thin liquidity during stress periods can trigger chain liquidations
In major shocks, crypto is often sold alongside growth stocks, rather than acting as a true safe haven
Therefore, crypto is not a defensive asset in the traditional sense—it is an asset of belief and market cycles.
3) When Should You Choose Gold? When Should You Hold Crypto?
The answer is not “which is better,” but what the market context is.
True panic (systemic risk, war, financial crisis):
➡ Gold is usually the preferred choice.
Capital seeks certainty, not stories.
Short-term crisis followed by monetary easing:
➡ Gold often leads the first wave,
➡ Crypto tends to recover more aggressively after a psychological bottom forms.
Stable markets with abundant liquidity:
➡ Crypto performs at its best.
4) My Perspective: Don’t Choose with Emotion
From my experience, the biggest mistake traders make during panic is choosing assets based on personal belief instead of capital flow and market behavior.
A professional trader asks:
Where is large capital taking refuge?
Is current volatility suitable for my trading style?
Is my goal capital preservation or outsized returns?
If your priority is safety and stability, gold is usually the more reasonable choice.
If you accept high risk in pursuit of high reward, crypto should only be approached after clear confirmation, not during extreme panic.

Adyen 1W: The trend broke twice, the market is just catching upOn the weekly chart, Adyen has broken the long term downtrend twice, and price is now performing a controlled pullback retest. The current consolidation holds above the $15.5–16.0 demand zone, where MA100, 0.786 Fibonacci and strong volume profile support align. Selling pressure is fading, volumes on the pullback are declining, and bullish divergence remains intact. This structure favors confirmation of the breakout rather than a return to a bearish trend. As long as price stays above this zone, upside remains the priority. First target stands at $19.94, followed by $23.23.
Fundamentally, Adyen continues to deliver consistent growth. H1 2025 revenue reached $1.28B, up from $1.13B in H2 2024. H2 2025 revenue is projected at $1.49B, with forecasts extending toward $1.53–1.88B in 2026–2027. EPS came in at $0.18 for H1 2025, with $0.21 expected in H2, rising toward $0.25–0.26 by 2027. Analyst sentiment leans bullish as digital payment volumes continue to expand globally.
When a trend breaks twice, patience usually gets paid.
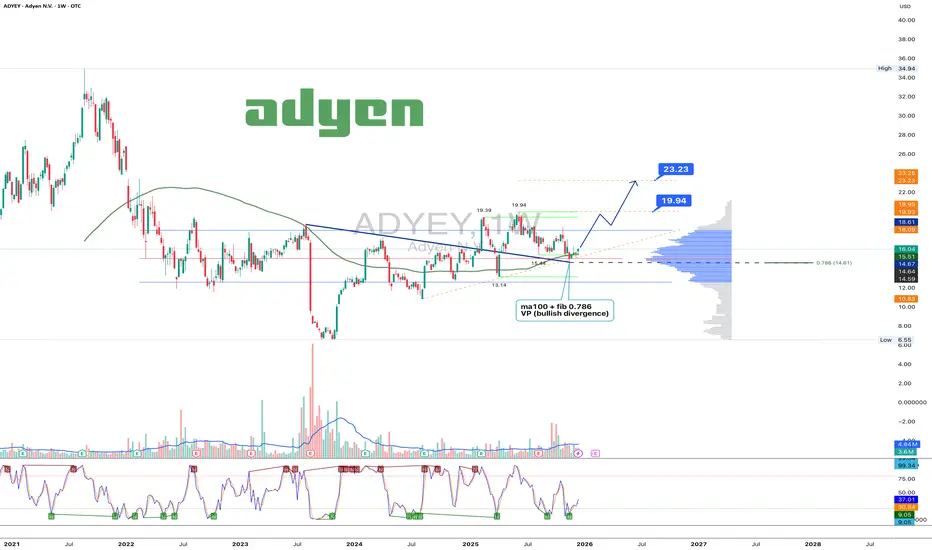
ETH Is Free — But Not Trending YetETH/USD – 1H
Price has broken the descending trendline, signaling selling pressure is weakening.
However, this is a technical rebound, not a confirmed uptrend.
Key Levels
Support: 2,760–2,800 (strong buyer reaction)
Current zone: 2,940–2,960 (decision area)
Resistance: 3,150–3,160 (major supply)
Outlook
Base case: range / shallow pullback, then a retest toward 3,050–3,160.
Bullish continuation only if price closes and holds above 3,160.
Bottom Line
Momentum has improved, but the real move comes after resistance breaks.
Patience beats prediction here.

Bitcoin Is Trapped in a High-Liquidity RangeMarket Structure (H1)
Bitcoin is currently locked inside a clearly defined range, capped by a heavy resistance zone around 90,500 and supported by a well-defended demand area near 85,200. Price action inside this box is choppy and overlapping, with repeated sweeps of both highs and lows — a classic liquidity-building environment rather than a trending phase.
The sharp sell-off from the left side of the chart established a lower structural regime, after which BTC transitioned into sideways rotation. Each bounce toward resistance fails to achieve acceptance, while each dip into support is aggressively defended. This confirms balance, not strength or weakness.
Liquidity & Price Behavior
The green projected swings highlight how price is likely to continue oscillating between resistance and support, hunting liquidity on both sides. This behavior typically precedes a range expansion, but until a clean breakout occurs, moves inside the range remain low-probability and noise-driven.
Macro & U.S. Policy Context
From a macro perspective, Bitcoin remains constrained by unfavorable U.S. conditions:
The Federal Reserve maintains a restrictive policy stance, keeping real yields elevated.
A relatively strong USD continues to pressure risk assets.
Liquidity conditions remain tight, reducing follow-through on upside attempts.
These factors explain why BTC struggles to accept above resistance despite multiple tests — macro headwinds are capping momentum.
Conclusion
Bitcoin is not trending it is accumulating liquidity.
Above 90,500 with acceptance → upside expansion becomes likely.
Failure at resistance → continued rotation and potential downside sweep toward support.
Until price leaves the range with intent, patience is the edge.

This Is a Distribution Trap Below ResistanceBITCOIN (BTCUSD) — H1 MARKET ANALYSIS
1. Market Structure
BTC is still trading within a short-term bearish structure. Despite the recent bounce from the support zone, the market continues to form lower highs under a well-defined resistance band. The recovery leg is corrective, not impulsive a key sign that sellers remain in control.
Price behavior shows:
Strong sell-off → weak rebound
No higher high formed
Structure remains capped below resistance
2. Key Technical Zones
Resistance Zone: 88,800 – 89,600
This is a major supply area aligned with previous breakdown structure and EMA resistance.
Support Zone: 84,800 – 85,400
A critical liquidity pool where buyers previously defended, but still vulnerable to another sweep.
3. Moving Averages & Momentum
EMA 34 (blue): Acting as dynamic resistance during the rebound.
EMA 89 (red): Still trending downward and clearly above price → confirms bearish market bias.
Momentum lacks follow-through; bullish candles are short-lived and overlap heavily.
4. Market Psychology & Liquidity
The current consolidation is distribution, not accumulation:
- Buyers are chasing rebounds after a sharp drop.
- Smart money is selling into strength below resistance.
- The market is building liquidity for a second downside expansion.
This sideways-up movement is designed to:
- Trap late buyers
- Create exit liquidity for sellers
- Prepare for continuation lower
5. Scenario Outlook
🔽 Primary Scenario (High Probability): Bearish Continuation
Price fails at resistance
Sideways consolidation completes
Breakdown toward:
- First target: 85,800
- Main target: 84,500
- Extension: 83,800 – 84,000
🔼 Invalidation Scenario
Only if BTC breaks and holds above 89,600 with strong volume, the bearish structure is invalidated and a deeper recovery becomes possible.
6. Trading Bias
Main Bias: Bearish
Market Phase: Distribution → Liquidity Setup
Strategy: Sell rallies near resistance, avoid long positions inside corrective moves.
Conclusion
BTC is not showing strength it is recycling liquidity below resistance. Until the resistance zone is decisively broken, the path of least resistance remains to the downside. Patience is key; the real move comes after distribution is complete.
