XAU/USD | Gold Testing Key Zones After Hitting Multiple Targets!By analyzing the #Gold chart on the 4 hour timeframe, we can see that price continued its bullish move and successfully reached the targets at $4240, $4250, and $4255, even spiking to $4259 before pulling back. After grabbing liquidity above those levels, gold corrected sharply down to $4192 and is now trading around $4209.
The next supply zones to watch are $4219 to $4244 and $4272 to $4293. Monitor how price reacts to these areas. If gold fails to hold above $4200 within the next 4 hours, we could see a deeper drop toward $4166.
Please support me with your likes and comments to motivate me to share more analysis with you and share your opinion about the possible trend of this chart with me !
Best Regards , Arman Shaban
Technical Analysis

EURNZD POTENTIAL LONGLooking to take long positions to the upside from this current retest of the weekly zone which is inline with the retest of the refined Dail,4h and 1h zones.Use proper risk management should you decide to join me.

WEEKLY WARMAP: DOLLAR MARKETThe week begins with a balanced dollar, firm U.S. yields, and suppressed volatility.
DXY remains inside its 97.672–99.985 range, reflecting equilibrium rather than trend.
No directional signal is valid until structure breaks.
Short-end yields moved ~2.8% higher last week and extended another ~0.76% into Monday’s session.
The 10-year yield advanced ~2.88% last week with further upside today.
The curve is repricing risk while volatility remains suppressed following a ~16.6% decline.
This week’s macro catalysts:
FOMC decision + Powell press conference
JOLTS labor demand data
PPI
Weekly jobless claims
Federal budget and projections
All influence: credibility, yield expectations, liquidity conditions.
Cross-asset behavior remains neutral.
ES stays inside its 6540.25–6953.75 bracket — strong order flow but extended location near the monthly upper boundary and roughly +2 deviations above the mean.
Gold remains inside its 3996.2–4380.7 weekly range.
Key DXY levels:
98.175 — downside liquidity
98.917 — upside structural trigger
Inside this band = non-directional behavior.
Outside = actionable change.
The overall environment reflects structural tension, not directional conviction.
TECHNICAL CONTEXT (CORE5 STRUCTURE)
DXY trades only 0.11% from monthly balance, creating conditions for algorithmic defense at key price boundaries.
The current question:
rotation or continuation?
Price remains inside its daily range (97.672–99.985).
Structure is balanced, but location matters:
DXY sits within the dynamic discount zone on the DGM model
This typically supports accumulation
But there is a bullish volume cap beneath price — an unfinished orderflow pocket resembling a bookkeeping discrepancy
This imbalance often requires a downward corrective spike before any sustained upward movement.
If bearish flow develops:
Liquidity sits cleanly below 98.175 and may be targeted before stabilization.
If bullish flow emerges:
A daily close above 98.917 is required to confirm shift.
Anything below this level is intra-range noise.
Current read:
Structure: balanced
Geometry: supportive zone
Volume: incomplete
Order flow: neutral, awaiting data
Execution: conditional environment, not trend environment
This week’s direction depends on how DXY responds to the incoming data sequence.
WEEKLY TAKEAWAY
Two levels govern the week:
98.175 → downside liquidity
98.917 → upside structural trigger
Inside the band: neutral.
Outside the band: decisive.
— CORE5DAN
Institutional Logic. Modern Technology. Real Freedom.

AUDCHF: Bullish More After Breakout 🇦🇺🇨🇭
AUDCHF broke and closed above a key daily horizontal resistance.
Retesting a broken structure, the price formed a bullish flag pattern.
A breakout of its resistance line is a strong confirmation.
It indicates a highly probable movement up to 0.5656 level.
❤️Please, support my work with like, thank you!❤️
I am part of Trade Nation's Influencer program and receive a monthly fee for using their TradingView charts in my analysis.

CADJPY: Bullish Continuation Ahead 🇨🇦🇯🇵
There is a high probability that CADJPY will continue
rising after a confirmed breakout of a key daily/intraday
horizontal resistance cluster.
Next goal - 112.88
❤️Please, support my work with like, thank you!❤️
I am part of Trade Nation's Influencer program and receive a monthly fee for using their TradingView charts in my analysis.

XAUUSD – The Silent but Dangerous Upside Force!Gold is showing a truly silent climb , with price edging higher as the USD slips to its lowest level in five weeks . With markets almost certain that the Fed will cut rates on December 9–10 , capital is gradually shifting toward safe-haven assets. What is interesting here is that gold is rising quietly, as if the market is waiting for one more confirmation before a stronger move.
On the chart, XAUUSD is trading inside a compression pattern , forming higher lows and repeatedly bouncing from the lower rising trendline. Each time price approaches 4,246–4,250, sellers appear, yet the pullbacks remain shallow, showing that selling pressure is weak and buyers are still in control.
Strategy for now:
– Prefer waiting for a pullback toward 4,205–4,210
– Look for a clear bullish reaction
– Short-term target: 4,240–4,250
As long as gold holds above the rising trendline and does not break below 4,200, this remains a phase of accumulation before a potential breakout , rather than a reversal. Gold may not be rising aggressively, but it is rising with intention – and that is often the most important type of trend to pay attention to.

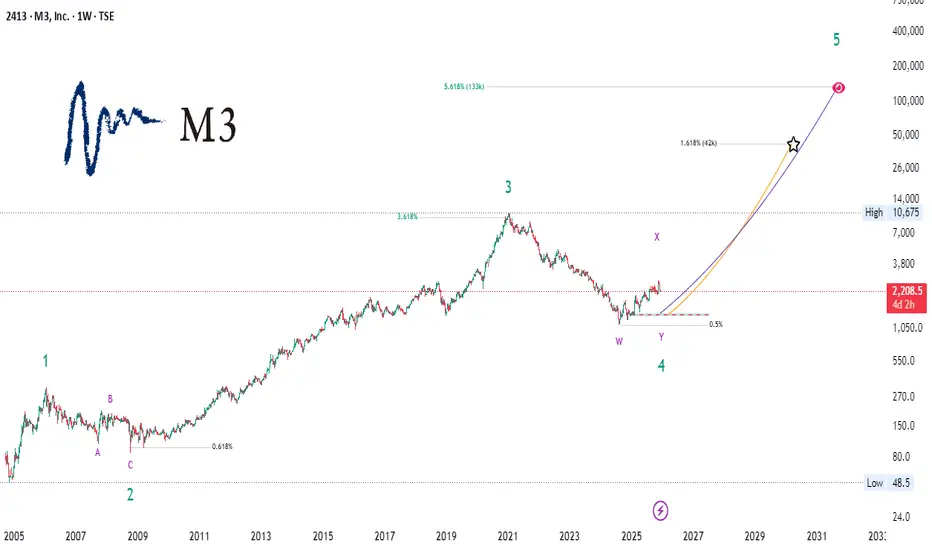
M3 (2413) — Wave 4 Completion and Long-Term StructureM3 (2413) — A Decade-Long Correction May Have Ended | The Architecture of a Potential Supercycle Wave 5
This study examines M3 (TSE:2413) through a deep-time structural lens, highlighting what may be the most technically significant inflection point in the stock’s modern history. By contextualizing the price evolution since 2005 within an Elliott Wave framework, this analysis aims to illuminate the broader architecture that could guide the next multi-year phase.
🔹 Why This Moment Matters
For nearly a decade, M3 has been navigating an extended W–X–Y corrective structure following its major Wave 3 peak. This was no ordinary pause—it was one of the longest and most complex retracements ever recorded in this symbol.
Despite its depth, the correction respected the higher-timeframe trend impeccably:
Termination at the 0.5–0.618 Fibonacci cluster
Structure consistent with a completed higher-degree Wave 4
Price stabilization occurring precisely where long-term cycles often reset
Such convergence across timeframes is rare and often meaningful.
🔹 A Framework for What Comes Next
If Wave 4 has indeed completed, M3 may be entering the foundational phase of Supercycle Wave 5 , historically the most structurally powerful leg in an established growth trend.
This chart outlines two macro trajectories:
Primary Path (Institutional Scenario)
A measured, sustainable advance toward the 1.618 Fibonacci extension , aligning with classical Wave 5 proportion and long-term market symmetry.
Extended Path (Innovation Cycle Scenario)
A more ambitious arc projecting into the 3.618–5.618 zone , reflecting behavior seen in past secular expansion phases—particularly in companies whose growth reaccelerates after prolonged consolidation.
Both paths are illustrated with curvature rather than straight-line projections to better represent the non-linear acceleration patterns commonly observed in late-cycle impulsive structures.
🔹 What the Chart Shows
The completed W–X–Y pattern marking the Wave 4 trough
A multi-year prior impulse (Wave 3) whose Fibonacci relationships remain intact
Historical highs and structural inflection zones for orientation
Two potential long-term trajectories, color-coded for clarity
A convergence of geometry, momentum stabilization, and structural completion—all aligning at the current price region
This confluence forms a compelling technical environment rarely seen on high-timeframe charts.
🔹 Strategic Perspective
This analysis does not make deterministic predictions.
Instead, it provides a macro-structural framework for institutions, portfolio strategists, and long-horizon investors seeking to understand where M3 may be positioned within its secular growth cycle.
Episodes of prolonged corrective unwinding often precede decisive shifts in trend character. If this framework proves correct, M3 may be transitioning from one of its largest consolidations into one of its most expansionary cycles.
🔹 Final Note
This chart is for educational and analytical purposes only.
It does not constitute financial advice.
If you found this useful, feel free to comment with your interpretation of the Wave 4 structure.
GOLD ANALYSIS What’s Moving the Market Today? December 08, 2025FOREXCOM:XAUUSD GOLD ANALYSIS What’s Moving the Market Today? (December 08, 2025)
Welcome back to Trade with DECRYPTERS, where we decode smart-money footprints into clean, actionable buy & sell zones.
Keep it simple. Trust the levels. Follow the plan.
📰 Market Overview
Gold is holding firm above the mid-range after reacting cleanly from discount levels last week. Price is slowly rotating upward, respecting the 4200–4230 structure while approaching premium liquidity pockets. Despite short-term USD fluctuations, the macro trend remains bullish, supported by dovish rate expectations, geopolitical uncertainty, and aggressive central-bank accumulation.
The U.S. Dollar Index stays soft, unable to break key resistance, keeping gold supported. Treasury yields remain elevated but are no longer rising a positive environment for non-yielding assets like gold. With the December 9–10 FOMC meeting ahead, markets are positioning for volatility but remain structurally bullish.
Smart money continues to accumulate dips and distribute premium, maintaining a clean bullish rotation.
🔍 Key Fundamentals Driving Today’s Move
📈 87–90% probability of a December Fed rate cut
→ Lower yield competition boosts gold demand.
💵 USD softening after CPI & ISM weakness
→ Supports upside continuation.
🌍 Geopolitical tensions (US–China + Middle East)
→ Sustains safe-haven flows.
🏦 China adds 11 tonnes of gold in December (13th month of accumulation)
→ Reinforces structural demand.
📊 Bond market volatility cooling
→ Allows gold to stabilise and grind higher.
Gold’s strength continues to be driven by macro uncertainty + dedollarization + institutional accumulation.
📰 Insights From Key Sources
“Market pricing ~88% probability of 25bp cut in December.”
“Fed officials reiterate: easing will be gradual but necessary.”
Highlights renewed talk about US gold revaluation scenarios due to debt levels.
Notes increasing chatter about BRICS gold-backed settlement trials gaining traction.
Reports strong ETF inflows, highest in 18 months.
Notes ongoing US–China tariff tensions boosting safe-haven bids.
Confirms silver outperforming gold YTD, but gold remains the institutional favourite.
Highlights supply shortages and increased miner exploration efforts globally.
These sources show a unified narrative: institutions remain buyers, and macro conditions favour further upside.
📆 KEY EVENTS TO WATCH
🔸 JOLTS Job Openings (Tuesday)
Weak data → Boosts rate-cut expectations → Bullish for gold
Strong data → Temporary push into sell zones → Liquidity grabs likely
🔸 Geopolitical Risk Rotation
🌍 Tensions increase → Spikes toward premium zones
🌤️ Calm environment → Controlled dips into discount levels
Trend remains bullish unless the 4122 structure breaks.
🟩 GOLD TECHNICAL LEVELS
Gold continues to respect its bullish structure, rotating efficiently between Smart Money Sell ➝ Discount Buy Zones.
Price is currently sitting between scalp sell and major SM sell zones.
🟩 📌 SMART MONEY BUY ORDERS: 4138 – 4122
Primary institutional demand with deep discount liquidity.
Expect:
✔ Strong reaction on first tap
✔ Accumulation wicks & mitigation plays
✔ Higher-low formation if trend continues
Break below 4122 opens drawdown toward 4085 → 4050.
🟩 📌 SCALP BUY AREA: 4203 – 4189
Short-term discount region inside the mid-range.
Ideal for:
✔ Intraday continuation longs
✔ Retracement buy setups
✔ Liquidity grab reactions
Lose 4189 → Price rotates back to SM Buy Orders (4138–4122).
🟧 📌 SCALP SELL AREA: 4222 – 4209
Short-term distribution block.
Expect:
✔ Quick reaction shorts
✔ Intraday pullbacks
✔ Stop runs before premium sweep
Failure to hold below 4209 → Expansion toward 4238+.
🔺 📌 SMART MONEY SELL AREA: 4238 – 4248
Major premium sell zone — high probability reversal area.
Contains heavy institutional distribution.
Expect:
✔ Manipulation wicks above prior highs
✔ Liquidity grabs
✔ Swing short setups
Break & hold above 4248 opens pathway toward:
➡ 4264 → 4284 → 4310
📌 Conclusion
Gold remains firmly bullish as long as 4138–4122 holds, with smart money maintaining clear accumulation at discount and distribution at premium. With FOMC approaching, expect engineered volatility before the real move unfolds. As long as macro conditions stay dovish and demand stays strong, the path of least resistance remains to the upside. Stay patient, trust the zones, and execute only where smart money operates.
🙌 Support the Analysis
If this breakdown brought value to your trading:
👍 Drop a like
💬 Comment your levels
📈 Share your charts with the community
Let’s grow together.
Best Regards,
M. MOIZ KHATTAK | Founder — TRADE WITH DECRYPTERS

Euro Leads the Wave – Buyers Take the Advantage!If I had to choose a pair that is currently sailing with the wind , EURUSD would be the standout name. The expectation that the Fed will cut interest rates soon is weakening the USD, while improving eurozone data helps the Euro attract capital. The macro backdrop is clearly favoring the buyers more than the sellers.
Looking at the H4 chart, EURUSD is moving smoothly inside the rising channel . Price stays near the lower boundary of the channel, above the Ichimoku cloud and the 1.1640 support zone. This shows the uptrend is still intact and current pullbacks are mostly technical corrections .
My preferred scenario: wait for price to pull back around 1.1640–1.1650 , where price meets the channel + cloud, then look for bullish confirmation to buy with the trend. The near-term target is 1.1700, the resistance zone above. As long as EURUSD holds above 1.1640, every dip is still a chance to join the uptrend rather than trying to sell against it.

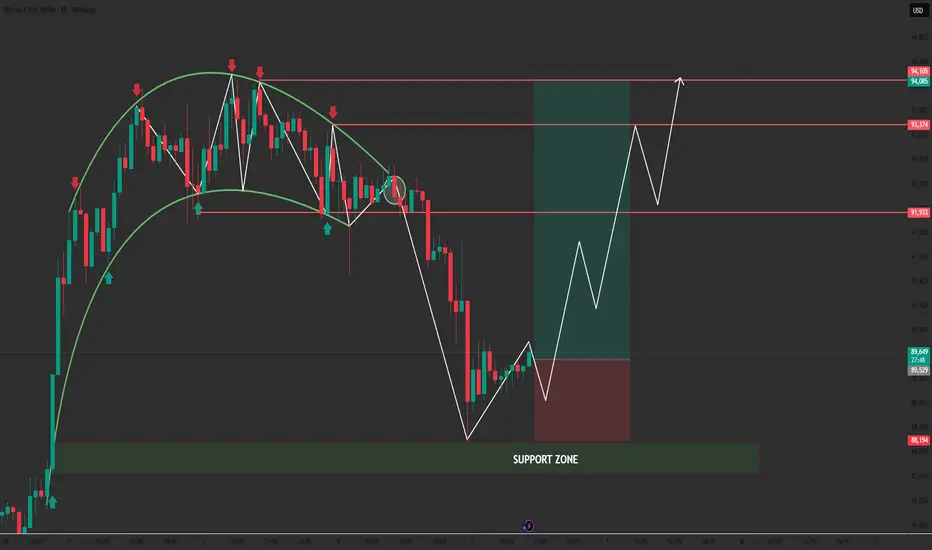
The Drop Is Done — Bitcoin Is Preparing to Bounce🔥 BTC/USD – 1H MARKET OUTLOOK
“BTC Correction Completed – Reversal Structure Forming!”
1. Market Structure Overview
BTC has completed a full rounding-top structure followed by a sharp decline into the Support Zone.
After liquidity was swept below the recent swing low, price has formed a clean bullish reaction with a potential V-shape reversal pattern.
The market is now transitioning:
- From distribution ⟶ accumulation
- From downtrend leg ⟶ early-stage bullish structure
- Higher low formation is developing, validating the first signals of trend reversal.
This matches perfectly with your chart’s projection:
A rebound structure with higher highs & higher lows forming from support.
2. Key Zones
🔴 Resistance Zones
- 91,933 – First major resistance
- 93,374 – Liquidity zone
- 94,085 – 94,105 – Key upside target / breakout zone
- 94,523 – Final projected target
🟢 Support Zone: 88,194 – 88,800
This is the area where price reacted strongly, confirming buyer presence and liquidity sweep.
As long as BTC holds above the Support Zone, the upside scenario remains dominant.
3. Scenarios Ahead
🔹 Primary Bullish Scenario (High Probability)
BTC continues to respect the support area → develops a higher low → pushes upward following your projected path.
Expected steps:
- Small retracement
- Break of minor structure to the upside
- Momentum continuation targeting:
🎯 91,933
🎯 93,374
🎯 94,085 – 94,105
🎯 Final: 94,523
🔸 Alternative Scenario (Low Probability)
Only valid if price breaks & closes below 88,194:
→ BTC could revisit deeper liquidity around 87,000 – 86,500.
Currently, the chart shows no evidence favoring this scenario.
4. Intraday Trading Setups
📌 SETUP 1 – Intraday Buy (Main Setup)
BUY ZONE (Support Reaction):
👉 88,194 – 88,800
Take Profit:
🎯 91,933
🎯 93,374
🎯 94,085 – 94,105
🎯 Extended: 94,523
Stop Loss:
❎ Below 88,194
⚠️ Manage risk properly and avoid over-leverage during volatile swings.
5. Summary & Motivation
BTC is following the roadmap exactly as projected:
✔ Correct breakdown
✔ Correct liquidity sweep
✔ Correct reversal reaction
✔ Correct higher-low formation
✔ Correct bullish outlook from support
This structure shows the market is shifting from weakness to strength—and traders who stay disciplined will capture the next upside wave.
🔥 Keep your mindset sharp — every correction is an opportunity, not a threat. Stay focused, stay confident, and trade the structure, not the emotions.
Gold: Pullback in Place — Ready for the Next Leg Up1. Market Structure
- On the H1 we see a sequence of Higher Lows (HL) and occasional Higher Highs (HH) — structure is overall bullish.
- A short-term Break of Structure (BOS) lower occurred earlier, but price recovered and re-established HLs, showing buyers defending support.
- Current action is a retest/pullback into the marked entry circle where trend support, a micro HL, and previous reaction converge — classic break→retest environment for continuation.
2) Key Levels
- Entry / Decision Zone (circled): ~4,195 – 4,200 (area of trend confluence).
- Immediate Support (stop area): 4,181 (invalidation if weekly/4H candles close below).
- Major Support below: 4,163 (deeper invalidation / structural change).
- First Target / Minor Resistance: 4,225 (mid-term take-profit).
- Extended Target / Higher Liquidity: 4,266+ (larger swing target).
3) Scenarios
Main (High-probability) — Bullish Continuation
- Condition: price holds the entry circle and the HL structure remains intact.
- Plan: look for bullish confirmation (tight range breakout / bullish engulf / clean H1 close) in the entry zone.
- Targets: TP1 4,225 → TP2 4,266+.
SL: below 4,181 (protect capital if structure fails).
Alternative (Low-probability) — Deeper Correction / Bearish
- Trigger: decisive 4H/1H close below 4,181 and then below 4,163.
- Outcome: structure flips to lower lows → expect drop toward lower support zones and stop hunting.
- Action: avoid new longs; wait for re-accumulation.
4) Summary
- Gold is showing a textbook pullback into structural support — this is where trend-followers prepare, not panic. If price respects the circled entry and gives a clean bullish confirmation, the path to 4,225 → 4,266+ is the high-probability play.
Remain disciplined: protect capital at 4,181 and only add when price confirms the turn.
Trade the structure, not the noise — discipline turns good analysis into real profit.

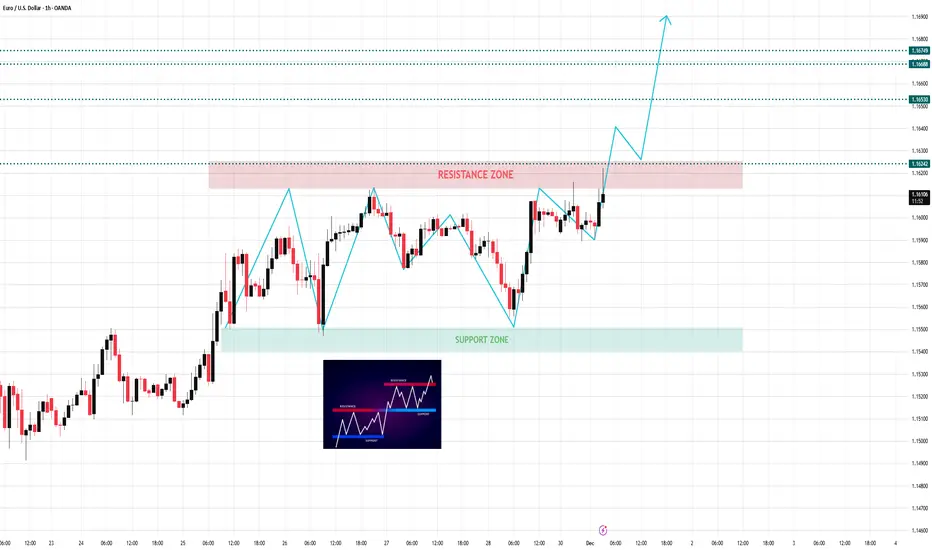
EURUSD Is Coiling for a Breakout — The Next Push Could Be ExploZ1. Market Analysis
EURUSD is currently trading in a clean and well-defined structure, showing a gradual shift from consolidation to bullish momentum. Price has been oscillating between the Support Zone (1.1540–1.1550) and the Resistance Zone (1.1618–1.1624) , forming a sequence of Higher Highs and Higher Lows — a textbook bullish staircase pattern.
The support zone has acted as a strong demand region, rejecting price multiple times and building a foundation for continuation. Each test of resistance is becoming stronger, and the most recent bullish impulse shows increased momentum compared to previous swings. This indicates that buyers are gaining confidence as liquidity builds above the resistance line.
The current price action is also forming a Bullish Continuation Pattern, identical to the reference image at the center of your chart. This suggests accumulation below resistance before a potential breakout.
As long as EURUSD stays above the bullish micro-structure, sentiment continues to favor the upside.
2. Technical Structure Breakdown
Key Observations:
- Support Zone at 1.1540–1.1550 continues to hold strongly
- Multiple successful retests indicate strong buyer presence
- A clean Resistance Zone at 1.1618–1.1624 is the final barrier before expansion
- Market structure is forming a staircase pattern → consistent HH + HL
- The recent bullish leg has more momentum than previous ones
This is a classic bullish breakout setup, supported by structure and liquidity alignment.
3. Market Scenario & Strategy
🔸 Main Scenario – Bullish Breakout (High Probability)
Price is currently testing the resistance zone with strong bullish structure behind it.
If price closes above 1.1624, expect continuation toward:
🎯 Target 1: 1.16530
🎯 Target 2: 1.16688
🎯 Target 3: 1.16749+ (extended liquidity zone)
A clean breakout → retest → continuation pattern is the expected sequence.
Strategy:
Look for long entries on:
✔ Break + retest of 1.1624
✔ Or pullback into minor higher low structure
Momentum is on the buyer’s side.
🔹 Sub Scenario – Correction Before Breakout
If price gets temporarily rejected at the resistance zone:
- Expect a pullback toward 1.1580–1.1600
- This would allow buyers to reload before pushing higher
Structure remains bullish as long as price stays above 1.1550.
Invalidation of Bullish Bias :
❌ 4H close below 1.1550 → structure weakens
New targets would shift to 1.1500 and lower.
Probability of this scenario remains lower for now.
4. Summary & Personal View
- Overall Trend: Bullish
- Current Momentum: Strong and accelerating
- Best Buy Zone: On breakout 1.1624 or minor pullback before breakout
- Main Targets: 1.1653 → 1.16688 → 1.16749
- Bias Remains Bullish as long as price holds above 1.1550
EURUSD is preparing for a breakout — this is one of the cleanest continuation structures of the week.
Stop Buying Breakouts. Start Buying What Smart Money Buys....📈 NZD/USD — 1H TECHNICAL OUTLOOK
Price action on NZD/USD is developing exactly as a clean bullish structure: higher highs, higher lows, and a controlled ascending channel. The market is respecting both the trendline and the support zone, giving us a high-probability continuation setup.
1️⃣ Market Structure Remains Bullish
NZD/USD continues to build a clear ascending structure, with every corrective swing respecting the red resistance trendline. After multiple taps (circled areas), the market has finally broken above the structure, signaling bullish strength.
- Support is holding firml
- Each dip is bought aggressively
- Lower volatility pullbacks show accumulation, not distribution
This is exactly what you want in a trend continuation trade.
2️⃣ Entry Zone
Entry Zone aligns perfectly at the trendline retest, combining:
- Break of structure
- Pullback into former resistance (now support)
- Confluence with minor rising trendline
This is a textbook “break–retest–continuation” pattern.
Aggressive traders enter immediately at retest.
Conservative traders wait for a confirmation candle above the trendline.
Both approaches are valid with strong R:R.
3️⃣ Stop-Loss Zone (Smart Money Placement)
The SL Zone sits below:
- Trendline support
- Last higher low
- Retest rejection zone
If price breaks below this level, the bullish structure is invalid so the SL placement is perfect.
4️⃣ Take-Profit Zone
TP Zone is strategically placed at the next liquidity cluster and previous rejection area.
If structure holds, price is likely to sweep these highs.
This gives the setup a clean 2–3R potential.
➡️ Primary Scenario
Price pulls back into the Entry Zone, forms a higher low, then continues pushing upward into the TP Zone.
This is the highest-probability path given current momentum.
⚠️ Alternative Scenario
A break below the SL Zone would signal weakness and may drive price back toward the broader SUPPORT block. Until then, buyers remain in control.

$SPY & $SPX Scenarios — Week of Dec 8 to Dec 12, 2025🔮 AMEX:SPY & SP:SPX Scenarios — Week of Dec 8 to Dec 12, 2025 🔮
🌍 Market-Moving Headlines
🏦 FOMC week: Wednesday’s rate decision and Powell press conference are the dominant catalysts. Markets will focus on wording around inflation progress, growth risks, and timing of future cuts.
🧾 Shutdown-delayed data continues: Job openings, Employment Cost Index, and several September reports are still rolling in late, creating uneven visibility for traders.
📉 Labor and inflation signals midweek: ECI, jobless claims, and trade balance provide additional color on wage pressures and global demand.
🧺 Quiet Monday — then the calendar heats up fast.
📊 Key Data & Events (ET)
MONDAY, DEC 8
• None scheduled
TUESDAY, DEC 9
⏰ 6 00 AM
• NFIB Small Business Optimism (Nov): 98.3
⏰ 10 00 AM
• Job Openings (Oct, delayed): 7.2 million
Note: From the shutdown backlog
WEDNESDAY, DEC 10 — FOMC DAY
⏰ 8 30 AM
• Employment Cost Index, ECI (Q3, delayed): 0.9 percent
⏰ 2 00 PM
• FOMC Interest Rate Decision
• Monthly United States Federal Budget (Nov): –139.6 billion
⏰ 2 30 PM
• Fed Chair Powell Press Conference
THURSDAY, DEC 11
⏰ 8 30 AM
• Initial Jobless Claims (Dec 6): 220,000
• United States Trade Deficit (Sept): –61.6 billion
FRIDAY, DEC 12
⏰ 10 00 AM
• Wholesale Inventories (Sept): Not released for this cycle
Note: September report was canceled; August was the last available
⚠️ Disclaimer: For educational and informational use only — not financial advice.
📌 #SPY #SPX #trading #macro #FOMC #Powell #inflation #labor #economy #markets #investing

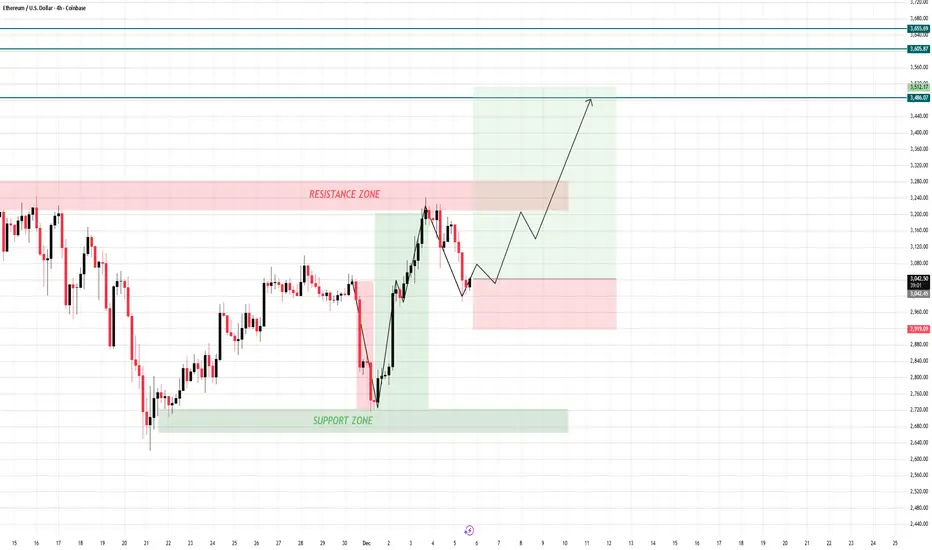
The Trap Is Set — Ethereum Preparing for Liftoff🚀 ETHEREUM 4H OUTLOOK – ACCUMULATION BEFORE BULLISH EXPANSION
1. Market Structure Overview
- ETH is currently respecting the broader bullish structure after rejecting from the upper Resistance Zone (≈ 3,180–3,220) and pulling back into the mid-range.
- The recent drop is not a reversal; it is a healthy retracement into demand after an impulsive rally.
- Price is now stabilizing above the Support Zone (≈ 2,940–2,970) — the key area that previously launched a strong bullish leg.
✔ The trend remains bullish on higher timeframes
✔ Current structure shows a corrective pullback into liquidity
✔ Bullish orderflow still intact as long as support holds
2. Scenarios Ahead
🔹 Main Scenario (High Probability) – Bullish Continuation
If price holds above the support area and continues forming higher lows:
→ ETH is expected to bounce and build structure toward the upside.
Upside Targets:
🎯 3,460
🎯 3,605
🎯 3,655 (major liquidity + extended target)
The drawn projection on your chart (higher low → stair-step structure → rally) is perfectly aligned with bullish continuation.
🔹 Sub Scenario (Low Probability)
If ETH breaks below 2,940, structure shifts short-term bearish:
→ Deeper pullback into 2,850 – 2,880
→ Only triggered if a clean break + close below support happens.
Currently, there is no confirmation for this scenario.
3. Summary – Structure & Liquidity Alignment
ETH continues to follow a textbook bullish model:
✔ Corrective pullback into demand
✔ Accumulation above support
✔ Clean rejection from supply, but no trend reversal
✔ Bullish projection remains valid toward liquidity clusters above
The move is simply compression → accumulation → expansion.
4. Intraday Trading Setups (Based on Chart Structure)
📌 SETUP 1 – Intraday Buy Setup (Preferred Scenario)
ETH BUY ZONE:
👉 2,940 – 2,970
Take Profit:
🎯 3,120 – 3,180 (short-term)
🎯 3,460 – 3,605 (swing)
Stop Loss:
❎ 2,915
⚠ Manage risk properly — crypto volatility is high.
📌 SETUP 2 – Intraday Sell Setup (Only for Countertrend Traders)
ETH SELL ZONE (Resistance):
👉 3,180 – 3,220
Take Profit:
🎯 3,050 – 3,000
Stop Loss:
❎ 3,245
⚠ Countertrend trades should use smaller sizing.
Stay patient. The market always rewards those who wait for price to come to their zone — not those who chase it
Gold Is Getting Ready — Don’t Miss the Move📌 Gold Market Analysis (XAUUSD – 4H)
Sideway Accumulation Before the Next Impulsive Move**
1. Market Structure Overview
- Gold has been moving exactly according to the scenario we anticipated. After completing Wave (3) to the upside, price has transitioned into a sideways accumulation phase right inside the 4147–4150 Swing Zone the key structural level that has acted as the foundation of the entire bullish cycle.
This sideways movement is not weakness it is compression, preparing the market for the next bullish expansion.
✔ Elliott Wave Structure Remains Intact
- Price is developing Wave (4) as a corrective phase, perfectly matching our projected model.
No signals of trend reversal — only healthy consolidation.
✔ Trend Confirmation From MA89 & MA200
- Price continues to hold above both MA89 and MA200, proving the long-term bullish trend is still solid.
- The 4147–4150 zone continues to act exactly as expected: firm, clean, and technically respected.
✔ Sideways Action = Liquidity Build-Up Before News
- The last two days of sideways movement show the market is waiting for ADP & Non-Farm.
This is typical institutional behavior:
Accumulation → Compression → Breakout (with news catalyst).
2. Next Scenarios
🔹 Main Scenario (High Probability)
As long as price holds above 4147 – 4150, gold is preparing for a bullish continuation:
- Expect volatility during ADP & NFP
- If the zone holds → strong bullish bounce
Targets:
🎯 4235 – 4250
🎯 4365 – 4370 (Liquidity Zone – completion of the next wave)
🔹 Alternative Scenario (Low Probability )
Only if price breaks and closes below 4147 on the 4H timeframe:
→ Gold may correct deeper toward MA200 (4060–4080).
Currently, no signs indicate this will happen.
3. Summary – Market Behavior is 100% Following the Plan
Gold has followed our projection with perfect accuracy:
✔ Correct correction zone
✔ Correct sideways accumulation
✔ Correct waiting phase
✔ Correct structural behavior before a breakout
This confirms that market structure + Elliott Wave + liquidity mapping is giving extremely high precision.
Stay patient the next move will be worth it.
The market is preparing for the breakout.
4. Intraday Trading Setups (Based on the Current Structure)
📌 SETUP 1 – Intraday Sell Opportunity (Correction Timing)
XAUUSD SELL ZONE:
👉 4265 – 4268
Take Profit:
🎯 4262 – 4257
Stop Loss:
❎ 4272
⚠️ Ensure proper risk management.
📌 SETUP 2 – Intraday Buy Opportunity (Swing Zone Rejection)
XAUUSD BUY ZONE:
👉 4147 – 4150
Take Profit:
🎯 4153 – 4158
Stop Loss:
❎ 4143
⚠️ Always manage capital to protect account safety.
Stay disciplined, stay patient — the market always rewards those who trust the structure, not the emotions. Every sideways phase is just the calm before your next profitable wave.

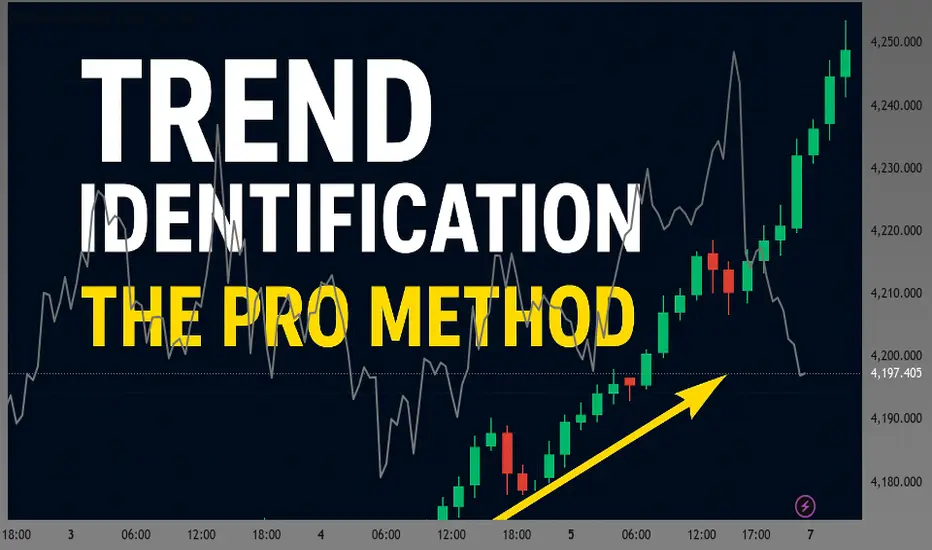
How to Identify the Trend Like a ProThe Foundation of Every Winning Trading Strategy
Identifying the trend is the most important skill a trader can develop. Almost every successful strategy — breakouts, pullbacks, SMC, swing trading, scalping — depends on knowing whether the market is trending or ranging. In this educational idea, you’ll learn how professionals detect the trend using clean, simple price-action rules that work on every timeframe and every market.
---
🔹 Why Trend Identification Matters
Most losing trades happen because traders enter against the trend.
A strong bullish or bearish trend makes:
- Breakouts more reliable
- Pullbacks cleaner
- Targets larger
- Reversals less frequent
When you follow the trend, your trades have a natural advantage.
---
🔹 Step 1: Understand Market Structure (HH, HL, LH, LL)
The trend is defined by swing structure, not indicators.
Bullish Trend Structure
- Higher High (HH)
- Higher Low (HL)
- New Higher High (HH)
This shows buyers are in control.
Bearish Trend Structure
- Lower Low (LL)
- Lower High (LH)
- New Lower Low (LL)
This shows sellers dominate.
If structure is unclear, the market is likely ranging, not trending.
---
🔹 Step 2: Use the “Three-Push Rule”
A simple rule:
If you see three consecutive HH + HL, the trend is confirmed bullish.
If you see three consecutive LL + LH, the trend is confirmed bearish.
This rule filters out fake short-term moves.
---
🔹 Step 3: Identify Trend Strength Using Candle Behavior
Trend strength shows in the candles:
Strong Bullish Trend Candles
- Large green bodies
- Small or no lower wicks
- Fast recovery after pullbacks
Strong Bearish Trend Candles
- Large red bodies
- Small or no upper wicks
- Sharp drops after minor retracements
Candle behavior tells you confidence and momentum.
---
🔹 Step 4: Check Pullbacks for Confirmation
Pullbacks are the heart of trend trading.
Bullish Pullback Confirmation
- Slow downward correction
- Decreasing candle size
- Tap into demand or previous structure
- Powerful bullish continuation candle
Bearish Pullback Confirmation
- Slow upward correction
- Weak bullish candles
- Tap into supply zone
- Strong bearish continuation candle
The nature of pullbacks reveals trend quality.
---
🔹 Step 5: Use Dynamic Support & Resistance (Trendlines)
Trendlines help visualize the trend direction:
- Uptrend → connect lows
- Downtrend → connect highs
If price respects the trendline multiple times, the trend is strong.
But remember:
Trendlines support your analysis, they don’t replace market structure.
---
🔹 Step 6: Multi-Timeframe Trend Alignment (MTF)
Professional traders follow the higher timeframe trend.
Example for Gold (XAUUSD):
- Daily trend: Bullish
- 4H trend: Bullish
- 1H trend: Bullish
Now you take only buys on 15m or 5m.
This increases accuracy dramatically.
If higher timeframes disagree, expect:
- Choppiness
- Ranges
- Unknown direction
MTF alignment = cleaner trades.
---
🔹 Step 7: Spot Trend Reversals Early
Reversals happen after clear signals:
Bullish → Bearish Reversal
- Failure to create new HH
- Break of previous HL (structure break)
- Formation of LH
- Shift of order flow
Bearish → Bullish Reversal
- Failure to create new LL
- Break of previous LH
- Formation of HL
- Bullish BOS (Break of Structure)
Structure tells you when the trend has officially changed.
---
🔥 Final Professional Tip
Do not fight the trend.
A trend can stay strong longer than traders expect.
Use:
- Structure
- Pullbacks
- Trendlines
- Multi-timeframe alignment
- Momentum candles
Combine these methods and you’ll identify trends with clarity and confidence — just like professional traders.
Your boosts, comments, and likes motivate me to share more accurate analyses like this.
👉 If you found this helpful, please Boost the idea and leave a comment — it really helps!
— JT_CHARTsMaster
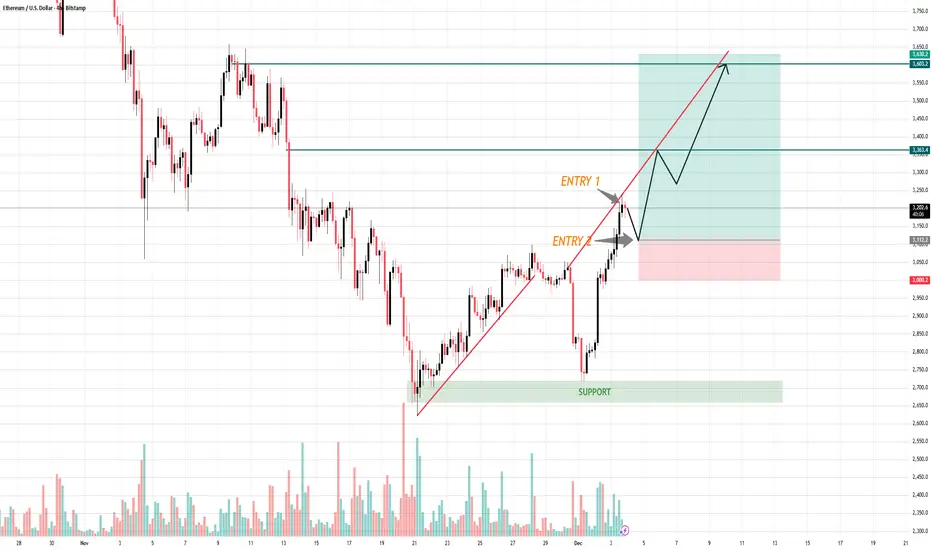
Traders Chase Breakouts. The Profitable Ones Wait for the Retest📈 ETH/USD — 4H MARKET OUTLOOK
- ETH has broken out of its short-term rising structure and is now pulling back into a high-probability retest zone, creating a clean bullish continuation setup. Market structure has shifted from bearish to bullish with higher highs, higher lows, and strong volume support.
- Your chart shows two potential long entries both valid depending on the aggressiveness of the trader.
1️⃣ Break of Structure + Trendline Retest
ETH successfully broke above the rising trendline and is now forming a corrective pullback.
This is exactly what we want to see before entering a continuation move.
- Impulse up = strong, clean candles
- Pullback = controlled, low volatility
- Trendline retest = confirmation of demand
This is textbook bullish market behavior.
2️⃣ Entry Zones
🔶 ENTRY 1 (Aggressive Entry)
- Positioned right at the trendline retest
- For traders who want early entry with more risk
- Expect volatility but strong R:R if the bounce holds
🔷 ENTRY 2
- Wait for price to retrace deeper into minor structure support
- Higher confirmation, lower risk
- Ideal for swing traders
Both entries target the same bullish continuation structure.
3️⃣ Target Zone
Your take-profit zone is correctly placed at $3,600–$3,650, aligned with:
- Previous major supply zone
- Strong historical rejection area
- Completion of the next liquidity sweep
If ETH maintains structure, this zone will be tested.
4️⃣ Stop-Loss Placement
A stop below $3,060 – $3,100 is ideal because:
- It sits under the retest zone
- Below previous higher low
- Below liquidity pockets that market makers typically manipulate
If this level breaks, bullish structure collapses so the SL is perfect.
➡️ Primary Scenario
ETH pulls back → creates a higher low → bounces from Entry 1 or Entry 2 → continuation into $3,600+.
Market structure is bullish and favors long setups.
⚠️ Risk Scenario
If price breaks and closes below $3,060, the bullish setup fails and ETH may revisit the major support zone near $2,750 – $2,800.
Your edge isn’t in predicting the market — it’s in being patient enough to wait for the setup that others ignore.
EURUSD: Support & Resistance Analysis for Next Week 🇪🇺🇺🇸
Here is my latest support and resistance analysis
for EURUSD for next week.
Consider these structure for pullback/breakout trading.
❤️Please, support my work with like, thank you!❤️
I am part of Trade Nation's Influencer program and receive a monthly fee for using their TradingView charts in my analysis.

Ethereum Range Analysis – First Breakout Will Be Fake Confirmed📌 Chart Overview
This ETH/USDT 30-minute chart shows a consolidation phase after a strong drop. Price is moving inside a clear sideways range, building liquidity on both sides. The idea on the chart focuses on waiting for a fake breakout (liquidity sweep) before the true move begins.
📍 Market Structure
Price is trapped between a defined upper resistance and lower support. Multiple touches on both sides show that buyers and sellers are accumulating orders. This creates equal highs and equal lows, which is where liquidity naturally forms.
The chart highlights that the market is not ready for a clean breakout yet. Instead, it is preparing to trap traders on one side.
📍 Upper Liquidity Zone
The resistance line above the range is a major level. Price has rejected it many times, which means:
breakout traders will try to buy above it
stop-losses of short positions are sitting there
smart-money will aim to grab liquidity above it
A breakout above this level is expected to be fake first, meaning price may spike above but quickly reverse downward.
📍 Lower Liquidity Zone
The support line under the range is equally important. Several wick rejections show buyers defending this level, which means:
long stop-losses are below
sell-side liquidity is growing
institutions may “run the lows” before pushing up
A drop below this support is also expected to be fake, followed by a reversal upward.
📍 Fake Move Logic
The chart’s message “Need Any Side First Move Fake” means:
Do not trust the first breakout
The market will likely sweep liquidity on one side
The real direction usually comes opposite to the first breakout
This is a classic Smart Money / Liquidity Grab pattern.
📍 Scenario: Fake Break Up → Real Drop
If price breaks above resistance:
breakout buyers enter
liquidity is taken
price rejects the top
strong downward move begins
This is a buy-side liquidity sweep leading to a bearish move.
📍 Scenario: Fake Break Down → Real Pump
If price breaks below support:
longs get liquidated
liquidity collected
price reverses and pushes upward
This is a sell-side liquidity sweep leading to a bullish move.

XRPUSDT Analysis : Bullish Channel Continuation After Liquidity 🐻 Bearish Channel Confirmation
The most prominent feature is the downward channel (the green shaded area) that has been containing the price action since the major high in July/August.
The Trend: The market has been making lower highs and lower lows, confirming a strong downtrend.
Channel Respect: The price bars (candles) consistently bounce off the channel's upper and lower boundaries, indicating that traders are respecting this structure.
Continuation: The note "Market is in Channel" and "From Here I Analyzed It Still Running" confirms the analyst's belief that the downtrend is likely to continue in the near term, keeping the price contained within the green parallel lines.
💧 The Liquidity Magnet
A key part of the current analysis is the expectation of the price reaching a specific low point, often referred to as a liquidity zone or demand zone.
Target: The chart specifically marks a horizontal line around the $1.20 - $1.00 area with the note: "This liquidity will filled."
Analyst’s Logic: In technical analysis, large market orders often sit below prior significant lows (a 'liquidity pool'). The analyst anticipates that the final phase of this downtrend will be a sharp move down (liquidity grab) to trigger these sell orders and fill the demand from institutions or "smart money."
🚀 The Projected Reversal: Heading into 2026
The analysis outlines a distinct two-stage prediction for the future price action: a final drop followed by a massive surge.
Stage 1 (Final Drop): The projected path shows the price breaking out of the channel to the downside and plunging towards the marked liquidity zone (around $1.00-$1.20) in late December or early 2026. This completes the bearish structure.
Stage 2 (The Bounce): Immediately after filling the liquidity, the chart projects a sharp reversal and an aggressive move upward, forming a large V-shaped recovery. The arrow indicates a significant potential rally, suggesting the start of a new, long-term bullish trend that could break the previous highs.
💡 Content Points for the Minds Section
For a more detailed explanation on Minds, you can expand on the following concepts:
Downtrend Structure: Explain that the bearish channel defines the current macro-trend. Until the price breaks convincingly above the channel's upper boundary, the overall direction remains down.
Why Liquidity is Key: Discuss the concept of "selling to the buyers." A deep wick or move to the $1.00-$1.20 area is necessary to clear out weak hands, trigger stop losses, and allow large players to accumulate at a discount before the rally begins.
The Timeframe: Stress that this is a long-term (1D chart) analysis. The expected moves will take weeks or months to fully materialize, especially the final bullish push into 2026.
Confirmation Signals: What would invalidate the analysis? If the price breaks above the top of the channel before hitting the liquidity zone, the bearish move would be cancelled. What confirms it? A sharp spike down to the $1.00 area followed by an immediate, strong candle close back up.

DOGEUSDT Analysis: Bearish Continuation with Potential ReversalDOGEUSDT 30-Minute Chart Analysis: Bearish Continuation with Potential Reversal Signals
DOGE/USDT pair on Binance in a 30-minute timeframe. It captures price action from December 6 to a projected view into December 9, focusing on recent volatility in Dogecoin (DOGE) against Tether (USDT). At the time of the snapshot, the price is quoted at 0.13936 USDT, down 0.0012 (or -0.9%) from the previous close, with a trading volume of 1.98 million units. The chart uses standard candlestick representation (red for bearish candles, green for bullish), overlaid with trendlines, support/resistance zones, and custom annotations to highlight potential trading setups.
The overall theme appears to be a bearish downtrend with signs of exhaustion, possibly setting up for a "fakeout" move followed by a reversal. I'll break this down in detail below, structured like a TradingView Idea post for clarity, including key sections for analysis, trade ideas, and insights.
Chart Overview
The chart spans multiple days (December 6 to 9), with the x-axis labeled in 6-hour intervals starting from 06:00 on December 6. The y-axis shows price levels in USDT, ranging from approximately 0.13650 at the bottom to 0.14250 at the top, with key levels marked like 0.13936 (ask price in red) and 0.13900 (bid in gray).
Candlestick Pattern: The left side shows a sharp downward impulse with a large red candle, indicating strong selling pressure, likely from a breakdown below a previous support. This is followed by a period of consolidation with smaller, choppy candles (mix of red and green), suggesting indecision. Toward the center-right, there's another cluster of red candles, pushing prices lower, but with diminishing volume implied by smaller wicks.
Trendline: A prominent descending trendline (sloping downward from left to right) connects multiple high points, acting as dynamic resistance. This line starts from the initial high around 0.14200 and trends lower, touching subsequent peaks.
Annotations and Zones:
"Retesting" Zone: A horizontal green box labeled "Retesting" is placed near the trendline around 0.14100–0.14200. This suggests the price is retesting the underside of the broken trendline or a former support level, a common setup in technical analysis where old support becomes new resistance.
"First Move Fake Then Reversal" Label: Positioned at the bottom left near a low point around 0.13800, this indicates a potential "fakeout" – a brief move in one direction (likely downward) to trap traders, followed by a reversal (potentially upward). A purple lightning bolt icon below emphasizes a high-impact event or turning point.
"PER NEED" Zone: A lower green box labeled "PER NEED" (possibly a typo or abbreviation for "Perfect Need" or "Per Need" in a trading context, like "perceived need" for liquidity) is drawn around 0.13750–0.13850. This could highlight a demand zone where buyers might step in, or a level of "need" for price to fill orders before reversing.
Projection Lines: Diagonal lines extend rightward from current price action into December 8–9, suggesting forecasted paths. One line points upward from a low, implying a bullish reversal, while the trendline continues downward.
The chart's title, "#DOGEUSDT 30 Mints Analysis" (likely "30 Mins" for minutes), hints at a short-term scalping or intraday focus, common for crypto pairs like DOGE/USDT, which are known for high volatility driven by social media hype, meme trends, and market sentiment.
Technical Analysis Breakdown
Diving deeper into the indicators and patterns:
Downtrend Confirmation: The series of lower highs and lower lows aligns with the descending trendline, confirming a bearish channel. The initial large red candle on December 6 (around 18:00) represents a breakdown, possibly triggered by broader market news or DOGE-specific events (e.g., Elon Musk tweets or crypto market dumps). Volume (1.98M) supports this, though not explicitly charted – higher volume on down moves strengthens the bearish bias.
Support and Resistance Levels:
Resistance: The trendline at ~0.14050–0.14150, where "Retesting" is occurring. A break above could invalidate the downtrend.
Support: Bottom levels around 0.13800 (near "First Move Fake Then Reversal") and 0.13700 ("PER NEED"). These are potential bounce zones, perhaps Fibonacci retracements or psychological round numbers.
Key Prices Marked: Ask at 0.13936 (red) and bid at 0.13900 (gray), showing tight spreads typical in liquid Binance pairs.
Potential Patterns:
Descending Wedge or Channel: The narrowing price action toward the right suggests a wedge formation, often bullish if it breaks upward. The "Retesting" label implies price is probing the upper boundary before a possible squeeze.
Fakeout Setup: The "First Move Fake Then Reversal" annotation points to a classic liquidity grab – price dips below support to stop out longs, then reverses. This is common in crypto, where whales manipulate thin order books.
Reversal Indicators: The small green candles at lows and the upward-projecting line suggest bullish divergence (if RSI were shown, it might confirm). The lightning bolt could symbolize a "shock" event like news catalyzing the reversal.
Timeframe Context: On a 30-min chart, this captures intraday swings, but aligns with DOGE's broader 2025 trends – assuming continued meme coin volatility amid potential regulatory news or adoption (e.g., Dogecoin payments on X platform).
Trade Idea: Bearish Continuation vs. Bullish Reversal
Based on the chart's annotations, here's a balanced trade setup:
Bearish Scenario (Continuation): If price fails the "Retesting" and breaks below 0.13800, target lower supports at 0.13650. Entry: Short below 0.13900. Stop Loss: Above trendline at 0.14100. Take Profit: 0.13700 or lower. Risk-Reward: 1:2. This plays the downtrend's momentum, with the fake move being a trap for bulls.
Bullish Scenario (Reversal): If the "First Move Fake Then Reversal" plays out, buy on a bounce from "PER NEED" zone (0.13750). Entry: Long above 0.13950. Stop Loss: Below 0.13700. Take Profit: Retest high at 0.14200 or higher. This anticipates the fakeout exhausting sellers, leading to a short squeeze.
Risk Management: Use 1-2% account risk per trade. Monitor volume for confirmation – fading volume on downs could signal reversal. Consider external factors like BTC correlation (DOGE often follows Bitcoin) or social sentiment on X.
Key Insights and Mindsets for Traders
To wrap up with practical "minds" (mindsets or key takeaways), inspired by TradingView community wisdom:
Mindset 1: Patience in Trends: Don't fight the descending trendline – wait for confirmation. As the chart shows, retests often precede big moves.
Mindset 2: Beware Fakeouts: The "First Move Fake" label reminds us crypto loves traps. Always use multiple timeframes (e.g., check 1H or 4H for alignment) to avoid getting shaken out.
Mindset 3: Zone Trading Over Exact Levels: Focus on boxes like "PER NEED" rather than pinpoint prices. These represent liquidity pools where smart money accumulates.
Mindset 4: Projection Caution: The forward lines into Dec 8-9 are speculative – use them as guides, not guarantees. Combine with fundamentals like DOGE's community-driven pumps.
This analysis assumes standard technical principles; always DYOR (Do Your Own Research) and consider market conditions on December 7, 2025. If you're posting this as a TradingView Idea, use hashtags like #DOGE #Crypto #TechnicalAnalysis for visibility!

USDJPY 30m – Rejection Zone Formed, Bearish Reaction Expected📌 USDJPY 30 Mins Detailed Analysis
1️⃣ Market Structure Overview
On the USDJPY 30-minute timeframe, the price has pushed into a major supply zone, highlighted in green. This area represents a strong historical reaction zone where sellers previously stepped in aggressively.
The recent bullish move attempted to break above this zone but failed, showing exhaustion.
2️⃣ Volume Burst – Strong Clue of Seller Activity
Inside the green zone, we can clearly see a Volume Burst label.
This indicates:
Sudden increase in volatility
Aggressive orders hitting the market
Smart money activity (institutional selling pressure)
Volume spikes in a supply zone typically signal the beginning of a potential reversal.
3️⃣ Retesting Confirmed (Weak Buyers)
The blue line inside the zone shows a retesting area.
Price tapped this level again, forming:
Small-bodied candles
Wick rejections
Slow upward momentum
This behaviour suggests buyers are losing strength, while sellers are preparing to dominate.
4️⃣ Pattern Must Zone – Key Reversal Trigger
The “Pattern Must” label indicates the exact point where structure must break to confirm a bearish move.
If price:
Fails to close above this area
Shows rejection wicks
Forms a bearish engulfing
➡️ A downward continuation becomes highly probable.
5️⃣ Expected Move (Bearish Projection)
The arrow drawn on your chart suggests the next likely scenario:
Price retests the supply zone
Bears regain control
Market starts pushing downward toward lower demand zones
This aligns with the weak retest and heavy selling momentum detected earlier.
6️⃣ Trade Idea (For Educational Purposes Only)
Bias: Bearish
Reason:
✔ Major Supply Zone
✔ Volume Burst
✔ Failed bullish continuation
✔ Retest rejection
Confirmation:
Wait for bearish candle patterns or break of minor structure.
📌 Conclusion
USDJPY is showing strong signs of a potential short reversal from a high-volume supply zone. The market lost bullish strength after retesting the zone, hinting a bearish continuation move on the 30-minute chart.
This is a high-probability setup for traders following:
Smart Money Concepts
Supply & Demand
Volume-Based Reversals
Intraday Trend Setups
