USD/CAD Nears Support at 1.3720The USD/CAD chart shows price action consolidating between a well-defined support zone near 1.3200 and resistance around 1.4000. Currently, the 50-day MA is below the 200-day MA, suggesting a lingering bearish bias, but the gap between them is narrowing, hinting at potential trend exhaustion.
Key Observations:
Moving Averages (MAs): The crossover has not yet occurred, but the flattening slope of both MAs indicates reduced directional momentum.
MACD: The MACD lines are converging near the zero line, signaling indecision and a possible transition phase. No strong bullish or bearish momentum is evident.
RSI: The RSI sits in the mid-range, avoiding overbought or oversold extremes, which aligns with the current consolidation pattern.
Overall, USD/CAD appears to be in a neutral zone, awaiting a breakout from this range. A decisive move beyond either 1.3200 or 1.4000 could set the tone for the next directional trend.
-MW
Technical Analysis

USD/CHF Trades Below Key Moving Averages Amid Bearish BiasThe chart for USD/CHF highlights a persistent bearish structure, with price action currently below both the 50-day (blue) and 200-day (red) moving averages. This alignment suggests a dominant downtrend, reinforced by the following observations:
Moving Averages: The 50-day MA remains well below the 200-day MA, confirming a long-term bearish crossover. Price trading beneath both averages adds weight to the downside bias.
MACD: The MACD histogram shows subdued momentum, and the signal lines are positioned below the zero line, indicating continued bearish pressure. However, the histogram narrowing hints at potential weakening of the current trend.
RSI: The RSI hovers near the midline, suggesting neutral momentum rather than oversold conditions. This could imply consolidation before the next directional move.
Key Levels:
Support: 0.87461
Resistance: 0.94600
The pair remains in a range but under structural bearish pressure. A sustained break below support could extend the downtrend, while a recovery above the 50-day MA would be an early sign of trend reversal.
-MW

WTI Crude Oil Consolidates at Key Support, Ukraine in FocusWTI Crude Oil is trading near a significant horizontal support level around $55 amidst hopes of a Ukraine peace deal. Price action is currently consolidating, and several technical indicators provide insight into the market’s tone:
Moving Averages: The shorter-term moving average (blue) remains below the longer-term moving average (red), reflecting a broader bearish bias. However, recent candles suggest sideways movement, hinting at potential stabilization.
MACD: The MACD lines are converging, and the histogram is shrinking, signaling that bearish momentum is weakening. This could precede a trend shift if confirmed by price action.
RSI: The RSI sits near the neutral zone around 50, indicating neither overbought nor oversold conditions. This reinforces the consolidation narrative rather than a strong directional trend.
Key Observation: Holding above the support zone is critical for WTI. A decisive break below could extend the bearish structure, while a rebound supported by improving MACD signals might suggest the start of a recovery phase.
-MW

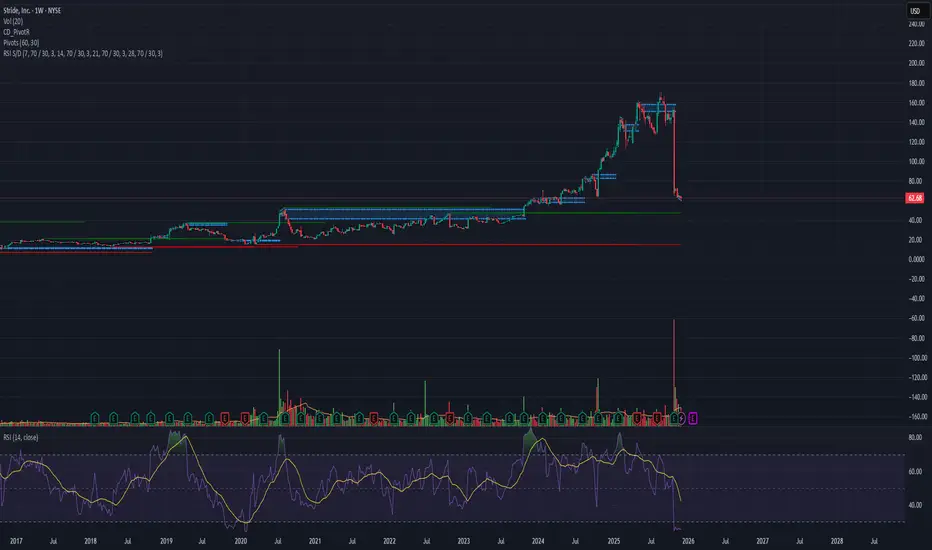
Fast Reversal Setup | Price: 62.68 → Target: 65.81 (+5%)
After the recent lawsuit-related news, LRN dropped sharply from $155 → $62 and is now deep in the oversold area 📉🔥
Volume Signal 📊
This week’s traded volume is higher than anything since its IPO, which often marks a reversal zone.
Repeated Patterns 🔍
Across the daily, weekly, and monthly intervals, the stock is showing its typical reversal pattern, matching previous bounce cycles.
Entry: 62.68
Target: 65.81
Profit: +5% 💰⚡
LTC/USDT | LTC Drops Hard but the Real Opportunity Might Be AheaCRYPTOCAP:LTC rallied all the way to $113 before getting slammed with a heavy correction, dropping more than 34% down to $75. Right now Litecoin is trading near $81 and the momentum is still clearly bearish. As long as this pressure continues, I expect a deeper correction toward the $63 to $70 demand zone.
This is the area that really matters for the next major move. If Litecoin reaches this zone and shows a clean bullish reaction, it becomes a high-interest region for a strong mid-term reversal. A proper reaction here can easily trigger a 100%+ upside move in the coming weeks or months.
For now I’m watching to see how price behaves as it approaches $63 to $70 because that’s where the next big opportunity is likely to form.
Please support me with your likes and comments to motivate me to share more analysis with you and share your opinion about the possible trend of this chart with me !
Best Regards , Arman Shaban

Gold Reload Zone at 4,245 as USD Weakens!!Hey Traders,
In today’s trading session, we are monitoring XAUUSD for a potential buying opportunity around the 4,245 zone. Gold remains in a well-defined uptrend and is currently undergoing a healthy corrective phase, pulling back toward the 4,245 support area, which aligns with the broader trend structure.
Technical context:
The bullish structure remains intact, with price respecting higher highs and higher lows. This retracement toward trend support offers a potential continuation setup within the prevailing uptrend.
Macro & Dollar backdrop:
The US Dollar remains under pressure following the recent 25bps Fed rate cut, alongside signs of cooling US labor market data. With balance sheet expansion resuming and markets increasingly sensitive to incoming employment figures, the risk remains skewed toward further USD weakness. Any additional deterioration in labor data could accelerate expectations for another rate cut, reinforcing the bearish Dollar narrative.
Gold correlation:
A softer USD environment continues to support Gold via its negative correlation with the Dollar, keeping the upside bias intact as long as trend support holds.
Watching price behavior closely around 4,245 for confirmation of renewed buying interest.
Trade safe,
Joe

AUDUSD Breakout Retest as Dollar Weakens!Hey Traders,
In today’s trading session, we are monitoring AUDUSD for a potential buying opportunity around the 0.66000 zone. The pair previously traded within a downtrend but has successfully broken out, signaling a shift in market structure.
Price is now in a healthy corrective phase, retracing toward the 0.66000 support zone, which aligns with prior resistance turned support — a classic breakout–retest setup.
Fundamental backdrop:
The US Dollar remains under pressure following softer macro conditions and fading expectations of sustained Fed hawkishness. Recent data continues to point toward a cooling US labor market, reinforcing a weaker USD environment and improving the risk-reward profile for AUDUSD on pullbacks.
Focus: Watching price behavior around 0.66000 for confirmation of bullish continuation.
Trade safe,
Joe

USDCAD at Critical Trend ResistanceHey Traders,
In tomorrow’s trading session, we are monitoring USDCAD for a potential selling opportunity around the 1.38000 zone.
Technical structure:
USDCAD remains in a clear downtrend and is currently in a corrective phase, with price retracing toward the 1.38000 area — a key zone of trend resistance and prior supply. This level represents a technically significant area where sellers may look to reassert control in line with the broader bearish structure.
What to watch:
Price behavior around 1.38000 will be critical. A clear rejection or loss of bullish momentum here could signal trend continuation to the downside.
Trade safe,
Joe

AUDUSD at Decision Point — Trend or Trap?Hey Traders,
In today’s trading session, we are monitoring AUDUSD for a potential buying opportunity around the 0.66200 zone.
Structure:
AUDUSD remains in a well-defined uptrend, and price is currently undergoing a healthy pullback toward the rising trend structure. The 0.66200 area stands out as a key zone of confluence, acting as both dynamic trend support and a prior reaction level.
Context:
As long as price holds above this level, the broader bullish structure remains intact, keeping the path open for a continuation toward recent highs.
Plan:
Watching for bullish reaction and confirmation around 0.66200 before considering continuation setups.
Trade safe,
Joe

BTC long-term TAIt's been a while since the lasts posts, let's keep it up!
Bitcoin is entering an extreme bearish area on weekly time frame, the uptrend that lasted since March 2023 has been officially broken. The recovery may take anywhere between 6 to 12 months, no one can tell precisely but it's going to take some time.

ALCHUSDT – 4H trade ideaPrice is currently forming a bullish falling wedge, with liquidity resting at the 4H FVG below.
Based on the Total Market Cap context, I’m expecting a potential AMD scenario:
Possible wick down into the 4H FVG
Followed by a bullish breakout from the falling wedge
Price is consolidating above the Monthly VWAP, which supports the bullish bias.
If we see confirmation after the sweep, continuation towards higher levels becomes likely.
➡️ Check the weekly analysis for higher timeframe context.

GLD mid-term TAGold is approaching a possible correction on mid-term trend, currently there's a double-top formation with negative divergence in accumulation, technically there's still juice to breakout the top but it will be quite difficult and it won't last long without the correction.
Following the long-term formation there's still plenty of resources to continue the uptrend but the correction surely will take place.

Dash Is Sitting At The Strong Support Within The Wedge PatternDash made a strong rally, as anticipated earlier, but the recent sharp decline suggests that the five-wave bullish impulse has likely been completed. As a result, price action now appears to be in a higher-degree three-wave corrective phase. This pullback fits well with a broader ABC corrective structure following the impulsive advance.
On the 4-hour chart, Dash seems to be trading within wave C of this higher-degree correction. Moreover, price action suggests that the market may be in the final stages of wave (5) within a wedge pattern. This setup often signals trend exhaustion, especially when combined with strong historical support. In this case, the 40 area stands out as a key support zone where buyers could step back in and stabilize the price.
Given this technical structure, traders should be alert for a potential rebound and the early stages of a new rally, particularly if price manages to recover and hold above the 53.50 level. However, it’s important to remain cautious, as the first meaningful bullish evidence would only be seen on a breakout above the 71 area. A decisive move above 105 would then serve as full bullish confirmation, signaling that a larger upside continuation is back in play.
Until those levels are reclaimed, price action should be monitored closely, as volatility may remain elevated near the current support zone.

Gold Is Compressing for a Break, Macro Forces Are Lining UpMARKET BRIEFING – XAU/USD (4H)
Market State:
– Gold is consolidating bullishly below the previous ATH at 4,380, maintaining higher lows. This price behavior aligns with a market that is absorbing supply, not distributing.
MACRO CONTEXT – WHY THE UPSIDE CASE IS STRONG
1. Fed Policy: Tightening Is No Longer the Driver
– The Fed has shifted from aggressive tightening to a data-dependent, hold-biased stance.
– Rate expectations are capped → real yields struggle to push higher, removing downside pressure on gold.
– Markets are already pricing future easing cycles, which structurally favors precious metals.
2. USD Weakness Is Structural, Not Temporary
– The U.S. Dollar has failed to extend upside despite elevated rates a classic late-cycle signal.
– Any USD bounce remains corrective while macro flows rotate toward hard assets and inflation hedges.
3. Global Risk & Geopolitics Remain Unresolved
– Ongoing geopolitical instability and fiscal uncertainty continue to support safe-haven demand.
– Central banks remain net buyers of gold, reinforcing long-term accumulation beneath price.
4. Liquidity Environment Favors Asset Inflation
– Global liquidity conditions are stabilizing after prolonged tightening.
– Gold historically performs best during liquidity inflection phases, especially when rates peak.
TECHNICALS + MACRO ALIGNMENT
Key Levels:
– Resistance / Decision Zone: 4,360 – 4,380
– Support Holding Structure: 4,300 – 4,320
– Structural Base: ~4,250
– Macro Expansion Target: 4,450 → 4,500
Price Action:
– Bullish consolidation under ATH = smart money absorption.
– Macro backdrop removes the conditions required for a sustained breakdown.
– Technical compression + macro tailwinds = high-probability expansion setup.
Next Move (High-Confidence Scenario):
– Acceptance above 4,380 triggers range expansion toward 4,450–4,500.
– As long as price holds above 4,300, pullbacks are continuation opportunities, not reversal signals.
Gold is not just technically strong — macro conditions are validating the breakout thesis.
This is not speculation; it is structure + policy + liquidity moving in the same direction.

USDCHF: High Chance for Recovery?! 🇺🇸🇨🇭
USDCHF may continue recovering after a test
of a strong intraday horizontal support.
It looks like we got a bearish trap below that
and we see a relatively strong bullish momentum now.
Goal will be 0.7985
❤️Please, support my work with like, thank you!❤️
I am part of Trade Nation's Influencer program and receive a monthly fee for using their TradingView charts in my analysis.

Gold XAUUSD Analysis Dec 16, 2025 | Fed Policy, Dollar WeaknessOANDA:XAUUSD GOLD ANALYSIS Gold Strength Persists as Policy Uncertainty and Global Tensions Rise (Dec 16, 2025)
Welcome back to Trade with DECRYPTERS 🔍📈
📊 Market Overview
Gold traded firmly bullish on December 16, 2025, holding within the $4,300–$4,350 zone and briefly testing levels near October’s record highs. Both spot and futures prices posted modest intraday gains while hovering near multi-month peaks.
The rally was supported by expectations of further Fed rate cuts in 2026, a cooling US labor market, and a weaker US dollar alongside softer Treasury yields. Persistent geopolitical tensions and steady central-bank buying added strong safe-haven demand. Overall, gold remains structurally bullish, extending its exceptional 2025 performance.
🔑 Key Fundamentals
🟨 Gold is consolidating around $4,300–$4,330, holding near multi-year highs after a 50–60% YTD rally.
🏦 The Federal Reserve cut rates again to 3.5–3.75%. Despite a relatively hawkish dot plot, markets continue to price further easing in 2026, supporting gold through lower real yields.
💵 The US Dollar Index remains weak at 98–99, boosting global gold demand and improving affordability for non-USD buyers.
📉 Treasury yields near 4.2% add mild pressure, but expectations of gradual Fed easing limit upside risks to yields.
🌍 Central-bank buying remains exceptionally strong at 634–750 tonnes YTD, led by Poland, China, Turkey, and others, driven by de-dollarization and geopolitical hedging.
🔥 Inflation is cooling but remains above target, allowing gold to benefit from real-yield compression and elevated risk aversion.
🌍 Geopolitics Impacting Gold
🌐 Middle East Tensions
Ongoing Iran–Israel and broader regional conflicts continue to push gold higher through fear-driven flows. Headlines regularly trigger 1–3% intraday surges, making geopolitics a key driver behind October’s record highs near $4,381.
⚔️ Russia–Ukraine War
Continued escalations and stalled negotiations keep risk premiums elevated. Energy volatility and sanctions reinforce gold’s role as a non-fiat hedge, with no clear resolution maintaining long-term support.
🇺🇸🇨🇳 US–China Trade Tensions
Tariff threats, technology export controls, and retaliatory measures increase uncertainty. Trump era restrictions played a major role in pushing gold above $4,300, and markets continue to price higher geopolitical volatility into gold.
🌎 Other Emerging Risks
Instability in regions such as South Korea and Syria, alongside renewed concerns over European debt, further strengthen safe-haven demand. Ongoing de-dollarization efforts encourage central banks to continue adding gold reserves.
⚖️ Risk-On Risk-Off Analysis
📉 Yields Overview
Gold trades around $4,280–$4,315, holding elevated levels despite consolidation.
The US 10-year yield sits near 4.16–4.20%, rising slightly after hawkish Fed remarks.
Real yields remain subdued due to cooling inflation, which continues to support gold. While higher yields create short-term headwinds, structural 2025 drivers have overridden traditional yield-gold correlations.
🔄 Key Relationships
📊 The US Dollar Index at 98.2–99.0 remains weak, strongly supporting gold’s year-to-date momentum.
📈 The S&P 500 near 6,800 reflects mild risk-on sentiment, yet gold continues to rise alongside equities due to defensive hedging demand.
📉 The VIX around 15–16 signals calm markets. Low volatility caps extreme safe-haven premiums but does not prevent gold from holding elevated levels.
🧠 Overall Sentiment
Markets remain mildly risk on with strong defensive undertones driven by geopolitics and central-bank accumulation. Gold is likely to hold elevated levels, with potential pullbacks toward $4,200 support if yields rise or the dollar firms. Structural tailwinds continue to favor upside toward $4,350–$4,400.
📰 Key Insights From Credible Sources
Market commentary increasingly links Trump’s tariffs, fiscal pressures, and policy uncertainty to a strongly bullish gold outlook. Analysts highlight how trade conflicts, de-dollarization, and rising deficits continue to support higher prices.
Eastern central banks are rapidly accumulating gold, reinforcing its role as neutral money amid global monetary shifts and geopolitical fragmentation.
Several reports speculate on potential gold revaluation under a future Trump administration in 2026, citing rising debt levels and structural weaknesses in the fiat system.
Gold has repeatedly surged following tariff announcements and trade-war escalations, while BRICS-related gold buying continues to boost long-term demand.
🏁 Conclusion
Gold remains firmly supported by a powerful mix of weak real yields, a soft dollar, and persistent geopolitical tensions, keeping prices elevated near multi-year highs. Central-bank accumulation and hedging demand reinforce structural bullish momentum despite occasional yield-driven pullbacks.
With expectations of further Fed easing in 2026 and unresolved global conflicts, upside risks outweigh downside corrections. Overall, gold’s outlook remains strongly bullish, with momentum targeting $4,350–$4,400, and potential extensions if volatility accelerates.
🙌 Support the Analysis
If this breakdown added value to your trading
👍 Drop a like
💬 Comment your key levels
📈 Share your charts with the community
Let’s grow together 🚀
Best Regards,
M. Moiz Khattak
Founder
TRADE WITH DECRYPTERS 🟡📊

Nifty Update - 16/Dec/2025Today’s price action played out exactly as expected.
Nifty attempted to move up but was rejected at the lower boundary of the rising channel, confirming that recent bounces are corrective in nature.
The 25,700–25,300 demand zone is still holding well.
Notably, the lower end near 25,300 also coincides with a key Fibonacci retracement, making it a strong confluence support area.
There is no breakdown yet, but upside remains capped as long as Nifty stays below the channel.
Advisory: Continue to stay cautious. Avoid aggressive buying until the index shows clear structural strength again.
HobbyToPassion_ManishJain

XAUUSD Clearly Bullish – This Is Not a TrapHello traders, let’s analyze XAUUSD today!
With the current setup, XAUUSD is presenting a clean and well-defined bullish picture , without the need for overly complex speculation.
From a fundamental perspective , the environment is clearly leaning toward the bullish side. A weaker USD combined with declining U.S. bond yields is creating a favorable backdrop for gold. In addition, expectations that the Fed may ease monetary policy remain in place, encouraging capital to continue flowing into gold as both a safe-haven asset and a medium-term speculative instrument. At this stage, the market lacks a strong catalyst capable of reversing XAUUSD’s upward trend.
Looking at the chart structure, the bullish trend is strongly confirmed. Price is moving within a well-defined ascending channel , consistently forming higher highs and higher lows. The Ichimoku system fully supports the bulls, with price holding above the cloud and key lines sloping upward, signaling that this move is structurally strong rather than temporary . The recent pullback should therefore be viewed as a healthy technical correction, not a trend reversal.
In terms of scenarios, the area around 4,280 is acting as a key support zone. As long as price continues to hold above this level, XAUUSD has a strong probability of resuming its upward move toward the 4,400 target, in line with the current channel structure. This scenario aligns both technically and fundamentally.
Wishing you all successful and disciplined trading!

NZDCAD: Bearish Continuation After Breakout 🇳🇿🇨🇦
There is a high chance that NZDCAD will drop lower
after a breakout of a key intraday/daily support yesterday.
Next support will be 0.793
❤️Please, support my work with like, thank you!❤️
I am part of Trade Nation's Influencer program and receive a monthly fee for using their TradingView charts in my analysis.

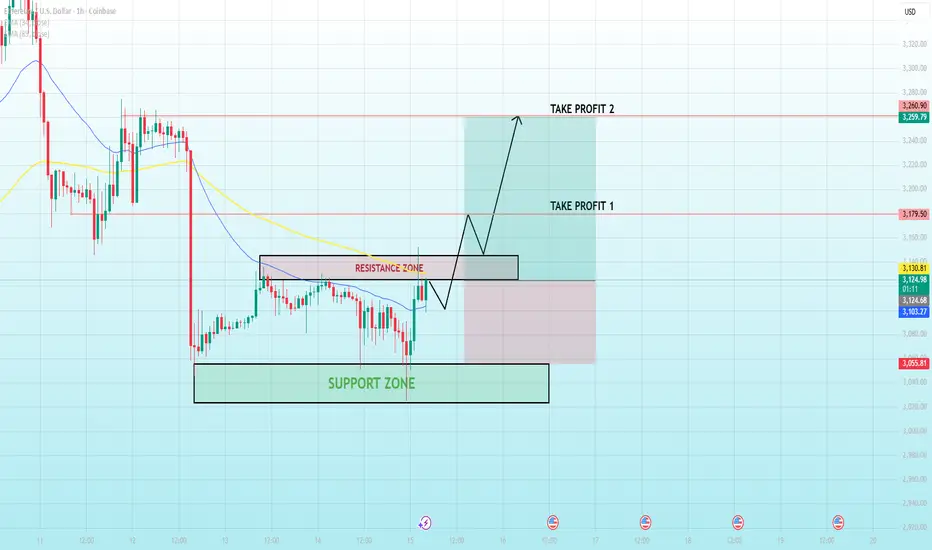
Ethereum Tests a Key Flip Zone....🔹 MARKET BRIEFING – ETH/USD (1H)
Market State:
– Ethereum has reacted strongly from the lower support zone and is now pressing into a well-defined resistance area.
– The impulsive bounce suggests short-term momentum recovery, but price is still interacting with prior supply, making this a decision point rather than a confirmed continuation.
Key Technical Levels:
– Support Zone: 3,030 – 3,060
– Resistance / Flip Zone: 3,120 – 3,145
– Take Profit 1: 3,175 – 3,185
– Take Profit 2: 3,250 – 3,265
– EMAs are flattening, reinforcing a transition from corrective to neutral structure.
🌍 Macro Context – What Supports the Upside Attempt
– Bitcoin Stability: BTC holding above recent lows reduces systemic downside pressure on ETH.
– Fed Expectations: With rates priced to remain steady, risk assets are allowed to recover technically, though without aggressive expansion.
– Liquidity Rotation: Post-selloff conditions favor mean-reversion rallies, especially from clean support zones.
Next Move:
– Acceptance above the 3,145 resistance zone would confirm a bullish flip and open the path toward 3,175 → 3,265.
– Failure to hold above resistance would likely result in a pullback toward the 3,060 support, keeping ETH range-bound.
Bottom Line:
– Ethereum is at a make-or-break level.
– Strength above resistance confirms continuation rejection reinforces a broader consolidation phase until a clearer macro catalyst emerges.
Gold Is Loading the Final Break — $4,500 Is No Longer a StretchMARKET BRIEFING – XAU/USD (4H)
Market State:
– Gold remains in a strong bullish structure on H4, trading well above key EMAs and holding higher highs. Momentum is intact; the recent pause is consolidation, not distribution.
Key Levels:
– Primary Support: 4,250 – 4,260 (EMA cluster / structure base)
– Immediate Resistance: 4,370 – 4,380
– Expansion Zone: 4,420 – 4,450
– Upside Objective: 4,500 (New ATH zone)
Price Action Read:
– Pullbacks are shallow and quickly absorbed, indicating active dip buying.
– Structure shows a stair-step advance with brief pauses before continuation — typical of a trend-strength phase.
Next Move:
– Holding above 4,260 keeps the bullish roadmap intact. Acceptance above 4,380 opens room for range expansion toward 4,450–4,500. Any dip into support is a continuation opportunity, not a reversal signal.

Will Bitcoin Break Through $94,000 or Drop Back to Support?Bitcoin (BTC/USD) Market Analysis – 1H Chart
1. Current Price Structure
Bitcoin has been fluctuating within a range, respecting the support zone around $88,992 and the resistance zone around $94,234. Price action shows a period of consolidation after hitting the resistance zone, signaling indecision in the market.
The price remains above both the EMA 34 and EMA 89, confirming that the medium-term trend is still bullish, as the moving averages are providing upward support.
2. Liquidity Zones
Resistance Zone: $94,234 - $94,800. This region is a critical resistance, and price tends to struggle when it reaches this area, with rejections observed in recent price movements.
Support Zone: $88,992 - $89,200. The price is currently respecting this support, with buyers stepping in to push the price upward. A break below this zone may signal a deeper correction.
3. Today’s Market Scenario
Main Scenario – Bullish Continuation (60% Probability): If price holds above the support zone ($88,992) and breaks through the resistance zone, Bitcoin is likely to continue its uptrend toward the next targets:
Target 1: $92,878
Target 2: $94,800 (near the resistance zone)
Extended Target: $96,000
Bearish Scenario – Lower Probability (40%): If the price fails to break the resistance zone, we may see a retest of the support zone at $88,992. A break below $88,992 would open the way for further downside towards $87,600.
4. Market Psychology
Bullish Sentiment: The general trend remains optimistic, with institutional investors likely accumulating positions at the support zone.
Bearish Pressure: Retail traders may be getting caught in the volatility near the resistance zone, which often leads to false breakouts and liquidity grabs.
5. Intraday Strategy Guidance
Buy Opportunity: Look for price rejections near the support zone ($88,992 - $89,200). A clean bounce off this level would be a great entry for a continuation of the uptrend.
Sell Opportunity: Consider shorting if Bitcoin fails to break the resistance zone ($94,234) and begins to reverse from this level, especially if there is a strong bearish candle or rejection.
Upcoming Key Factors
Macroeconomic Factors (Fed Announcements): Any macroeconomic news, particularly announcements from the Federal Reserve regarding interest rates or economic policies, could impact the volatility of Bitcoin. A dovish Fed stance could provide further bullish momentum, while hawkish signals may trigger a correction.
Global Events: Be aware of global economic events (e.g., geopolitical tensions, economic reports) that might influence risk sentiment in the market.
Conclusion:
The market is currently in a consolidation phase, with a strong bullish bias above the support zone. A clear breakout above the resistance zone could open up more upside potential. However, any rejection at the resistance may lead to a retracement. Keep an eye on macroeconomic news, particularly related to the Fed, as it could be a catalyst for either a breakout or breakdown.
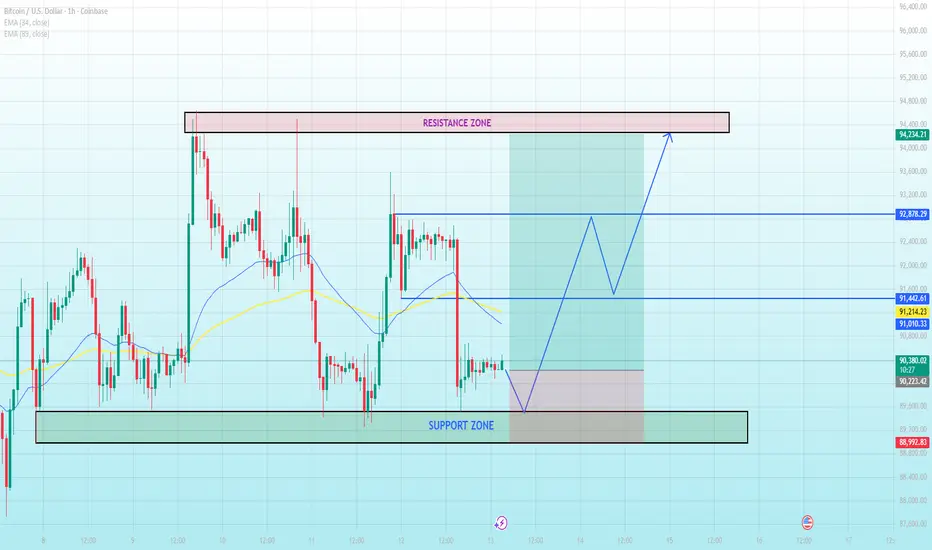
Bitcoin Repeats a Familiar Pattern - NEXTZone Is Already Defined🔹 MARKET BRIEFING – BTC/USD (1H)
Market State:
– Bitcoin is once again trading inside a repeating range structure, similar to the previous consolidation phases marked (1 → 3).
– Price has just rebounded from the lower demand area and is now holding above short-term support, while still trading below the key moving averages, keeping the broader structure neutral-to-corrective.
Key Technical Levels:
– Demand / Base Zone: 87,800 – 88,600
– Mid-Range Reaction Level: 90,000 – 90,300
– Major Resistance / Supply Zone: 93,000 – 93,500
– The projected move toward zone (4) aligns with prior range highs and unfilled liquidity.
🌍 Macro Context – Why This Remains a Range, Not a Breakout
– Federal Reserve: Policy expectations remain stable with no immediate liquidity expansion signal. This limits impulsive upside in risk assets.
– Liquidity Conditions: The recent downside move cleared leveraged longs, enabling a technical rebound, but macro liquidity is not supportive of trend continuation yet.
– Risk Sentiment: Broader markets continue to show consolidation behavior, reinforcing mean-reversion rather than directional conviction.
Next Move:
– A controlled push toward 90,000–90,300 is likely as part of a corrective recovery.
– Extension toward the 93,000–93,500 resistance zone is possible, but this area is expected to act as a decision point, not an automatic breakout.
– Only acceptance above 93,500 would invalidate the range-based thesis and shift the bias toward trend continuation.
Bottom Line:
– Bitcoin is following a structured, repeating range pattern, not randomness.
– Until macro conditions shift, rallies should be viewed as range extensions into resistance, not confirmed trend reversals.
