GBPAUD: Important Breakout 🇬🇧🇦🇺
GBPAUD broke and closed below a key intraday/daily horizontal support.
It opens a potential for a further decline.
Next support is 2.016.
I think it will be reached soon.
❤️Please, support my work with like, thank you!❤️
I am part of Trade Nation's Influencer program and receive a monthly fee for using their TradingView charts in my analysis.
Technical Analysis

USDJPY Potential DownsidesHey Traders, in today's trading session we are monitoring USDJPY for a selling opportunity around 155.900 zone, USDJPY is trading in a downtrend and currently is in a correction phase in which it is approaching the trend at 155.900 support and resistance area.
Trade safe, Joe.

USDCAD: Bullish Move After Trap 🇺🇸🇨🇦
I see a bearish trap on USDCAD after a test of a key
daily support.
A formation of a bullish CHoCH on a 4h time frame
during the Asian session today suggests a strong buying interest.
I expect a rise to 1.402
❤️Please, support my work with like, thank you!❤️
I am part of Trade Nation's Influencer program and receive a monthly fee for using their TradingView charts in my analysis.

EUR/USD Is Walking on Thin Ice📉 EUR/USD TECHNICAL ANALYSIS — RISING WEDGE LOSING MOMENTUM
1. Market Structure Overview
EUR/USD is moving inside a Rising Wedge, a classic bearish reversal pattern.
Key observations from current price action:
- The higher highs are becoming weaker, showing fading bullish momentum.
- The lower trendline has been tested multiple times, increasing the probability of a breakdown.
- The price is hovering near your entry zone, right at the confluence between:
✓ Rising Wedge support
✓ Micro lower-high structure
- Candles show rejection wicks on the upside, indicating pressure from sellers.
This structure suggests the market is preparing for a bearish shift.
2. Main Scenario — Breakdown is More Likely (Preferred)
If EUR/USD breaks below the Rising Wedge support with a firm candle close:
👉 Expect a sharp sell continuation toward the demand zone.
SELL confirmation checklist:
- A candle closes below the dotted support line
- Price retests that broken line and rejects → your entry zone
- A new lower high forms
When this happens, sellers will dominate the next movement.
Downside Targets
Target 1: Support zone in the green zone
Target 2: Previous swing low of the wedge
Target 3: Extended bearish continuation if momentum accelerates
3. Secondary Scenario — Weak Bounce but Still Bearish
If price bounces slightly from the wedge bottom but fails to break the upper resistance zone, then:
- Market remains weakly bullish but highly vulnerable
- Momentum will continue to compress
- Eventually, a breakdown becomes the high-probability outcome
- Buy positions are not recommended here — risk > reward
4. Intraday Bias
📌 Bias: Bearish to moderately bearish
📌 Setup: Sell the retest near the entry zone
📌 Invalidation: Clean breakout above the resistance zone
Sellers are in control as long as the price stays inside the wedge and below the resistance zone.
5. Final Verdict
EUR/USD is signaling a high-probability bearish reversal:
Rising Wedge losing power
Buyer exhaustion visible
Support line weakened
Retest zone beautifully aligned for SELL positions
👉 Expect: Breakdown → Retest → Sell-off toward major support.

XAUUSD: Strong Growth and Buying OpportunityWith the prospect of a Fed interest rate cut and the weakening of the USD, XAUUSD is showing signs of a strong growth phase. Based on macroeconomic news and technical charts, we can see that the price of gold continues to hold steady above the uptrend line .
XAUUSD is currently pulling back to instant support at 4,120,000 USD . The uptrend is supported by the EMA (34, 89) indicators and the current upward trend. The strong support at 4,120,000 USD plays a crucial role in maintaining this upward momentum.
Short-Term Forecast:
XAUUSD could continue to rise to higher levels if it holds above 4,120,000 USD, with the next target being the TP1 level at 4,200,000 USD , and even the TP2 level at 4,250,000 USD . This is supported by market expectations that the Fed will continue to lower interest rates in December, weakening the USD and boosting demand for gold as a safe-haven asset.
Conclusion:
With a stable upward trend and support from both the market and chart indicators, XAUUSD is likely to continue its upward movement. If there is a pullback to the support level, it will provide an excellent opportunity for buying.

ETH BREAKOUT: DON’T MISS THE NEXT BIG MOVE!📌 ETH/USD MARKET ANALYSIS – 30M (Professional Trader Style)
1. Overall Market Structure
- Price has been consolidating inside a descending channel.
- Forming consistent lower highs – lower lows, but selling pressure is weakening near the demand zone.
- Finally, price created a rectangle compression and then broke out aggressively above the descending trendline.
2. Key Zones
✔ Demand Zone (Strong Support): 2980 – 3010
Multiple rejections + strong bullish reactions → buyers clearly defend this area.
✔ Supply Zone (Key Resistance): 3065 – 3090
Price is approaching this zone again, but momentum suggests a high probability of BREAKING THROUGH.
3. Breakout Confirmation
The breakout candle shows:
- Strong bullish body
- Increased volume
- Clear break of previous lower high → CHOCH (Change of Character)
This signals that ETH is transitioning from a correction phase into a renewed bullish trend.
4. Trading Plan (Price Action Style)
📌 Primary Scenario – BUY the Retest
Wait for price to pull back into the broken supply zone (now a demand flip) at 3065–3075.
Enter BUY when you see:
- Rejection wicks
- Bullish engulfing
- FVG reaction
- Or any PA confirmation
🎯 TP1: 3120
🎯 TP2: 3160
🎯 TP3: 3200+
⛔ SL: Below 3045 (below breakout structure)
5. Why This BUY Setup Is High Probability
✔ Clean breakout of the descending channel
✔ Strong momentum push (not a weak fake-out)
✔ Beautiful defense at demand zone
✔ Trendline tested 3 times → valid breakout
✔ Market structure shift from bearish → bullish
6. Pro Tips
Don’t FOMO buy the breakout candle
Wait for a clean retest for better R:R
Focus on zone reaction + CHOCH + bullish momentum
Stay patient. The market always rewards disciplined traders.

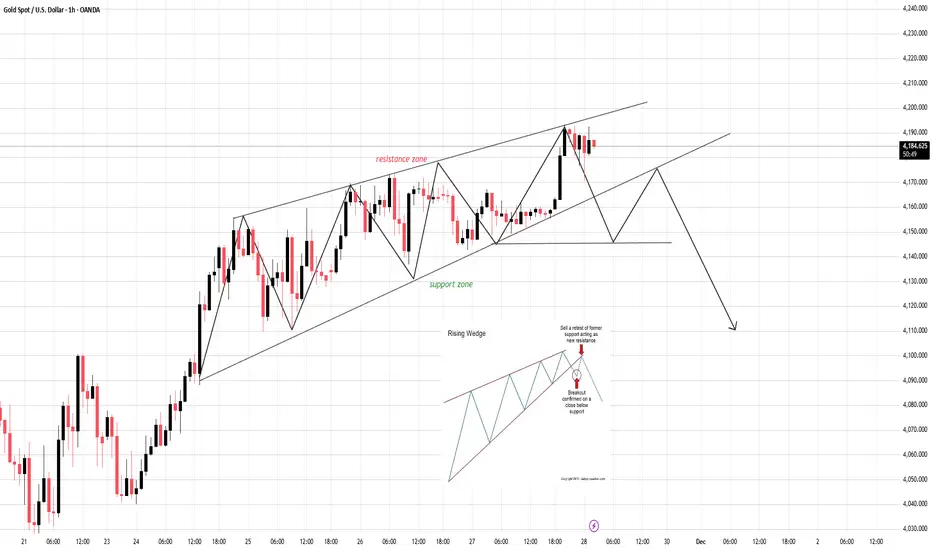
Rising Wedge on the Edge — The Breakdown Is Only One Candle AwayCURRENT MARKET ANALYSIS & TODAY’S EXPECTED MOVE
1. Current Market Structure
The market is currently respecting the structure of a Rising Wedge — a pattern where price continues rising but momentum weakens, volatility compresses, and the probability of a bearish breakdown increases.
Key observations:
- Price is moving near the upper boundary of the wedge.
- Newly formed highs lack strength → buying pressure is fading.
- Recent candles show long upper wicks, indicating strong sell pressure at resistance.
- The lower support line has been tested multiple times, increasing the likelihood of a breakdown.
- Buyers are losing control while sellers are beginning to step in.
2. Primary Scenarios for Today
✓ Scenario 1 – Breakdown of the Rising Wedge (High-probability scenario)
If a candle closes decisively below the lower support, the market is likely to:
- Drop quickly toward the next support levels.
- Trigger strong seller participation on the retest of the broken trendline (support → resistance).
- Confirm a high-quality SELL entry.
Downside Targets:
- Target 1: Nearest support zone
- Target 2: Previous low of the wedge
- Target 3: Major support below (depending on your timeframe)
✓ Scenario 2 – Price holds but remains weak
If price bounces from the lower edge but fails to break the upper boundary:
- The structure remains weakly bullish but vulnerable.
- Any upward move is fragile and easy to reverse.
- Not suitable for chasing BUY positions.
- Bulls need a strong breakout above the upper trendline to reverse the bias — which currently has a lower probability.
3. Intraday Trend Bias
Today’s intraday bias remains: DOWN (or at least corrective to the downside).
Confirmation signs:
- Support becomes easier to break the more it is tested.
- Volume is weak on bullish moves.
- Price action is tightening → preparing for a breakout.
- Sellers will wait for a clean retest, as shown in your reference chart.
4. Conclusion
The market is approaching the end-phase of a Rising Wedge, a classic bearish reversal pattern.
Priority today: Wait for breakdown → retest → SELL.
Avoid chasing BUY setups due to high reversal risk.
Expected development:
Break support → Retest → Continue dropping
“Your edge is built from discipline — not every setup must be traded, but every trade must follow your plan.”
Drop your market bias in the comments — do you expect the breakdown or a surprise breakout?
BTCUSD – CHANNEL RESPECT & BULLISH CONTINUATION SCENARIO 📌 BTCUSD – CHANNEL RESPECT & BULLISH CONTINUATION SCENARIO (H1 Analysis)
1. Market Structure – Dow Theory Perspective
On the H1 timeframe:
- BTC has consistently printed Higher Highs (HH) and Higher Lows (HL) inside a well-defined ascending channel.
- The recent corrective move into the ENTRY ZONE aligns perfectly with the channel’s mid-support.
- Buyers have shown early signs of stepping back in, forming a localized HL and rejecting lower prices.
According to Dow Theory:
➡ An uptrend remains intact as long as price continues forming higher lows and doesn’t break key structure support.
➡ BTC is currently maintaining all bullish conditions.
This confirms that the pullback is structural, not a reversal.
2. Channel Confirmation & Price Reaction
The ascending channel remains active and respected:
✔ Price rejected the upper resistance of the channel
✔ A healthy retracement is ongoing
✔ The market is approaching the ENTRY ZONE with decreasing bearish momentum
The reaction behavior is typical of bullish continuation within a trend channel.
There is no sign of market breakdown as long as price stays above the SUPPORT ZONE.
3. Key Zones to Watch
🔹 Support Zone (Entry Zone)
Located at the mid-range of the channel — a high-probability area for buyers to return.
This zone has historically shown strong demand and fits perfectly into the channel geometry.
🔹 Resistance Zone
The upper boundary of the chart and liquidity zone.
This is where previous rejection occurred, and where TP2 & TP3 are aligned.
4. Bullish Scenario – Primary Outlook
BTC is expected to follow a standard:
pullback → bullish rejection → continuation upward structure.
🎯 TP1: Minor channel resistance (short-term reaction zone)
🎯 TP2: Previous strong resistance zone
🎯 TP3: Channel top & extended liquidity zone
As long as BTC holds above the SUPPORT / ENTRY ZONE, upward continuation remains the highest-probability scenario.
5. Alternative Scenario
If BTC breaks below the support zone:
- Price may retest the lower channel boundary
- Market would enter a deeper correction phase
- Trend remains bullish unless the lower channel is broken
This scenario is less likely but still important to consider.
6. Technical Summary
✔ BTC continues respecting the rising channel
✔ Price is forming clean HL patterns
✔ Pullback is controlled — not impulsive
✔ Liquidity targets remain untouched above
✔ Structure supports bullish continuation
Everything aligns with a high-probability bullish continuation setup.
🔥 Conclusion
BTC remains in a well-defined bullish channel, and current price action is moving exactly according to prior projections. As long as price stays above the SUPPORT / ENTRY ZONE, the market strongly favors an upward continuation toward TP1 → TP2 → TP3.
This is a clean, structure-based opportunity for channel traders, trend traders, and momentum traders alike.

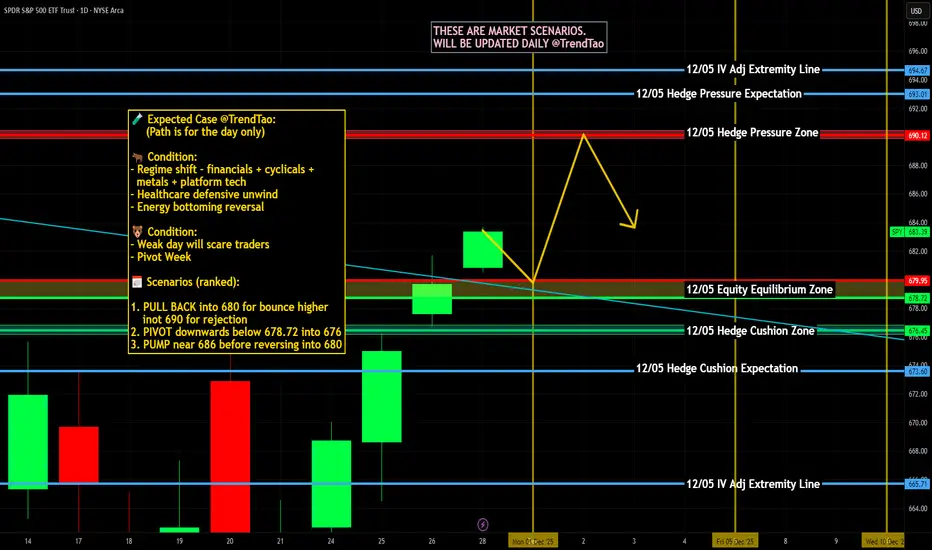
$SPY & $SPX Scenarios — Week of Dec 1 to Dec 5, 2025🔮 AMEX:SPY & SP:SPX Scenarios — Week of Dec 1 to Dec 5, 2025 🔮
🌍 Market-Moving Headlines
🏭 PMI and ISM reset the growth story: Monday and Wednesday bring manufacturing and services surveys that will steer the “soft landing versus slowdown” debate into year end.
🎤 Powell in prime time: Monday night remarks from the Fed Chair are the key policy event of the week and can move yields and risk right into the Asia open.
🧾 Backlog inflation and income data: Friday’s delayed September PCE, income, and spending finally land, giving a cleaner read on the Fed’s preferred inflation gauge.
📉 Jobs and ADP midweek: ADP and weekly claims keep traders focused on labor cooling versus resilience ahead of the next full employment report.
📊 Key Data & Events (ET)
MONDAY, DEC 1
⏰ 9 45 AM
• S and P Final United States Manufacturing PMI (Nov) — prior 51.9
⏰ 10 00 AM
• ISM Manufacturing (Nov)
⏰ 8 00 PM
• Fed Chair Jerome Powell speaks
TUESDAY, DEC 2
⏰ 10 00 AM
• Fed Vice Chair for Supervision Michelle Bowman testifies
⏰ TBA
• Auto Sales (Nov) — around 16.4 million expected
WEDNESDAY, DEC 3
⏰ 8 15 AM
• ADP Employment (Nov) — expected around 42,000
⏰ 8 30 AM
• Import Price Index (Sept, delayed)
• Import Price Index excluding fuel (Sept, delayed)
⏰ 9 45 AM
• S and P Final United States Services PMI (Nov)
⏰ 10 00 AM
• ISM Services (Nov)
THURSDAY, DEC 4
⏰ 8 30 AM
• Initial Jobless Claims (week of Nov 29)
• United States Trade Deficit (Oct)
⏰ 12 00 PM
• Fed Vice Chair for Supervision Michelle Bowman speaks
FRIDAY, DEC 5 — PCE Backlog Day
⏰ 8 30 AM
• Personal Income (Sept, delayed report)
• Personal Spending (Sept, delayed report)
• PCE Price Index (Sept, delayed report)
• Core PCE Price Index (Sept, delayed report)
• PCE and Core PCE year over year (Fed’s preferred inflation gauges)
⏰ 10 00 AM
• University of Michigan Consumer Sentiment, preliminary (Dec) — around 51.0
⏰ 3 00 PM
• Consumer Credit (Oct) — prior roughly 13.1 billion
⚠️ Disclaimer: Educational and informational only — not financial advice.
📌 #SPY #SPX #trading #stocks #macro #Powell #PCE #ISM #ADP #inflation #economy #markets #investing
SPX WEEK 48 — Strong Bounce Into Year-End! 2026 BULL RUN COMING?Strong week for the SP:SPX index. After two weeks of hesitation candles, price finally shifted back into strength and pushed decisively higher. This week’s candle not only reclaimed momentum but fully erased last week’s cooling-off behavior.
Price also moved well above the key mid-range levels that traders usually watch to define trend health. It’s now sitting firmly above the major risk zone and continues building distance away from it — a clear sign of strength. From the moment this week’s upside break triggered, the index has gained roughly 1.9%, and that kind of move typically translates into solid returns for options traders playing directional setups.
Major support zones sit lower around 5900, 5100, and the deeper structural support near 4000. As long as price holds above the upper layers of support, momentum remains intact.
On the higher-timeframe monthly chart, the trend has been active for eight straight months with no signs of exhaustion. Price is still far above the level where the monthly trend began, and even further above the long-term midline — showing how dominant the larger trend still is.
The 2-day chart continues to support the overall bullish structure, breaking above short-term levels and maintaining strength after multiple confirmations earlier in the week.
This week was a clean continuation of the broader uptrend — strong candle, strong momentum, and strong positioning above every major structural region.
Elite clarity. Elite precision. More coming soon.

Bitcoin Bullish Bitcoin will go long after breakout and retest with pin bar above 50 fib levels.
NOTE: This analysis involved technical analysis only no fundamental analysis involved.

EURUSD: Support & Resistance Analysis for Next Week 🇪🇺🇺🇸
Here is my latest structure analysis
and important supports and resistances for EURUSD
for next week.
Consider these structures for pullback/breakout trading.
❤️Please, support my work with like, thank you!❤️
I am part of Trade Nation's Influencer program and receive a monthly fee for using their TradingView charts in my analysis.

Why We Loaded $MSTR at $169 (5:1 Risk/Reward to $355)Have you ever watched a stock pull back 65% and wondered if it was opportunity or disaster?
Have you ever missed a major setup because fear told you to stay away?
This analysis breaks down why NASDAQ:MSTR at $169 presented a textbook geometric retracement opportunity with exceptional risk/reward asymmetry.
Hello ✌️
Spend 3 minutes ⏰ reading this educational breakdown of structure-based position entry.
🎯 Analytical Insight on MSTR
MicroStrategy pulled back from $543 to $169 a 65% retracement that brought price directly into a major accumulation zone. This wasn't random. It aligned perfectly with:
Fibonacci retracement from 2020 lows to 2024 highs
A long-term ascending trendline dating back to 2020
The monthly $112 support zone that held as a floor
Our position entry: $169
Our invalidation level: $131.80 (below structure)
Our first target: $360 (previous resistance zone)
Risk: $37.20 per share
Reward: $191 per share
Ratio: 5.13:1
This setup didn't require predicting the future. It required identifying where risk was defined and reward was probable based on historical price structure.
📚 Educational Section: Why Geometric Retracements Work
The Psychology of Pullbacks
When price drops 65%, most traders experience:
Fear that it will continue falling forever
Doubt about whether the trend is still valid
Paralysis from watching others panic sell
Professional traders see the same chart differently:
Defined risk at structural support
Historical patterns of mean reversion
Favorable asymmetry when risk is small relative to potential reward
The majority fears what professionals buy.
📉 Understanding Market Structure
Markets don't move in straight lines. They:
Trend in one direction (impulse)
Retrace to gather liquidity (correction)
Resume the primary direction (continuation)
The 0.618 to 0.786 retracement zone historically shows the highest probability of reversal in trending assets. Why?
Early sellers have exhausted
Value buyers recognize the discount
Risk can be defined tightly below support
At $169, MSTR offered:
Clear invalidation below $131.80
Multiple timeframe confluence
Structural support from prior consolidation
🎯 Why This Entry Made Sense
Risk Was Defined
Below $169, the next logical support was $131.80. If price broke below that level, the bullish structure would be invalidated. This gave us a clear exit point before entering.
Reward Was Probable
The previous resistance zone at $360 represented a 113% gain from entry. Even a conservative 50% retracement would target $220+, still offering excellent reward.
Structure Aligned
Monthly support held
Trendline from 2020 intact
Retracement zone tested multiple times
Volume showed exhaustion, not acceleration
📊 Tools Used for This Analysis
Fibonacci Retracement
Identified the 0.786 level as a deep pullback zone where buyers historically step in.
Trendline Analysis
The ascending line from 2020 provided dynamic support that price respected.
Volume Profile
Showed accumulation at lower levels with decreasing selling pressure.
Horizontal Support Zones
The $105-110 monthly level acted as a psychological floor, preventing further collapse.
Risk/Reward Calculator
Entry: $169
Stop: $131.80
Target: $360
Result: 5.13:1 asymmetry
🛡️ Risk Management Framework
Stop Loss Below Structure
Our stop at $131.80 was placed below the invalidation point. If price reached that level, our thesis would be wrong and we'd exit with controlled loss of $37.20 per share.
Position Sizing Based on Risk
With $37.20 risk per share, position size was calculated to risk only 1-2% of total capital. This meant even if wrong, the account remained intact.
Target Based on Structure, Not Hope
$360 wasn't arbitrary. It represented previous resistance where sellers had historically appeared. We planned to reduce exposure at that level.
🧠 Trader Psychology: Why Most Miss These Setups
Fear of Catching a Falling Knife
After a 65% drop, the brain assumes it will continue. But without defined support, there's no knife just falling into the void. At $169, support was visible and the stop at $131.80 was clear.
Recency Bias
The most recent price action (the drop) feels like it will continue forever. Historical structure suggests otherwise, but emotions overpower data.
Herd Mentality
When everyone is bearish, contrarian positions feel uncomfortable. But the best risk/reward setups rarely have crowd consensus.
Waiting for Confirmation
Many traders wait for price to "prove" itself by moving higher first. By then, risk has expanded and reward has diminished. Entry at $169 with $37.20 risk is superior to entry at $250 with $118.20 risk to the same stop level.
📌 Proper Entry Execution
We didn't enter the entire position at once:
First third at $169 (initial position)
Second third at $155 if support retested (average down if structure held)
Final third reserved if $140 tested (closer to stop but maximum opportunity)
This scaling approach:
Reduced emotional pressure
Improved average entry if structure tested
Maintained discipline through volatility
🏆 What Professionals Do Differently
They Don't Chase Momentum
Entry at $543 (the top) felt safe because price was rising. Entry at $169 felt dangerous because price was falling. Professionals understand that perceived safety is often maximum risk.
They Define Risk First
Before asking "how much can I make," they ask "how much can I lose." The $131.80 level answered that question clearly.
They Accept Being Wrong
If MSTR broke $131.80, the position would be exited without hesitation. No hoping, no averaging down into a broken structure. Wrong is wrong.
They Journal Every Decision
Entry logic, risk parameters, and target zones were documented before entry. This removes emotion from exit decisions later.
🎯 Key Takeaways
✅ Risk/reward asymmetry matters more than being right: A 5:1 setup allows you to be wrong multiple times and still profit overall if position sizing is consistent.
✅ Structure defines opportunity: Random entries have random outcomes. Entries at defined support with clear invalidation have statistical edges.
✅ Emotions are the enemy: When $169 felt scary, that was the signal. When $543 felt safe, that was the warning.
✅ Patience beats prediction: We didn't predict $169 was the bottom. We identified it as a zone where risk was small ($37.20) and reward was large ($191). That's enough.
⚠️ Important Disclaimers
This analysis is educational and reflects a specific position entry based on technical structure. It is not financial advice or a recommendation to buy or sell MSTR or any security.
Position entries, stop losses, and targets are shared for educational purposes to demonstrate risk management principles. Your risk tolerance, timeframe, and capital allocation should differ based on your individual circumstances.
Past price structure does not guarantee future performance. MSTR could have broken $131.80 and invalidated this setup entirely, resulting in a controlled loss. Not all setups work, which is why risk management exists.
Always conduct your own analysis, consider your risk tolerance, and consult with a financial professional before making investment decisions. All trading and investing involves risk of loss.
✨ Support This Content
If this breakdown helped you understand structure-based entries and risk management, leave a comment with your thoughts or questions. Your engagement helps us create more educational content like this.
📜 Do your own research. Manage your risk. Trade with discipline.

GBP/JPY: Mild Growth in the Short TermGBP/JPY is currently showing a mild uptrend, supported by both macroeconomic and technical factors. With expectations that the Fed will lower interest rates in the near future, the low-interest-rate environment is helping GBP strengthen against JPY. The Japanese yen remains weak due to BoJ's easing policy , providing an opportunity for GBP/JPY to continue its upward move.
On the H4 chart, GBP/JPY is following a steady uptrend, supported by a solid trendline. The Ichimoku cloud also supports this trend, with the price consistently staying above the cloud , reinforcing the upward momentum.
In the short term, if 205.50 holds, GBP/JPY could continue to target the 206.20–206.40 range. However, the strong resistance at 208.00 should be monitored if the price continues its upward move.
In summary, the mild uptrend is expected to persist in the short term, with opportunities to buy on slight corrections , but it's important to pay attention to key support and resistance levels.

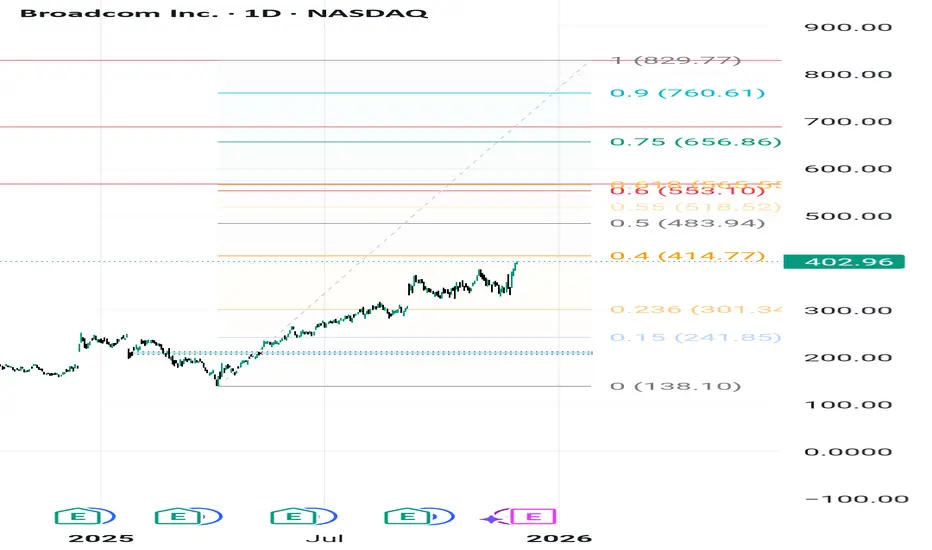
AVGO: Path to $829.77 – Navigating Critical Fibonacci Zones1. Overall Thesis and Price Structure
Broadcom Inc. (AVGO) exhibits a strong underlying bullish trend, fundamentally driven by demand for its AI chips and the successful integration of VMware. The technical objective targets a final high of $829.77. However, the path requires breaking through significant resistance levels defined by the Fibonacci structure. The current price is \mathbf{\$402.96}, maintaining the bullish momentum.
2. Crucial Resistance and Volatility Points
The analysis identifies two critical intermediate targets. The first and most significant hurdle is at $567.10, which aligns closely with the \mathbf{0.618} Fibonacci Golden Ratio. This zone is expected to trigger major volatility, profit-taking, and consolidation. The price action at $567.10 is the key test for trend continuity. Should the price break this level decisively, the next primary resistance target is $688.63, paving the way for the ultimate goal.
3. Key Support and Trend Invalidation
The long-term structural support, or the "Invalidation Point" for the bullish scenario, is the Key Zone at \mathbf{\$206.00}. As long as AVGO trades above this level, the multi-year uptrend remains valid. In the short term, the stock needs to overcome immediate resistance near $414.77 to gather momentum and continue its push towards the intermediate Fibonacci targets.
XAU/USD: Strong Uptrend, Ready to Break to New HighsHello traders! Today, we’ll analyze gold (XAU/USD), which is currently in a strong uptrend, and explore opportunities to capitalize on this momentum.
The latest news shows that gold has surged on November 26th, with the market anticipating that the Federal Reserve (Fed) might cut interest rates in December. Spot gold reached its highest level since mid-November, touching 4,170 USD/ounce. Factors such as mixed economic data from the U.S ., concerns about the labor market , and weakening consumer confidence have created a positive sentiment for gold.
From a technical analysis standpoint, the chart shows that XAU/USD is moving in a clear ascending wedge . The current price is near the support zone at 4,130 USD, with the potential for the uptrend to continue towards 4,240 USD if the price maintains its bullish momentum. Indicators like EMA 34 and EMA 89 both support the upward trend, reinforcing the potential for new highs.
Trading Strategy: Buy when the price adjusts to 4,130 USD and shows signs of reversal. The target for the uptrend could be 4,240 USD, and if the price breaks this level, we can expect gold to move towards 4,300 USD. A stop-loss can be placed around 4,120 USD to protect the account.
With positive market trends and technical support, gold is likely to continue its upward momentum in the near future. Stay updated and take advantage of this opportunity!

Unlocking Potential: Power Finance Corporation Analysis! 💼📈Traders, let's delve into Power Finance Corporation today ! 🌟 In the daily timeframe, we're witnessing a range-bound movement, with the price testing previous swing highs. 🔄 Anticipate a breakout above this level(red box), potentially targeting Rs. 450 and beyond. But before that it may come around at Rs.400 to go up further. PFC appears poised for bullish action! 🚀 Options traders, explore 400 CE or below 400 CE options with ample liquidity. Let's capitalize on this opportunity! 💼📊
Thank you. See you again in the next post!
Best regards,
Alpha Trading Station

EURAUD: Bearish Outlook Explained 🇪🇺🇦🇺
There is a high chance that EURAUD will continue falling next week.
A bearish breakout of a support line of a rising wedge pattern
suggests a strong bearish sentiment.
Expect a fall at least to 1.765
❤️Please, support my work with like, thank you!❤️
I am part of Trade Nation's Influencer program and receive a monthly fee for using their TradingView charts in my analysis.

Top 4 Price Action Signals For Beginners. Forex, Gold Trading
I will reveal 4 accurate price action signals that even a newbie trader will manage to easily recognize.
Watch carefully because these signals alone will help you to make a lot of money trading Forex, Gold or any other financial market.
Change of Character
Change of character is a strong signal that indicates a trend violation and a highly probable market reversal.
In a bearish trend, the change of character will be a bullish violation of the level of the last lower high.
Check how the change of character accurately indicated a bullish reversal on EURJPY pair.
In a bullish trend, a bearish violation of the level of the last higher low will signify a change of character and a highly probable bearish reversal.
Bearish violation of the last higher low level and a change of character on USDJPY gave a perfect bearish signal.
Breakout of Consolidation
No matter what time frame you trader, you probably noticed that quite often the markets become weak and start consolidating .
Most of the time, the prices tend to consolidate within horizontal ranges.
Breakout of one of the boundaries of the range can give you a strong trading signal.
Check how the price acted on GBPCHF.
The breakout of the support/resistance of the range always gave an accurate signal, no matter what was the preceding direction of the market.
Trend Line Breakout of a Pattern
There are a lot of trend line based bullish and bearish price action patterns: the ranges, the wedges, the triangles, the channels.
What unites these patterns is that the violation of the trend line of the pattern gives a strong trading signal.
A bullish breakout of a resistance line of a falling wedge, a bullish flag and a symmetrical triangle will give us a strong bullish signal.
Just look how EURUSD bounced after a bullish breakout of a resistance line of a falling wedge pattern.
While a bearish breakout of a support line of a rising wedge, a bearish flag or a symmetrical triangle will indicate a highly probable bearish continuation
Here is how a bearish breakout of the support of a symmetrical triangle formation helped me to predict a bearish movement on Gold.
Neckline breakout of a horizontal pattern
There are a lot of different price action patterns.
One element that unites many of them is the so-called horizontal neckline.
In bearish price action patterns like double top, head and shoulders, descending triangle, triple top, etc. a horizontal neckline represents a support from where buyers are placing their orders.
Bearish violation of such a neckline will be considered to be an important sign of strength of the sellers and a strong bearish signal.
In bullish price action patterns like double bottom, inverted head and shoulders pattern, ascending triangle, cup & handle, etc. a horizontal neckline represents a resistance where sellers a placing their orders.
Its bullish violation will a strong bullish signal.
Below is a perfect example how a bullish breakout of a neckline of an inverted head and shoulders pattern on Bitcoin triggered a strong bullish rally.
Here is how a breakout of a neckline of a double top on USDCAD confirmed an initiation of a bearish correctional movement.
The most important thing about these price action signals is that it is very simple to recognize them. You should learn the basic price action rules and a couple of classic price action patterns, it will be more than enough for you to identify confirmed bullish and bearish reversals on any time frame and any trading instrument.
❤️Please, support my work with like, thank you!❤️
I am part of Trade Nation's Influencer program and receive a monthly fee for using their TradingView charts in my analysis.

1 Test – 2 Breaks” in Gold: How It WorksIn the gold market, there’s a price behavior pattern that professional traders always pay attention to: “1 test – 2 breaks”.
This is not a lucky pattern or a coincidence — it is a repeating market behavior driven by liquidity, psychology, and institutional order flow.
Once you understand this rule, you’ll read gold’s movement far more clearly, especially during volatile phases.
1. What does “1 test – 2 breaks” actually mean?
This rule describes how gold typically reacts when it approaches a major support or resistance zone:
First time:
Price tests the level and rejects strongly.
Traders think the zone is “solid”.
Second time:
Price returns but reacts weaker.
This is where the market is collecting liquidity.
Third time:
The level gets broken decisively, starting a strong move in the breakout direction.
In short:
Gold respects the level the first time, tricks traders the second time, and breaks for real on the third.
2. Why does gold follow this rule so often?
Not random.
There are three core reasons:
2.1. Gold has extremely high liquidity
Gold (XAUUSD) is one of the most liquid assets in the world.
Institutions dominate
Volatility is high
Price often seeks stop-loss zones
This makes support/resistance areas get tested multiple times before the real break.
2.2. Retail traders believe too much in “strong levels”
Retail traders tend to:
Buy at support
Sell at resistance
Place SLs below/above obvious levels
Result?
Market makers know exactly where liquidity clusters are , so they push price to test those zones multiple times before the real move.
2.3. Institutions need liquidity to build large positions
Big players can’t:
Buy directly at the bottom
Sell directly at the top
They need price to revisit the zone to gather liquidity → then break it decisively.
The “1 test – 2 breaks” pattern reflects this institutional flow perfectly.
3. How to apply this rule in gold trading
(1) Don’t enter on the first test
The first reaction is strong but often not sustainable .
Avoid FOMO — just observe.
(2) The second test reveals the market’s intention
If the second reaction is:
Weaker
Low momentum
Weak rejection wicks
Lack of strong buyers/sellers
→ It likely indicates liquidity harvesting.
(3) The third approach is where the breakout often happens
If price comes back the third time with:
Faster momentum
No higher highs / lower lows
No clear rejection
Clean, steady approach
→ It’s a strong sign the zone is about to be broken cleanly .
You can then look for breakout entries or retest entries.
4. Important notes
Don’t apply this rule mechanically
Only use it on significant zones, especially on H1 and H4
Confirm with momentum or volume
Avoid using it during high-impact news (NFP, CPI, FOMC…)
5. Conclusion: Gold doesn’t move randomly — it repeats behavior
The “1 test – 2 breaks” rule works because:
Institutions need liquidity
Retail SLs cluster at predictable spots
Gold’s volatility + liquidity amplify the pattern
Recognizing this gives you:
Fewer premature entries
Fewer SL hunts
More confidence during real breakouts

Gold: Safe-Haven Demand Surges After Venezuela TensionsHey Traders,
In the coming week we are monitoring XAUUSD for a potential buying opportunity around the 4,195 zone. Gold remains in a clear uptrend, and the current correction is guiding price back toward a major support-and-trendline confluence, where buyers have consistently defended the structure.
On the fundamental side, safe-haven flows are heating up again.
Following Trump’s announcement that a land operation against Venezuela is expected to begin soon, markets quickly shifted into risk-off mode. Geopolitical uncertainty has historically driven capital toward traditional havens — and Gold often reacts first.
If tensions continue to escalate, the 4,195 zone could become the launchpad for the next bullish extension, with sentiment strongly supporting upside.
Trade safe,
Joe

AUDUSD Breakout and Potential RetraceHey Traders, in the coming week we are monitoring AUDUSD for a buying opportunity around 0.65400 zone, AUDUSD was trading in a downtrend and successfully managed to break it out. Currently is in a correction phase in which it is approaching the retrace area at 0.65400 support and resistance area.
Trade safe, Joe.

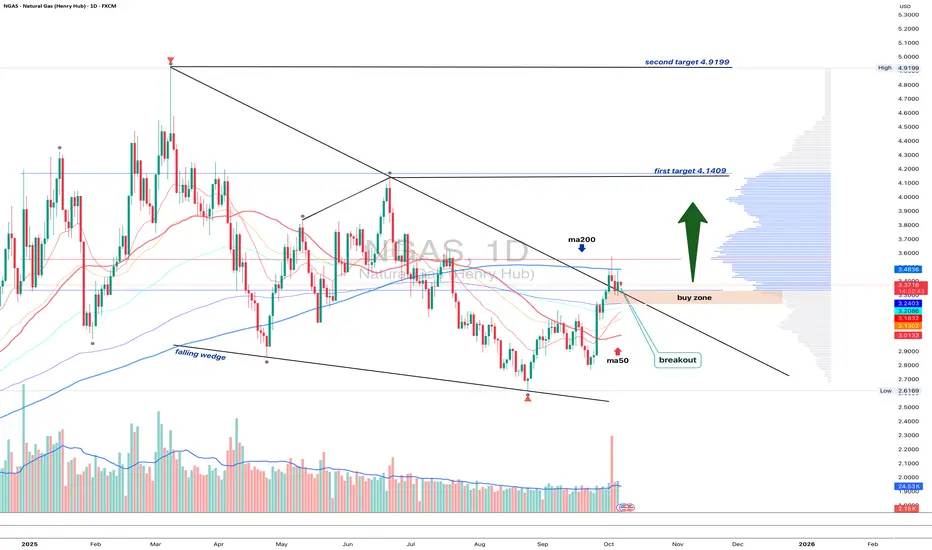
NGAS 1D - bulls waiting for the green lightOn the daily chart, Natural Gas has broken out of a falling wedge, but price remains below the MA200, while EMA still hovers above it - a mixed signal showing short-term hesitation within a longer-term downtrend.
The 3.10–3.20 buy zone remains key - that’s where the retest area aligns with short-term support. If buyers can reclaim the EMA and push above the MA200, the next upside targets are 4.14 and then 4.92.
Volume on the breakout supports growing bullish interest, while fundamentals - like rising seasonal demand - may soon add more fuel to the move.
Tactically , watch how price behaves near MA200. Once EMA flips back on top, momentum could accelerate fast. Until then, the market’s like a gas burner waiting for that click - ignition pending