EURGBP: Bullish Move From Trend Line 🇪🇺🇬🇧
EURGBP will likely rise after a test of a major rising trend line on a daily.
A formation of a bullish imbalance candle on an hourly time frame
provides a strong confirmation.
I expect a pullback at least to 0.8749
❤️Please, support my work with like, thank you!❤️
I am part of Trade Nation's Influencer program and receive a monthly fee for using their TradingView charts in my analysis.
Technical Analysis

EURGBP – Bearish Momentum Approaching Reversal Zone📊 EURGBP – H1 Market Structure, Supply Breakdown & Volume-Based Reversal Setup
🔍 Technical Analysis
EURGBP on the 1-hour timeframe is currently trading in a clear bearish environment. The pair has transitioned from consolidation into a strong impulsive sell-off, signaling increasing dominance from sellers. The chart highlights a key breakdown from supply, followed by aggressive momentum toward a high-interest demand area.
📉 Market Structure & Momentum
Price respected a descending structure, forming lower highs and lower lows.
A previous internal consolidation range failed to hold, confirming bearish continuation.
The sharp bearish candles reflect strong order flow imbalance, suggesting institutional participation rather than retail-driven movement.
🟥 Broken Supply (BR Supply)
The marked BR Supply level acted as a strong resistance in the past.
Once price broke below this level, it confirmed a market structure break (MSB).
After the breakdown, price used this area as a distribution zone, accelerating further downside.
This validates the level as a key decision point in the trend.
🟩 Demand Zone with Volume Burst (Lower Area)
The lower green zone represents a high-probability demand and volume burst area.
Historically, this zone shows strong buying reactions, indicating accumulation.
The presence of a Volume Burst suggests liquidity absorption and potential exhaustion of sellers.
This is a zone where reversal or corrective pullback becomes technically valid.
🔄 Reversal Zone & Pattern Expectation
The highlighted Reversal Zone is not a blind entry area.
A clear bullish pattern must form (e.g., strong rejection wicks, bullish engulfing, or shift in structure).
Without confirmation, price may continue lower due to prevailing bearish pressure.
The annotation “Pattern Must” emphasizes confirmation over anticipation.
🧠 Trading Scenarios
Scenario 1 – Bullish Reaction (Corrective Move):
If buyers step in with volume confirmation, price may react upward toward broken structure.
This move would likely be a pullback within a broader bearish trend, not an immediate trend reversal.
Scenario 2 – Bearish Continuation:
Failure to hold the demand zone could lead to continued downside, targeting deeper liquidity pools.
Strong bearish closes below the zone invalidate reversal expectations.
📌 Key Levels to Watch
Resistance: Broken Supply / Prior Structure
Support: Volume Burst Demand & Reversal Zone
Bias: Bearish overall, cautious bullish reaction only with confirmation
💡 Trading Insight
Trend is bearish; counter-trend trades require patience and confirmation.
Volume behavior at key zones gives better insight than indicators alone.
Trade reaction, not prediction.

EURUSD H1 – Institutional Volume Zones & Reversal Setup📊 EURUSD – H1 Market Structure & Volume-Based Reversal Analysis
🔍 Technical Analysis
EURUSD on the 1-hour timeframe shows a corrective phase after a prior bearish move. Price previously experienced aggressive selling pressure, followed by consolidation and a gradual recovery. The chart highlights key volume reaction zones that are now playing a decisive role in short-term direction.
📉 Previous Price Action
The left side of the chart shows strong bearish momentum, characterized by long red candles and impulsive downside moves.
This selling phase ended with capitulation-style candles, indicating exhaustion of sellers.
After the sell-off, price transitioned into a range-bound structure, forming higher lows and absorbing liquidity.
🟩 Demand Zone & Volume Burst (Lower Area)
The lower green zone represents a high-volume demand area.
Multiple rejections from this zone confirm institutional buying interest.
Volume bursts at this level indicate absorption of sell orders, often seen before a directional move.
This zone acted as a base for the current bullish push, validating it as a strong short-term support.
📈 Bullish Reaction & Structural Shift
Price broke above internal consolidation highs, signaling a short-term bullish structure shift.
Higher highs and higher lows suggest buyers are currently in control.
The bullish candles show improving momentum, but price is now approaching a critical area.
🟥 Supply / Reversal Zone (Upper Area)
The upper marked zone is a potential reversal and supply area, aligned with:
Previous price imbalance
Prior rejection zone
Expected volume expansion (Volume Burst)
This area is likely to attract profit-taking and fresh sell orders.
The highlighted circle marks a reaction point, where price may show:
Rejection wicks
Slowing momentum
Bearish candle formations
🔄 Expected Scenarios
Scenario 1 – Bearish Rejection (High Probability):
If price shows rejection within the upper zone, a pullback toward the demand zone is likely.
This would be a healthy retracement within the current structure.
Scenario 2 – Bullish Continuation:
A strong break and close above the reversal zone with volume would invalidate the short-term sell bias.
This could open the door for trend continuation toward higher liquidity levels.
🧠 Trading Insight
Avoid chasing price inside premium areas.
Best opportunities come from reaction, not prediction.
Watch for volume behavior and candle confirmation at the highlighted zones.
📌 Key Levels to Watch
Support: Lower Volume Burst / Demand Zone
Resistance: Upper Reversal & Volume Expansion Zone
Bias: Neutral to bearish at resistance, bullish only on clean breakout
💬 Always wait for confirmation. Volume + structure gives clarity, not indicators alone.

USDJPY Approaches Key Reversal Zone After Strong Bullish Impulse📊 USDJPY – 1H Timeframe | Detailed Market Structure & Reversal Zone Analysis
This chart shows U.S. Dollar / Japanese Yen (USDJPY) on the 1-hour timeframe, highlighting a strong bullish expansion followed by price approaching a critical reversal zone, where traders should shift from chasing momentum to waiting for confirmation.
🔹 Higher-Timeframe Context & Trend
USDJPY has been in a clear bullish trend, supported by strong momentum and higher highs. The move started after a period of consolidation and compression, where price formed a contracting structure (triangle / coil). This compression phase often acts like a spring, storing energy before a directional breakout.
Once the structure broke, price delivered a sharp impulsive rally, confirming bullish dominance and aggressive participation from buyers.
🔹 Impulse Move & Market Strength
The vertical bullish move is clean and decisive:
Large bullish candles with minimal pullbacks
Strong acceptance above previous highs
Indicates trend acceleration, not random volatility
This kind of move usually leads price toward premium zones, where smart money begins managing positions rather than initiating new buys.
🔹 Reversal Zone (Key Supply Area)
The highlighted blue zone near the highs is marked as a “Reversal Zone”, which is a critical area to monitor:
It aligns with a premium price area
Potential supply and profit-taking zone
Often attracts counter-trend traders and institutional distribution
Price entering this zone does not automatically mean a sell. The chart clearly emphasizes “Need Pattern”, meaning confirmation is required before considering short positions.
🔹 Price Action Expectations
Two main scenarios are possible from this zone:
1️⃣ Bearish Rejection Scenario
Price forms bearish patterns (pin bar, engulfing, lower high)
Momentum weakens
Leads to a corrective pullback toward lower support levels
2️⃣ Bullish Continuation Scenario
Price consolidates inside the zone
Breaks above with strong volume
Continues the uptrend after a brief pause
The drawn projection reflects both possibilities, reminding traders to react, not predict.
🔹 Trading Psychology & Risk Management
This is a decision-making zone, not an entry-by-emotion area:
Avoid FOMO buys at highs
Wait for structure or candle confirmation
Trade only when the market gives clarity
Professional traders focus on confirmation + location, and this chart highlights both perfectly.
🧠 Final Thoughts
Overall bias: Bullish, but cautious near highs
Key focus: Reversal zone reaction
Best approach: Wait for price action confirmation
Invalid idea: Strong bullish acceptance above the zone
This setup is ideal for traders who value patience, structure, and clean price action, making it suitable for both intraday and short-term swing strategies.

BTCUSDT Break of Structure & Clean Retest – Bullish Continuation📊 Bitcoin (BTCUSDT) – 1H Timeframe | Detailed Price Action & Market Structure Analysis
This chart represents Bitcoin / TetherUS Perpetual (BTCUSDT) on the 1-hour timeframe, focusing on market structure shift, breakout confirmation, and retest logic, which are key concepts in professional price action and smart money trading.
🔹 Overall Market Structure
Bitcoin was previously moving in a choppy and corrective structure, showing mixed momentum with sharp bullish and bearish swings. This type of behavior often indicates liquidity grabs and accumulation, especially near key support levels.
As price stabilized, BTC formed a higher low, signaling a potential trend shift from bearish to bullish.
🔹 Major Breakout Level
The chart clearly marks a “Major Break” level, which acted as a strong resistance zone in the past. Price finally broke above this level with strong bullish candles, indicating:
A break of structure (BOS)
Increased buyer dominance
Acceptance above a key resistance
This breakout is critical because it confirms bullish intent in the market.
🔹 Retest Zone (Support Flip)
After the breakout, price pulled back into the highlighted blue zone, labeled as “Retesting”. This area now acts as:
Previous resistance turned support
A high-probability buy-on-dip zone
A zone where institutions may re-enter long positions
Price respecting this zone strengthens the idea that the breakout is valid, not a fake move.
🔹 Price Action Behavior
Within the retest zone, price shows:
Strong bullish rejections
Small-bodied candles followed by expansion
Gradual upward pressure
This suggests buyers are absorbing sell orders, preparing for the next impulsive move.
🔹 Bullish Projection & Targets
The projected path on the chart shows:
Continuation after a successful retest
Higher highs forming above the recent structure
Momentum aiming toward 90,800 – 91,600 and potentially higher if volume supports
As long as price holds above the retest zone, the bullish bias remains intact.
🔹 Trading Psychology & Strategy Insight
This setup aligns with a classic Break → Retest → Continuation model:
Avoid chasing the breakout
Wait for price to return to value
Enter trades with better risk-to-reward
Discipline and patience are key here.
🧠 Fin al Thoughts
Market bias: Bullish
Key confirmation: Hold above retest zone
Invalidation: Strong close below the support zone
Best approach: Confirmation-based buys
This chart reflects clean technical structure, making it suitable for both intraday and short-term swing traders.

Gold (XAUUSD) Bullish Continuation After Demand Zone Retest📊 Gold (XAUUSD) – 30-Minute Chart | Detailed Technical Analysis
This chart shows Gold Spot / U.S. Dollar (XAUUSD) on the 30-minute timeframe, and it highlights a very important phase of post-impulse consolidation and potential continuation.
🔹 Market Structure Overview
Gold has recently shown strong bullish momentum, visible through a sequence of large bullish candles with expanding bodies. This impulsive move suggests strong institutional participation, confirmed by the volume burst marked on the chart.
After this aggressive rally, price entered a corrective phase, forming a short-term pullback with smaller bearish candles. This behavior is healthy and typical after a strong push, indicating profit-taking rather than trend reversal.
🔹 Key Zone: Demand / Support Area
The highlighted green zone represents a demand area, created after the strong bullish expansion. This zone is important because:
It aligns with the origin of the impulsive move
It shows high trading volume, signaling strong buying interest
Price is expected to retest this area before continuation
The chart clearly labels this phase as “Retesting”, which means price may dip into this zone to absorb liquidity and attract buyers.
🔹 Price Action & Pattern Expectations
At the moment, price is hovering above the demand zone, but the idea emphasizes:
Patience is required
A clear bullish pattern (such as bullish engulfing, pin bar, or strong rejection) should form inside or near the zone
Only after confirmation, buy-side opportunities become valid
The note “Need Pattern And Buy Side” reinforces the importance of waiting for price action confirmation, not blindly entering trades.
🔹 Bullish Projection
The upward arrow drawn on the chart represents a bullish continuation scenario:
After a successful retest
Followed by strong bullish confirmation
Price may resume its upward trajectory toward higher resistance levels
This projection aligns with the overall bullish market structure unless the demand zone is clearly broken with strong bearish volume.
🔹 Trading Psychology Insight
This setup favors smart money logic:
Impulse → Pullback → Retest → Continuation
Traders who wait for confirmation inside high-probability zones often achieve better risk-to-reward trades and avoid emotional entries.
🧠 Final Thoughts
Trend bias: Bullish
Key focus: Demand zone retest
Entry style: Confirmation-based buying
Risk management: Essential if demand zone fails
This chart represents a professional, rule-based trading idea, emphasizing patience, structure, and volume rather than aggressive chasing.

Chumtrades XAUUSD ATH Is Not a Reason to ShortMacro bias:
US CPI cooled, while expectations for Fed easing in 2026 remain intact. Japanese bond yields surged, signaling capital rotation away from speculative assets and into safe havens like gold. The macro backdrop continues to support gold.
Structure:
Gold has broken above ATH, with the previous high around 438x now acting as support. Short-term high is forming near 4420. The uptrend remains dominant on H1 & M30.
Bias:
👉 Prefer BUYs in line with the trend
❌ Avoid FOMO chasing
⚠️ SELL only for short-term scalps after lower-timeframe structure breaks
BUY zones:
438x (previous ATH)
4350–4353
4336–4330
Invalidation:
A clear close below 4320 opens a move toward 4310 / 4300
In this case, the H1–M30 bullish structure is invalidated
Risk note:
Momentum is very steep → sudden pullbacks are possible. Manage risk tightly and focus on buying at key zones, not emotions.

Gold Is Building the Base for a Fresh ATH — Macro Is the FuelXAUUSD – H1 | Technical
Technical Structure
Gold is holding above former resistance, now acting as support — a classic post-breakout consolidation.
Higher lows remain intact, momentum structure is bullish.
Price is compressing just below old ATH, signaling acceptance at high levels, not rejection.
Macro Drivers Supporting a New ATH
US Dollar weakness: Expectations of rate cuts and slowing US growth continue to pressure USD.
Falling real yields: This directly supports gold as a non-yielding asset.
Central bank demand: Ongoing accumulation from global central banks keeps long-term demand strong.
Geopolitical & macro uncertainty: Sustains safe-haven flows into gold.
Scenario Outlook
Primary: Short consolidation → breakout → New ATH expansion.
Pullbacks: Any retracement toward previous breakout levels is likely buy-the-dip, not trend reversal.
Bottom Line
Gold is not chasing highs it is building value above resistance.
With macro conditions aligned, the probability favors a clean breakout into a new all-time high rather than a major correction.

XAUUSD Bullish Continuation SetupXAUUSD – H1 Timeframe Bullish Analysis
Overall Trend
XAUUSD is respecting a bullish trendline, which confirms that the market is still in an uptrend.
Price is forming higher lows, indicating that buyers are in control of the market.
As long as the bullish trendline holds, the market bias remains bullish.
Demand Zone
The confluence of the demand zone and the bullish trendline strengthens the probability of upward continuation.
Buyers are likely to defend this zone.
Triangle Pattern
Price is forming a symmetrical / ascending triangle.
This pattern usually acts as a continuation pattern in an uptrend.
Price compression inside the triangle indicates that a strong breakout is likely.
Breakout Expectation
A clean H1 candle close above the triangle resistance will confirm a bullish breakout.
After the breakout, price is expected to move toward the next all-time high (ATH) at 4420.
MACD Indicator
MACD is showing bullish momentum stabilization.
The contraction of the histogram suggests that momentum is building and an expansion may follow soon.
A bullish MACD crossover or expansion above the zero line will further support the upside move.
Trade Plan (Bullish)
Buy Entry: now 4327 or after the triangle breakout.
Stop Loss: 4305
Take Profit:
TP1: Previous high 4355
TP2: Next resistance 4390
Final Target: ATH 4420
Disclaimer
This chart is for educational purposes only and does not constitute financial advice. Trading involves high risk; always conduct your own research and use proper risk management.

Ethereum Is Resetting — Not Breaking DownEthereum on the daily timeframe is still trading within a broader corrective structure, with price rotating between a clearly defined support zone around the mid-2,700s and a heavy resistance area overhead. The recent pullback into support shows slowing downside momentum, suggesting that selling pressure is being absorbed rather than aggressively expanded. This zone has historically attracted demand, making the current move more consistent with a technical reset than a continuation of the broader downtrend.
From a structural perspective, ETH is attempting to stabilize after a prolonged decline, and the reaction from support will be critical. As long as this demand zone holds, the downside remains corrective in nature, opening the door for a recovery move back toward the upper resistance zone. A sustained push higher would signal that buyers are regaining control and could initiate a larger mean-reversion rally within the higher-timeframe range.
From a macro standpoint, Ethereum’s behavior aligns with the broader crypto market environment, where risk assets remain sensitive to liquidity conditions and expectations around U.S. monetary policy. With no decisive tightening shock and ETF-related narratives still providing long-term support to the crypto space, deep downside continuation lacks strong macro confirmation. However, the absence of aggressive liquidity expansion also explains why upside remains corrective rather than impulsive at this stage.
In this context, ETH is in a decision zone. Holding support keeps the recovery scenario valid and favors a move back toward resistance, while a clean breakdown would reopen downside risk. Until price leaves this range with conviction, patience remains the edge the trade appears only when structure and macro align with clear intent.

ETH Isn’t Breaking Yet — It’s Compressing Power Inside the RangeETH/USD – 1H Quick Analysis
Ethereum is trading inside a clearly defined sideways range, with price repeatedly rejecting the upper resistance zone (~3,000–3,020) while holding above the support zone (~2,780–2,820). The sharp sell-offs inside the box have been fully absorbed, followed by aggressive rebounds — a classic sign of range accumulation, not distribution.
The recent push back toward resistance shows buyers are still active, but lack of acceptance above resistance confirms sellers remain in control at the highs. As long as ETH stays inside this range, price is likely to continue rotating between support and resistance, building liquidity on both sides.
Key Levels
Resistance: 3,000–3,020
Support: 2,780–2,820
Outlook
Acceptance above resistance → expansion toward 3,080–3,120
Rejection → continuation of range rotation
Bottom Line
This is a wait-for-break structure.
The real move starts only when ETH leaves the range with conviction.

Gold Is Not Trending. It’s Deciding.GOLD (XAUUSD) – 1H TECHNICAL & MACRO ANALYSIS
Market Structure (Technical)
- Gold remains in a clear short-term uptrend, still trading above both EMA 34 and EMA 89, confirming bullish structure has not been broken.
- Price is currently consolidating below Target 1 (~4348) after a sharp impulsive move, which is typical bullish digestion, not distribution.
- The recent pullback respected the weak support zone around 4313–4320, aligning closely with EMA 89 → this indicates buyers are still defending dips.
- As long as price holds above the strong support zone (~4270–4280), the broader bullish structure remains intact.
Key Levels
Resistance / Target 1: ~4348
Target 2 (Old ATH): ~4380
Weak Support: ~4313–4320
Strong Support: ~4270–4280
Scenarios
Primary (Bullish continuation – higher probability):
Sideways consolidation → higher low → break above 4348 → extension toward 4380 (old ATH) and potential new ATH.
Alternative (Deeper pullback, still bullish):
Loss of weak support → retrace into strong support → liquidity grab → continuation higher.
CONCLUSION
Gold is not rejecting resistance it is absorbing liquidity below it.
This price behavior, combined with a supportive macro backdrop, strongly favors a continuation move toward the old ATH and beyond, rather than a trend reversal.

AUDUSD Pressured by the Trendline – Chasing BUYs Is Very RiskyOn the H4 timeframe, AUDUSD presents a very clear technical picture: the primary trend remains bearish / sideways-dow n , and the current upswing is more of a technical pullback into supply rather than a genuine trend reversal.
On the chart, price is being pressed down by a descending trendline drawn from prior highs. The zone around 0.6639–0.6640 acts as a key confluence resistance, aligning with the descending trendline and the Ichimoku / previous reaction area. This is the type of zone where price often tags, gets rejected, and reverses if buyers lack sufficient strength.
To the downside, 0.6600 stands as the nearest support and a logical downside target if rejection at resistance occurs. Therefore, in the short term, the high-probability scenario is: price rallies to test 0.6640 → gets sold → drops back toward 0.6600. Only if AUDUSD closes a strong H4 candle decisively above 0.6640 and holds above this level would there be a valid case for a broader bullish extension.
Wishing you disciplined and successful trading!

BTC Is Being Traded, Not TrendingBTC/USD – 1H Brief Analysis
Bitcoin is locked inside a high-liquidity range, where price repeatedly sweeps both highs and lows without follow-through. Sharp moves are quickly faded, confirming rotation and order flow balance, not trend continuation.
Price is currently oscillating around the mid-range and key EMAs, showing indecision rather than strength or weakness. As long as BTC remains inside this box, the market’s objective is simple: collect liquidity on both sides.
Key Read
No clean acceptance → no trend
Breakout attempts are being sold
Dips are being absorbed, not extended
Expectation
More range rotation and false breaks until price decisively exits the zone.
Bottom Line
This is a liquidity environment.
Direction becomes tradable only after the range is resolved.

ETH Is Quiet — But the Next Move Won’t BeETH/USD – H1 Technical Analysis
Market Structure:
ETH is currently consolidating after a strong rebound from the support zone. Price is compressing just below a key resistance area, indicating balance between buyers and sellers rather than trend continuation or breakdown.
Key Zones:
Immediate Resistance: The highlighted resistance zone above current price. This area has rejected price multiple times → supply remains active.
Support Zone: The lower green zone continues to hold firmly, confirming buyers are defending dips.
Price Behavior:
Sideways consolidation near resistance = absorption phase, not weakness.
No impulsive rejection yet → sellers are not in full control.
This structure often precedes volatility expansion.
Primary Scenario:
If ETH breaks and holds above the resistance zone with volume, upside continuation toward the next resistance cluster becomes likely.
Alternative Scenario:
A rejection from resistance could send price back to retest the support zone, where buyers are expected to re-enter.
Summary:
ETH is not trending it is loading liquidity. Patience is key. Wait for a confirmed breakout or a clean rejection before committing risk.

Gold Is Not at a Top — It’s Compressing Below HistoryGold continues to trade in a strong bullish structure on H4, with a clear sequence of higher lows confirming that buyers remain firmly in control. After the impulsive leg up, price is now consolidating directly below the previous highest high around 4,380 a textbook bullish consolidation rather than a distribution phase. This range-bound movement shows that selling pressure is being absorbed, not expanded, as pullbacks remain shallow and demand consistently steps in. As long as price holds above the higher-low base of the consolidation, the broader bias stays bullish, and this sideways action should be viewed as a buildup of pressure. A clean acceptance above the 4,380 resistance zone would likely trigger continuation toward a new ATH, while failure to break simply extends the consolidation, not invalidates the trend. This is a wait for expansion environment patience is the trade.

EUR/USD Is Sitting on the Edge — Bounce or Breakdown?EUR/USD – 1H
Price is holding at a well-defined support zone (~1.1700) after sustained selling pressure.
Momentum is weak, but selling is no longer aggressive → early stabilization.
Key Levels
Support: 1.1685–1.1705
Resistance: 1.1755–1.1765
Upside target (if bounce holds): 1.1800–1.1810
Scenario
Base case: support holds → corrective bounce toward resistance.
Failure scenario: clean break below support opens continuation lower.
Bottom Line
This is a decision zone, not a chase.
The move only becomes clear after price reacts at support.

ETH Is Done Falling — Now It’s Testing ConvictionETH/USD – 1H Quick Analysis
ETH has broken the descending trendline and reacted cleanly from the support zone, signaling downside exhaustion.
Price is now compressing below resistance, forming higher lows — a classic transition from sell pressure to balance.
Key Levels
Support: ~2,780–2,820 (buyers defended decisively)
Resistance: ~3,150–3,180 (key decision zone)
Outlook
Short-term: Consolidation / pullback is possible to build structure
Continuation: Acceptance above resistance = upside expansion
Failure: Rejection keeps ETH ranging, not bearish
Bottom Line
Trendline broken. Support held.
ETH is coiling direction comes at resistance.

Bitcoin Is Ranging — And Macro Is Keeping It That WayBitcoin on H1 remains locked inside a clearly defined range, with price oscillating between a defended support zone near the lower boundary and a heavy resistance band overhead. The sharp rejection from resistance confirms active sellers at the top, while repeated bounces from support show that buyers are still willing to defend the range. This back and forth price action reflects balance and liquidity building rather than trend continuation, with momentum paused after the prior impulsive move.
Structurally, BTC is showing overlapping candles and failed follow-through in both directions classic range behavior. As long as price remains capped below resistance, upside attempts are corrective, not impulsive. A rotation back toward the mid-to-lower range remains the higher-probability path unless acceptance above resistance is achieved with strength.
From a macro perspective, this consolidation aligns with a broader wait-and-see environment across risk assets. Markets are currently sensitive to U.S. macro data and expectations around Fed policy, with no clear catalyst pushing liquidity decisively risk-on or risk-off. This macro indecision is mirrored directly in Bitcoin’s price action, where volatility compresses and directional conviction fades.
In summary, Bitcoin is not breaking it is balancing. Until macro conditions and liquidity provide a clear push, BTC is likely to continue rotating within the range. The edge lies in patience: wait for a clean range resolution with intent, not anticipation.

Bitcoin Isn’t Trending — It’s Trapping TradersBTCUSD (H1) — Focused Market Analysis
Market Structure
BTC is clearly stuck in a range, with price repeatedly rejecting from the upper resistance zone and holding above a well-defined support zone.
No higher highs or lower lows → no trend, only balance.
Key Zones
Resistance Zone: ~89,800 – 90,200
Support Zone: ~84,800 – 85,200
Current Price: Trading near the mid-range → low R:R for breakout trades.
Moving Averages
Price is entangled with EMAs, confirming indecision and sideways conditions.
MAs are flat → momentum is neutral.
Price Behavior
Repeated liquidity sweeps at both extremes.
Dotted projection highlights a range-expansion cycle, not a trend.
Breakouts inside the range are likely fake moves.
Scenarios
Primary Scenario (High Probability):
Continued sideways oscillation between support and resistance.
Breakout Scenario (Only valid if):
Strong close above resistance with volume → opens upside continuation.
Breakdown below support → shifts market to bearish extension.
Summary
Bitcoin is not ready to trend.
Patience > prediction. Trade the range or wait for a confirmed breakout.

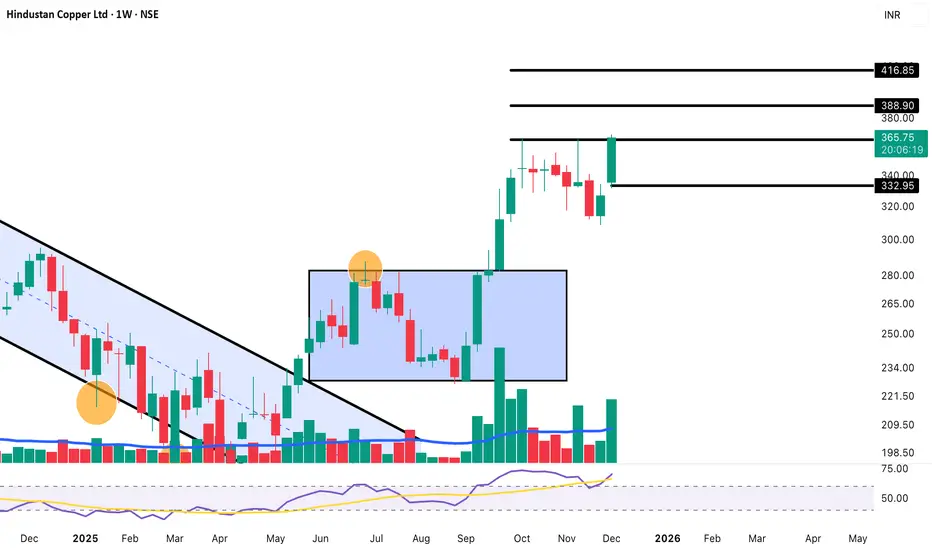
Hindustan Copper – Weekly Chart Analysis Professional Breakdown✔️ Buy Range
₹360 - ₹365
Or first green candle after pullback
🛑 Stop Loss
₹330 (Weekly SL)
🎯 Targets
T1 ₹388
T2 ₹402
T3 ₹416–₹420
T4 ₹450+ breakout possible
Disclaimer: For educational purposes only. Not SEBI registered.
Correction Is Not a Reversal — Gold Is Reloading 1. Market Structure Overview
- Gold is still trading within a medium-term bullish structure, but price has entered a short-term corrective phase after failing to hold above the upper resistance zone.
- Strong rejection occurred at the POC / resistance area 4.35x – 4.38x, confirming active profit-taking.
The current price action is developing a classic ABC correction:
- Wave A: Completed with a sharp pullback.
- Wave B: Ongoing technical rebound.
Importantly, price remains above the major moving averages, meaning the primary uptrend is still intact.
This correction is technical in nature, not a trend reversal.
2. Market Context & Liquidity Behavior
Sellers are active near the highs, but downside momentum remains controlled.
The market is likely seeking liquidity clearance before deciding the next impulsive move.
The 4.26x – 4.20x zone stands out as a key re-accumulation area where buyers may step back in.
3. Today’s Price Scenarios
🔹 Primary Scenario (High Probability)
Price continues its corrective leg toward 4.26x – 4.20x.
This zone acts as a decision point:
Holding above it → supports re-accumulation and trend continuation.
Strong breakdown → opens room for a deeper short-term correction.
🔹 Alternative Scenario (Lower Probability)
Failure to reclaim strength after the correction may extend downside pressure.
Confirmation only occurs if support is decisively broken with volume.
4. Intraday Trading Setups — Re-Accumulation Focus
📌 SETUP 1 – Intraday Sell (Correction Timing)
XAUUSD SELL ZONE: 4369 – 4372
Take Profit: 4366 – 4361
Stop Loss: 4376
📌 SETUP 2 – Intraday Buy (Re-Accumulation Zone)
XAUUSD BUY ZONE: 4262 – 4265
Take Profit: 4268 – 4273
Stop Loss: 4258
⚠️ Always apply strict risk management to protect capital.
5. Summary & Trading Guidance
Main Trend: Bullish
Short-Term State: Correction → Re-accumulation
Bias: Wait for price to reach key zones, avoid chasing highs
👉 Today’s session is a balancing phase. The market’s reaction at the support zone will define whether gold resumes its uptrend or extends the correction. Patience and discipline remain the optimal strategy.

EURUSD Is Trapped Below Resistance — Distribution Before....EURUSD – H1 MARKET ANALYSIS
1. Market Structure
EURUSD is currently trading within a short-term corrective structure after a strong impulsive decline. The recent rebound failed to break above the key resistance zone, confirming that sellers are still in control of the broader intraday trend.
Price action shows:
- A clear lower-high formation near the resistance zone.
- Weak bullish follow-through after each bounce.
- Compression around the mid-range, indicating distribution rather than accumulation.
2. Key Zones
- Resistance Zone: 1.1750 – 1.1760
This zone has rejected price multiple times, acting as a supply area where sellers aggressively defend.
- Support Zone: 1.1700 – 1.1710
This is the nearest liquidity pool and the first downside objective.
3. Price Behavior & Liquidity
The sharp rejection from resistance followed by sideways consolidation suggests that the market is absorbing buy orders before continuation lower. The lack of strong bullish candles confirms that the rebound is corrective, not impulsive.
This behavior typically precedes:
- A stop-hunt below short-term consolidation
- Continuation toward deeper liquidity zones
4. Scenario Outlook
🔽 Primary Scenario (Preferred): Bearish Continuation
Price fails to reclaim the resistance zone
Breakdown below intraday structure
Targets:
Target 1: 1.1720
Target 2: 1.1700
Target 3: 1.1685 (major liquidity draw)
🔼 Alternative Scenario
Only if price breaks and holds above 1.1760 with strong momentum, the bearish setup is invalidated, and a deeper recovery may unfold.
5. Trading Bias
Main Bias: Bearish
Market State: Distribution → Liquidity Grab
Strategy: Sell rallies near resistance, avoid chasing price in the middle of the range.
Conclusion
EURUSD is not building strength it is preparing for continuation. As long as price remains below the resistance zone, downside liquidity remains the dominant magnet. Patience and discipline are key; the market will reveal direction once liquidity is released.
