The 3 Pillars of Dow Theory – Break One and the Trend FailsMost traders hear about Dow Theory but don’t truly understand that:
A trend only truly exists when all three pillars agree.
Break just one pillar, and the “trend” you see on the chart may be nothing more than an illusion.
Here are the three “holy pillars” that determine every trend:
1. First Pillar: Price Trend – Price Action as the Foundation
Dow made it very clear:
“The market discounts everything.”
Meaning every piece of news, expectation, fear, and sentiment is already reflected in price action.
To identify the trend:
Uptrend when: Higher Highs – Higher Lows (HH–HL)
Downtrend when: Lower Highs – Lower Lows (LH–LL)
If there’s no HH–HL or LH–LL?
→ No trend exists.
→ Any buy/sell decision is basically guessing.
2. Second Pillar: Volume – The Confirmation of a “Real” Trend
A rising trend with weak volume → fake rally, pushed by “echoes,” not real money.
A falling trend with exhausted volume → high risk of an aggressive reversal.
Volume is the fingerprint of real capital flow.
Strong uptrend → volume must rise
Strong downtrend → volume must expand
Weak trend → volume gradually decreases → early reversal warning
If price moves one way but volume moves another → One of them is lying. And price usually ends up turning around.
3. Third Pillar: Inter-Market Confirmation – “No Market Moves Alone”
This is the part most traders ignore.
Dow believed:
A trend is only valid when confirmed from multiple perspectives.
In Dow’s era, this meant:
– Transportation Index
– Industrial Index
Today, we interpret it more broadly:
BTC rising? → Midcap altcoins or on-chain metrics must confirm.
SP500 rising? → Nasdaq or the Dow Jones should move in the same direction.
XAUUSD rising? → DXY or yields must show weakness.
If one index rises while its “siblings” stay flat or move opposite →The trend is unreliable.
WHY ALL 3 PILLARS MUST ALIGN
Think of a trend as a house:
- Price Action → the foundation
- Volume → the steel structure
- Cross-index confirmation → the supporting walls
Missing 1 element → the house stands, but very weakly.
Missing 2 → it collapses for sure.
Have all 3 → the trend becomes strong, durable, and hard to break.
Technical Analysis

BTC Bearish Continuation, Watching 95,000 for BreakdownBitcoin on the 1D chart remains locked in a clear bearish structure since the early-October peak near 125,000. Price is printing consistent lower highs and lower lows, now hovering around the 95,000 zone after a sharp sell-off. All three key moving averages (20, 60, 120) slope downward above price, with the 20-day already below the 60-day, while MACD is deeply negative and SQZMOM prints strong red bars — a classic backdrop for trend continuation, not reversal.
For now, 95,000 is the key demand zone. A decisive daily close below 94,000 would confirm fresh downside, opening the path toward 90,000 first and then the next bearish magnet around 88,000, with 85,000 as an extended target if momentum accelerates. In this view, any bounce into 102,000–108,000 is considered a potential selling opportunity while price stays below the early-November lower high, with 97,000–102,000 acting as a practical risk zone for invalidating short-term breakdown attempts.
The bullish alternative only gains traction if buyers can force a daily close back above 105,500, reclaiming the 20-day MA and squeezing shorts. That would put 112,500 and the 111,000–113,000 moving-average cluster back in play, with a larger shift in structure only confirmed if price eventually reclaims the prior lower high and then 115,000. Until then, the path of least resistance remains lower.
Thought of the Day 💡
Strong trends often punish counter-trend trades more than they reward bravery. Trade with the dominant flow, not against it.
This is a study, not financial advice. Manage risk and invalidations

XAUUSD: Bulls Are Ready to Break Out!Gold is showing a powerful comeback as both fundamentals and price action are shifting in favor of the bulls. Global investors are betting that the reopening of the U.S. government and the full release of economic data will pave the way for the Fed to cut interest rates next month. In an environment of economic uncertainty and rising expectations of monetary easing, gold naturally becomes a highly attractive safe haven.
On the chart, the uptrend remains clear as XAUUSD continues to trade steadily within its ascending channel. Recent pullbacks have been purely technical, not signs of a reversal. The nearby support around 4,090 is acting as a crucial launching zone. As long as price stays above this area, the bulls remain firmly in control.
In the short term, the next key target is 4,240, where the market will likely test the true strength of bullish momentum before deciding the next leg.
If you're waiting for a clear trend signal, gold is showing exactly that: the bullish pressure hasn’t stopped—every dip is simply creating another opportunity for buyers to step in.

BTCUSDT: short 98888.8If we exclude random pumps and dumps, the market is currently suspended in uncertainty.
BINANCE:BTCUSDT.P neither breaks below the 100,678.0 support level nor bounces back from it — it simply grinds sideways.
A clear local level has formed at 98,888.0, from which BTC has bounced twice in the past two days.
Now, the price is gradually moving toward it again, indicating a short-biased sentiment.
This lack of clarity in BTC’s behavior keeps the entire crypto market frozen.
The only movements come from baseless pumps and dumps, emerging and ending at random points.
However, I believe clarity is approaching — BTC cannot stay in this tension forever.
It will either break upward or fall lower.
My analysis suggests the next move will be down, and that’s when we’ll see the real market move.
For now — we wait.
___
System first:
Every non-systematic profit is bad.
Every non-systematic loss is bad.
Every systematic profit is good.
Every systematic loss is part of the work.
Was this analysis helpful? Leave your thoughts in the comments and follow to see more.

TKC – Multi-Year Inverse Head & Shoulders Formation PotentialA potential multi-year inverse Head & Shoulders structure appears to be developing on Turkcell’s U.S. ADR (TKC) monthly chart.
This is a slow-forming, long-cycle reversal pattern, so completion may take time even few years — also future dividend adjustments will naturally shift the historical price anchors on the ADR chart.
The neckline sits around the 8.00 USD area.
A monthly close above 8.00 would be the structural trigger confirming the reversal.
The measured move from head to neckline projects toward the 13.70 USD area.
This level also aligns with a major Fib confluence zone:
• 61.8% retracement of the 2007 high → 2022 low
• 78.6% retracement — both cluster between ~13–14 USD, reinforcing the significance of that target zone.
Invalidation sits below 4.22 USD.
A sustained move under this level would break the right-shoulder structure and negate the multi-year reversal thesis.
This setup is worth monitoring — high-timeframe reversals can be slow to complete, but meaningful when they do.
Macro note : This stock sensitive to Türkiye’s economical outlook.
Focus on the chart, not the headlines.
(Educational idea – not financial advice.)

XAU/USD | Gold Faces Pullback After Breaking $4200, What’s Next?By analyzing the #Gold chart on the 4-hour timeframe, we can see that after breaking above the $4200 resistance, the price continued to rise and reached $4244 before reacting negatively from the OTE zone, correcting down to $4184.
Gold is currently trading around $4195, with an FVG zone between $4141–$4181 that might get filled soon. There’s also a key demand area between $4098–$4125 to watch closely.
If gold manages to hold above $4181 without breaking below, we could see another strong bullish move toward $4269. Monitor price reactions carefully at all mentioned levels!
Please support me with your likes and comments to motivate me to share more analysis with you and share your opinion about the possible trend of this chart with me !
Best Regards , Arman Shaban

XAUUSD: 4H Order Block Re-test for LongKey Zone Identified: The 4H / OB (4-Hour Order Block):
An Order Block (OB) is a specific candlestick or candle group that market participants use to identify where large institutional orders were likely placed before a significant move. In this case, it appears to be a bullish order block identified on the 4-hour timeframe, which suggests strong institutional demand in that price range.
The price is currently re-entering this identified grey rectangular zone (the 4H / OB) near the 4,120.00 to 4,145.00 area (based on the price scale).
'X' Label: The label 'X' likely denotes a previous Swing High or a Break of Structure (BOS) point that the initial upward move surpassed, confirming bullish momentum.
The Trading Idea (Indicated by Arrows):
The setup anticipates a buy (long) trade to be initiated from within or around the 4H / OB zone.
The price is expected to bounce off this strong support area.
The projected move is an upward rally targeting the level marked as Target around the 4,180.00 price level.

NZDCHF: Bearish Trend Continues 🇳🇿🇨🇭
NZDCHF is trading in a long-term bearish trend.
A yesterday's breakout of a key daily support cluster
and a formation of a new lower low lower close suggest
a strong selling pressure.
The price is steadily recovering today, retesting a broken structure.
With a high probability, another bearish wave will start from that.
Next goal will be 0.4455
❤️Please, support my work with like, thank you!❤️

GBP/USD Set to Plunge: Rate Cut Pressure and Weak Data!Currently, the GBP/USD pair is under strong selling pressure following macroeconomic news from the UK. Weak GDP data of only 0.1% in Q3/2025 , along with the government's cancellation of the planned income tax hikes, has raised concerns about the financial stability of the UK economy. This has fueled expectations that the Bank of England (BoE) may be forced to cut interest rates soon, further pressuring the British Pound.
From a technical perspective, GBP/USD is still heavily influenced by the descending trendline. The pair has failed to break the strong resistance at 1.3200, indicating that the downward trend remains intact. The nearest support level is 1.3100, and if this is broken, 1.3020 will be the next target.
In conclusion, with the pressure from macroeconomic factors and technical signals, the likelihood of GBP/USD continuing its decline in the near future is very high. Traders may consider opening a SELL position when the price approaches the resistance zone.

Is Gold Attempting to go back to Previous ATH?Hey Traders, in today's trading session we are monitoring XAUUSD for a buying opportunity around 4,220 zone, Gold is trading in an uptrend and currently is in a correction phase in which it is approaching the trend at 4,220 support and resistance area.
Trade safe, Joe.

USD/JPY – Strong Upside Potential After a Steady RecoveryThe USD/JPY pair is continuing its strong upward trend, with 154.000 acting as a key support level. Data from Japan and the U.S. show that the USD remains strong , while the Japanese Yen is weak due to the Bank of Japan's loose monetary policy.
Looking at the chart, USD/JPY is trading in a clear ascending channel , with 153.400 serving as strong support. The pair is approaching a strong resistance at 155.500 and could continue towards this level if the current bullish momentum is maintained. However, if the price adjusts slightly to 154.400, it will present an opportunity to increase long positions.
Conclusion: With the strong bullish trend and solid support at 153.400, USD/JPY is likely to continue rising in the short term. If the 155.500 resistance is broken, the next target will be 156.000. The pair has enough momentum to reach higher levels in the upcoming trading sessions.
Recommendation: Open a BUY position if the price adjusts to 154.400 and monitor for a breakout of the strong resistance at 155.500.

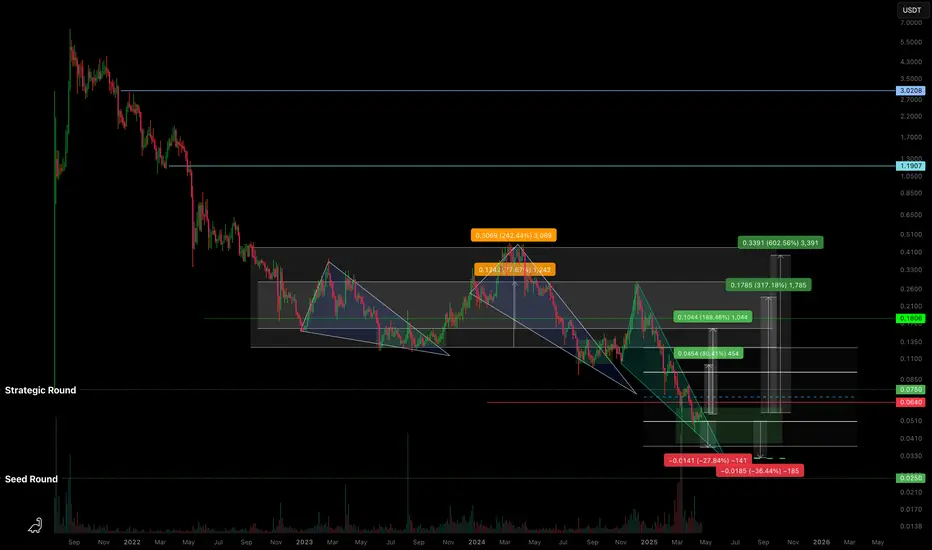
C98USDT — Descending Wedge & High R/R ZoneBased on the current structure, BINANCE:C98USDT is moving within a descending wedge , approaching zones that align with early investor positions.
🔍 What I’m seeing:
Potential drop into the range of a previous horizontal channel - marked on the chart.
We've already reached the Strategic Round level; below that is the Seed Round .
Assuming the project isn’t abandoned, it makes sense to expect investor defense in this zone.
From what I observe, there's likely accumulation happening from weak hands - at a discount .
🛡️ Approach:
As I’ve said before - you can’t treat coins like this in isolation .
They should be traded as part of a group of low-liquidity tokens , with proper risk management .
You can’t know in advance which one will “survive” without insider info from the team.
So the key is having a solid strategy and managing your portfolio and risk wisely .
📈 Targets:
Potential breakout targets from the wedge are marked on the chart.
If the market remains weak, I’ve noted a lower zone where consolidation might occur (sideways chop within a horizontal channel).
💭 Opinion:
The market is “paused” and waiting for a catalyst. You can’t rush it.
But zones like the current one on BINANCE:C98USDT seem attractive in terms of risk/reward .
The goal isn’t to guess - it’s to follow a pre-built strategy and stay focused .
📌 As always, this is not financial advice. Just my personal take and observations on the structure.
ARB/USDT – The zone is interesting for starting accumulation.Arbitrum - is an Ethereum layer-two (L2) scaling solution. It uses optimistic rollups to achieve its goal of improving speed, scalability and cost-efficiency on Ethereum. Arbitrum benefits from the security and compatibility of Ethereum. Another benefit is the higher throughput and lower fees compared to Ethereum. That is made possible thanks to moving most of the computation and storage load off-chain.
Arbitrum’s native token is called ARB and is used for governance. Offchain Labs, the developers behind Arbitrum, announced the shift to a decentralized autonomous organization (DAO) structure — the Arbitrum DAO. ARB holders can vote on proposals that affect the features, protocol upgrades, funds allocation and election of a Security Council.
CoinMarketCap : #51
The hyped-up Arbitrum! 😂
📉 January - February - March 2024: Bloggers trapped a huge number of people, and now we’re seeing a massive -87% decline!
Looking at the main trend, a large descending channel is forming. The price is currently at the support of the inner channel, and if the market makes a final liquidity grab with a downward wick, the price could head toward the support of the outer channel, targeting a -30% drop.
In my previous trading idea, I marked the 1.1552 zone, which is exactly where the price reversed. Everything is marked on the chart—the potential profit is very solid, especially for spot trading. The price will react strongly to the resistance zones of both the inner and outer channels.
🚀 These are the moments to watch for position accumulation—when no one is interested and belief in growth is dead, not when everyone is screaming "BUY NOW!" at local tops!
*I will update the trading idea as the trend develops.

BTC/USD: Testing Key Support (M/FVG) After Strong DowntrendKey Observations
Downtrend: The price has been moving lower, defined by the downward-sloping black trendline, indicating a period of bearish momentum.
Break of Structure (BOS): A "BOS" (Break of Structure) label is placed below a recent low, confirming the continuation of the bearish structure as the price moved lower.
Current Support Zone: The price is currently testing a significant support zone (the grey rectangular box) around the $96,000 - $98,500 area. This level appears to be a historical reaction zone.
Market Structure/Fair Value Gap (M/FVG): The support zone is also labeled as "M / FVG" (Likely Mitigation or Market Structure combined with a Fair Value Gap), suggesting this area holds significance for potential institutional/smart-money activity.
Future Scenarios (Projected Paths):
Scenario 1 (Black Arrow): The main projected path shows a potential bounce/reversal from the current support zone, aiming to push the price higher. This suggests a buy/long opportunity might be imminent if the support holds.
Scenario 2 (Curved Arrow): The alternative (and often less-likely, as it's secondary) projection suggests a continuation of the downtrend after a potential minor bounce or consolidation, indicating a break below the support zone and further declines.

WTF Bullish Breakout SetupWTF on the 1D chart has flipped from heavy selling to a constructive recovery after carving out a clear Double Bottom around the October lows. Price has now broken out above the neckline near 5.70 and is pressing into the 60-day and 120-day moving averages (around 5.56 and 5.45), which are acting as dynamic resistance. With price also above the rising 20-day MA at 5.21, the short-term structure has shifted from defense to offense.
As long as WTF holds above the breakout zone around 5.70, the primary path favors continuation higher toward the prior September supply zone, with the main resistance marked at 7.20 and interim projections around 5.96–6.25 over the next 5–10 days. The key demand zone sits near 4.80, where buyers last stepped in aggressively. A daily close below 5.20 would be an early warning that the breakout is stalling, while a sustained move under 4.80 would put the Double Bottom thesis at risk and reopen downside toward the lower range near 5.11 and below.
Thought of the Day 💡
Trading gets simpler when you define your line in the sand before price gets there, not after.
This is a study, not financial advice. Manage risk and invalidations

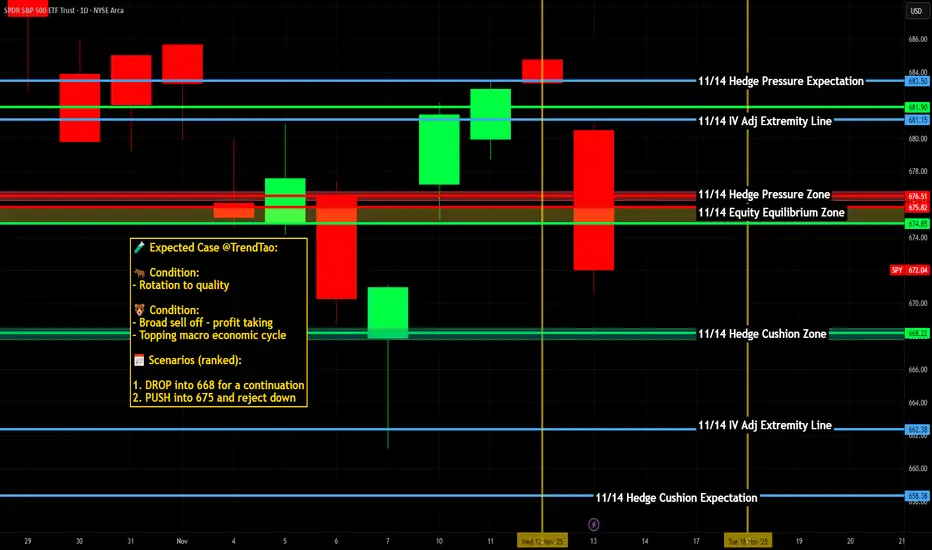
SPY & SPX Scenarios — Friday, Nov 14, 2025🔮 SPY & SPX Scenarios — Friday, Nov 14, 2025 🔮
🌍 Market-Moving Headlines
🚨 Shutdown disruption continues: The entire Retail Sales + PPI complex — normally one of the biggest monthly movers — is still at risk of nondelivery. Markets will trade on expectations, not prints.
📉 Volatility watch: With CPI, Claims, and Retail Sales all in backlog, positioning remains thin and reactive to yields + global risk sentiment.
💵 Bond market tone dominates: Without fresh inflation data, Treasury moves may guide SPX levels more than usual.
📊 Key Data & Events (ET)
All major data below is shutdown-risk flagged.
⏰ ⚠️ 8:30 AM — Retail Sales (Oct)
Forecast: -0.2%
Shutdown delay risk — high
⏰ ⚠️ 8:30 AM — Retail Sales ex-Auto (Oct)
Forecast: +0.2%
Shutdown delay risk — high
⏰ ⚠️ 8:30 AM — Producer Price Index (PPI, Oct)
Headline: +0.1%
Core: +0.3%
Shutdown delay risk — high
⏰ ⚠️ 10:00 AM — Business Inventories (Sept)
Forecast: +0.2%
Shutdown delay risk — medium
👉 All above data normally moves markets, especially Retail Sales + PPI.
Today, traders only get the reaction if the numbers publish.
⚠️ Disclaimer: Educational and informational only — not financial advice.
📌 #SPY #SPX #trading #inflation #PPI #RetailSales #macro #economy #Fed #markets #risk #shutdown
EURUSD – Why the Bulls Will Explode in the Coming DaysLooking at the market right now, there’s no denying that EURUSD is in a "heating up" phase. After a series of macroeconomic news that caused the USD to lose momentum, the euro has seized the opportunity to shine and break out powerfully. The Fed scaling back its interest rate hike expectations, along with weakening signals from the U.S. economy, has created a pivotal turning point for EURUSD, opening up a huge opportunity for the bulls.
Looking at the chart:
EURUSD has decisively broken through the important resistance level at 1.1600, with no signs of slowing down. The 1.1560 support level now acts as a solid launchpad for the price to continue its upward journey. The strong "higher lows" structure is gradually forming, showing that the bulls are in full control, and each current pullback is simply an opportunity for traders to enter.
What lies ahead?
The 1.1650 level will be the next key point to watch, where a strong resistance test is likely. If EURUSD continues to maintain this upward momentum, the path towards 1.1700 is very much achievable.

XAU/USD | Double Bottom → Breakout Retest → Clear Path for Bulls🧭 Market Overview
Gold has transitioned beautifully from a bearish liquidation phase into a clean bullish breakout structure.
This chart walks through each stage of the cycle — Accumulation → Breakout → Retest → Expansion — all clearly mapped for educational insight.
After sellers exhausted around $3,940–$3,960, Gold printed a textbook Double Bottom reversal.
Once price broke and closed above the neckline at $4,120, the structure flipped bullish — and now we’re in the Breakout Retesting phase.
🧩 Step-by-Step Breakdown of Chart Markings
🔶 1️⃣ “Clear Path for Bulls” – Liquidity Void Zone
The “Clear Path for Bulls” zone highlights a previous inefficient drop — an area with minimal resistance.
When price re-enters this void, momentum often accelerates, creating strong bullish continuation.
This is why above $4,120, price faces little friction until the next supply zone.
🟩 2️⃣ “Double Bottom” – Structure Base
Formed near $3,940–$3,960, this marks the liquidity sweep and accumulation base.
The second bottom confirms buyer presence and sets the neckline at $4,120.
That neckline is now acting as support, exactly where price is retesting today.
Below it? Only a liquidity pocket — thin structure, fast moves.
⚙️ 3️⃣ “Breakout Retesting” – Confirmation Phase
The “Breakout Retesting” zone illustrates a healthy technical pullback.
This retest confirms structure integrity, shakes out weak hands, and attracts institutional liquidity.
As long as $4,100–$4,120 holds, bulls maintain full control.
🔴 4️⃣ “Invalidation Point” – Structural Risk Line
The red-labeled “Invalidation Point” defines where the bullish thesis fails: a 4H close below $4,080.
This is the cutoff level protecting traders from a failed breakout.
The red projection (−4.11%, −168 pts) visualizes the probable liquidity sweep back toward $3,940.
🟢 5️⃣ “215.25 (5.20%) → 21,525” – Bullish Projection
This is the measured-move projection from the Double Bottom’s height.
It targets a 5.20% upside move into $4,360–$4,380, which aligns with the next liquidity/supply zone.
Simple, technical, and logical — structure-based profit zone.
⚫ 6️⃣ “−168.31 (−4.11%)” – Bearish Counterpath
A failed retest would likely send price down into the liquidity pocket again.
This highlights the importance of invalidation — clear risk awareness before execution.
Great visual lesson on maintaining reward-to-risk balance.
🟩 Bullish Case
✅ Hold above $4,120 confirms breakout integrity
🎯 Target 1 → $4,280
🎯 Target 2 → $4,360–$4,380
⚡ “Clear Path for Bulls” offers minimal resistance
🟥 Bearish Case
⚠️ Close below $4,080 invalidates breakout
📉 Expect liquidity grab toward $3,940–$3,960
💧 Reaccumulation likely before next attempt higher
🧠 Educational Insights
Structure builds sentiment — price respects zones, not opinions.
Breakout Retests validate structure; they’re not reversals.
Invalidation Points = professional discipline.
Measured Moves project liquidity targets, not guarantees.
Liquidity Voids show potential acceleration zones — trade them with structure.
💬 Trade Summary
Bias Above / Below Targets Risk Structure
🟩 Bullish Above $4,120 $4,280 → $4,380 Below $4,080 Double Bottom + Retest
🟥 Bearish Below $4,080 $3,940 Invalidation Liquidity Sweep Setup
🧩 Final Thoughts
Gold is now retesting its breakout structure — a key moment for confirmation.
Holding $4,120 keeps bulls in command toward $4,380, while losing it could trigger a −4% liquidity sweep before the next buildup.
This move is a clean visual example of:
Liquidity → Structure → Confirmation → Expansion
Stay patient, stay structured, and trade confirmations — not assumptions. 📚✨
📢 Community Discussion
What’s your bias on Gold here?
🟩 Holding above $4,120 for the bullish continuation, or 🟥 expecting a retest failure toward $3,940?
Share your thoughts 👇

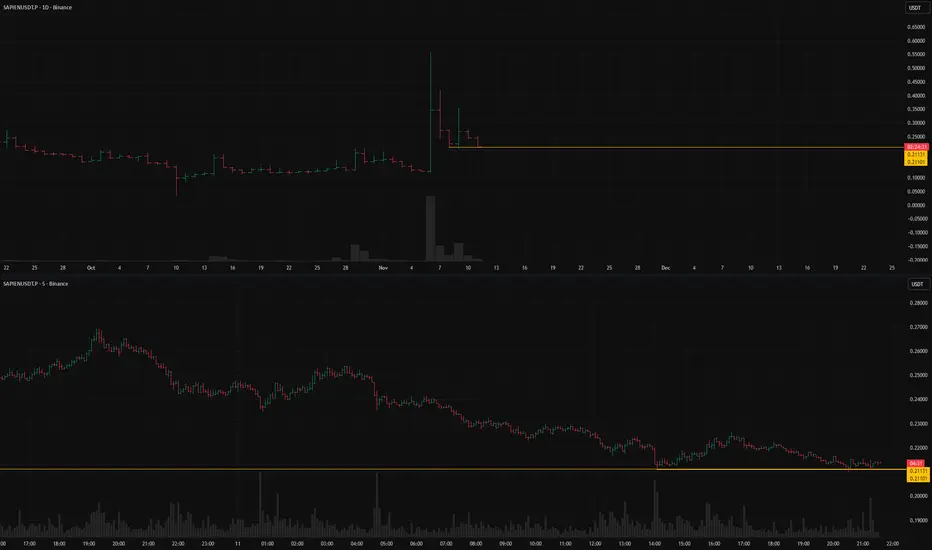
SAPIENUSDT.Pshort setup from daily support at 0.21101BINANCE:SAPIENUSDT.P is currently in a dump phase — a typical development after a strong pump.
The key level is 0.21131, which marked the previous drop’s stopping point.
This level has been confirmed multiple times, and the price is now approaching it gradually.
If low volatility persists and a valid entry point aligned with the trading system appears,
a short setup could be expected with potential continuation to the downside.
Key factors for this scenario:
Price void / low liquidity zone beyond level
Liquidity grab (false move against the trend)
Volatility contraction on approach
Immediate retest
Consolidation with price compression (squeeze)
Closing near the level
Closing near the bar's extreme
Was this analysis helpful? Leave your thoughts in the comments and follow to see more.
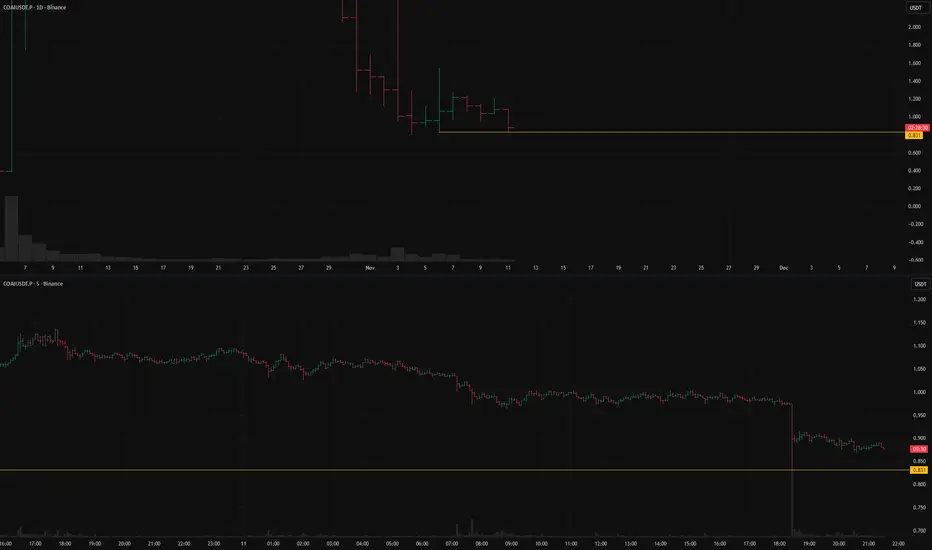
COAIUSDT.P: short setup from daily support at 0.831BINANCE:COAIUSDT.P is currently trading near its historical lows.
The setup looks ambiguous: on one hand, there are signals supporting a continuation of the short trend;
on the other, we might be seeing parabolic-style accumulation.
In any case, a local 5:1 move looks realistic in my view.
The chart stands out because on the lower timeframe, the price hit the support level almost to the tick,
a level formed a few days ago when the asset halted its drop and entered consolidation.
Such precise touches usually indicate a limit player positioned at the level —
and if that level gets broken, the asset could fall sharply.
I expect low volatility near the level,
and an additional confirmation would be a daily close below the current bar’s low or right at the level.
Key factors for this scenario:
Global & local trend alignment
Volatility contraction on approach
Price void / low liquidity zone beyond level
Momentum stall at the level
Immediate retest
No reaction after a false
Closing near the level
ONDS Bearish Setup or Breakout?ONDS on the 1D chart has shifted from a strong July–October uptrend into a decisive downtrend after topping near 11.50. Price now sits in a tight consolidation around 5.51, below the 20- and 60-day moving averages, which are capping rallies as dynamic resistance. The 120-day MA still sits below price near 4.60, so the long-term structure isn’t fully broken yet—but it’s being tested as volatility stays elevated.
A clear Descending Triangle is forming, with sellers pressing down from lower highs while buyers defend the 5.00 support zone. The primary path is bearish: a daily close below 5.00, ideally on rising volume, would confirm continuation lower, opening room toward the MA120 and the 4.00–4.60 zone. Invalidation for this breakdown view comes on a sustained move back above roughly 6.90–7.00, where prior structure and the MA60 align.
If 5.00 holds, a squeeze higher into 6.00–6.50 is possible, and a daily close above 6.65 would hint at a deeper squeeze toward 7.00–8.15 as a counter-trend move. MACD and Squeeze Momentum remain firmly bearish, so any bounce into resistance still favors sellers unless those indicators start to turn.
Thought of the Day 💡
Clear levels make decisions easy; respect them, don’t predict them.
This is a study, not financial advice. Manage risk and invalidations

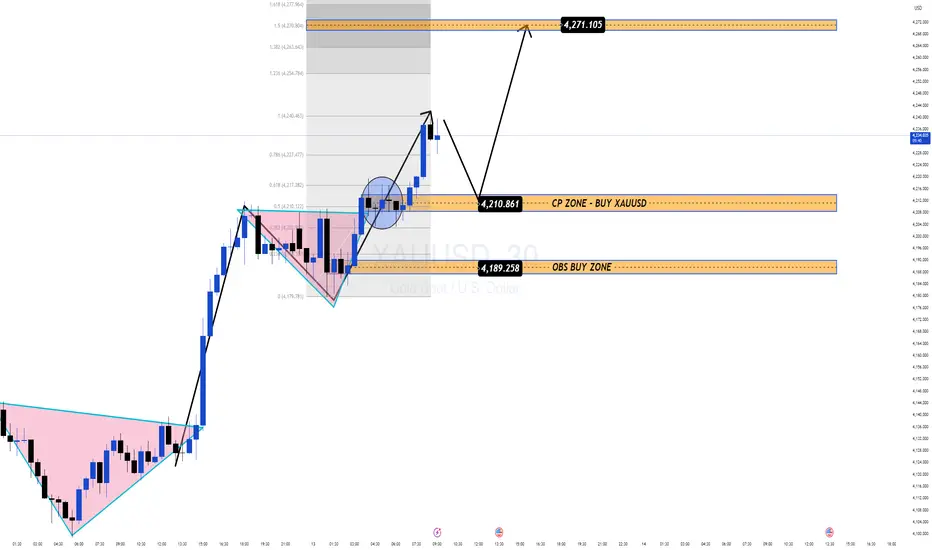
Gold Retesting CP Zone Before a Potential Rally Toward 4,270$Gold continues to respect its bullish structure after a clean breakout from the triangle accumulation pattern. The current pullback looks healthy and controlled, suggesting that price may simply be returning to key liquidity zones before launching the next impulse wave upward.
🔍 1. Market Structure – Clean Bullish Trend
Overall trend: Strong bullish on H1–H4.
Price broke out with momentum → beginning of a new impulse leg.
Recent correction tapped perfectly into the 0.382–0.50 Fibonacci area, confirming a typical bullish continuation pattern.
The key now is how price reacts around the CP Zone at 4,210 and the OBS Zone at 4,189.
📊 2. Key Technical Zones
🟩 CP BUY Zone: 4,210 – 4,211
• Fair retest zone
• Fibo confluence + prior breakout structure
→ High-probability reaction area.
🟧 OBS BUY Zone: 4,187 – 4,190
• 30m bullish Order Block
• Deep liquidity area where Smart Money often reloads
→ The “golden” buy zone if price sweeps deeper.
🎯 Primary Target
• 4,271$ (Fibo 1.618 extension + upper resistance)
→ Key expansion target for the ongoing bullish wave.
🔄 3. Trade Scenarios
Scenario 1 – CP Zone BUY (Priority)
If price retests 4,210 and shows bullish reaction → BUY continuation.
TP: 4,240 → 4,260 → 4,271
SL: Below 4,205
Scenario 2 – Deep Liquidity BUY (Alternate)
If price sweeps down into OBS 4,189–4,190, look for strong wick rejection → BUY.
TP: 4,220 → 4,240 → 4,271
SL: Below 4,180
🧠 MMFlow Insight
Trend remains undeniably bullish, no signs of reversal yet.
Pullbacks into CP/OBS are simply Smart Money accumulation phases.
As long as price holds above 4,189, the bullish bias remains dominant.
Expansion toward 4,27x is still the main roadmap.
👉 Avoid selling against the trend. Focus only on precision BUY setups at the right liquidity points.
AUDUSD Breakout and Potential RetraceHey Traders, in today's trading session we are monitoring AUDUSD for a buying opportunity around 0.64800 zone, AUDUSD was trading in a downtrend and successfully managed to break it out. Currently is in a correction phase in which it is approaching the retrace area at 0.64800 support and resistance area.
Trade safe, Joe.
