XAU/USD | Double Bottom → Breakout Retest → Clear Path for Bulls🧭 Market Overview
Gold has transitioned beautifully from a bearish liquidation phase into a clean bullish breakout structure.
This chart walks through each stage of the cycle — Accumulation → Breakout → Retest → Expansion — all clearly mapped for educational insight.
After sellers exhausted around $3,940–$3,960, Gold printed a textbook Double Bottom reversal.
Once price broke and closed above the neckline at $4,120, the structure flipped bullish — and now we’re in the Breakout Retesting phase.
🧩 Step-by-Step Breakdown of Chart Markings
🔶 1️⃣ “Clear Path for Bulls” – Liquidity Void Zone
The “Clear Path for Bulls” zone highlights a previous inefficient drop — an area with minimal resistance.
When price re-enters this void, momentum often accelerates, creating strong bullish continuation.
This is why above $4,120, price faces little friction until the next supply zone.
🟩 2️⃣ “Double Bottom” – Structure Base
Formed near $3,940–$3,960, this marks the liquidity sweep and accumulation base.
The second bottom confirms buyer presence and sets the neckline at $4,120.
That neckline is now acting as support, exactly where price is retesting today.
Below it? Only a liquidity pocket — thin structure, fast moves.
⚙️ 3️⃣ “Breakout Retesting” – Confirmation Phase
The “Breakout Retesting” zone illustrates a healthy technical pullback.
This retest confirms structure integrity, shakes out weak hands, and attracts institutional liquidity.
As long as $4,100–$4,120 holds, bulls maintain full control.
🔴 4️⃣ “Invalidation Point” – Structural Risk Line
The red-labeled “Invalidation Point” defines where the bullish thesis fails: a 4H close below $4,080.
This is the cutoff level protecting traders from a failed breakout.
The red projection (−4.11%, −168 pts) visualizes the probable liquidity sweep back toward $3,940.
🟢 5️⃣ “215.25 (5.20%) → 21,525” – Bullish Projection
This is the measured-move projection from the Double Bottom’s height.
It targets a 5.20% upside move into $4,360–$4,380, which aligns with the next liquidity/supply zone.
Simple, technical, and logical — structure-based profit zone.
⚫ 6️⃣ “−168.31 (−4.11%)” – Bearish Counterpath
A failed retest would likely send price down into the liquidity pocket again.
This highlights the importance of invalidation — clear risk awareness before execution.
Great visual lesson on maintaining reward-to-risk balance.
🟩 Bullish Case
✅ Hold above $4,120 confirms breakout integrity
🎯 Target 1 → $4,280
🎯 Target 2 → $4,360–$4,380
⚡ “Clear Path for Bulls” offers minimal resistance
🟥 Bearish Case
⚠️ Close below $4,080 invalidates breakout
📉 Expect liquidity grab toward $3,940–$3,960
💧 Reaccumulation likely before next attempt higher
🧠 Educational Insights
Structure builds sentiment — price respects zones, not opinions.
Breakout Retests validate structure; they’re not reversals.
Invalidation Points = professional discipline.
Measured Moves project liquidity targets, not guarantees.
Liquidity Voids show potential acceleration zones — trade them with structure.
💬 Trade Summary
Bias Above / Below Targets Risk Structure
🟩 Bullish Above $4,120 $4,280 → $4,380 Below $4,080 Double Bottom + Retest
🟥 Bearish Below $4,080 $3,940 Invalidation Liquidity Sweep Setup
🧩 Final Thoughts
Gold is now retesting its breakout structure — a key moment for confirmation.
Holding $4,120 keeps bulls in command toward $4,380, while losing it could trigger a −4% liquidity sweep before the next buildup.
This move is a clean visual example of:
Liquidity → Structure → Confirmation → Expansion
Stay patient, stay structured, and trade confirmations — not assumptions. 📚✨
📢 Community Discussion
What’s your bias on Gold here?
🟩 Holding above $4,120 for the bullish continuation, or 🟥 expecting a retest failure toward $3,940?
Share your thoughts 👇
Technical Analysis

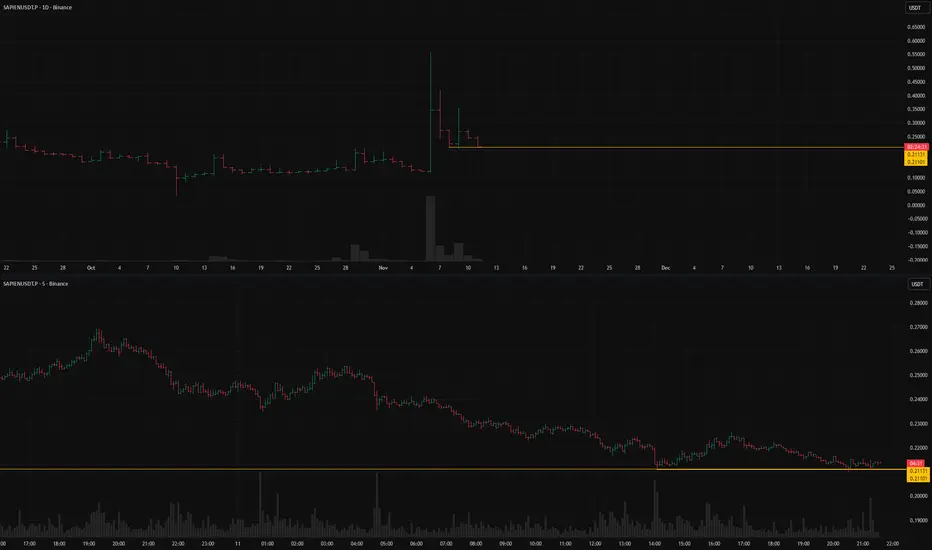
SAPIENUSDT.Pshort setup from daily support at 0.21101BINANCE:SAPIENUSDT.P is currently in a dump phase — a typical development after a strong pump.
The key level is 0.21131, which marked the previous drop’s stopping point.
This level has been confirmed multiple times, and the price is now approaching it gradually.
If low volatility persists and a valid entry point aligned with the trading system appears,
a short setup could be expected with potential continuation to the downside.
Key factors for this scenario:
Price void / low liquidity zone beyond level
Liquidity grab (false move against the trend)
Volatility contraction on approach
Immediate retest
Consolidation with price compression (squeeze)
Closing near the level
Closing near the bar's extreme
Was this analysis helpful? Leave your thoughts in the comments and follow to see more.
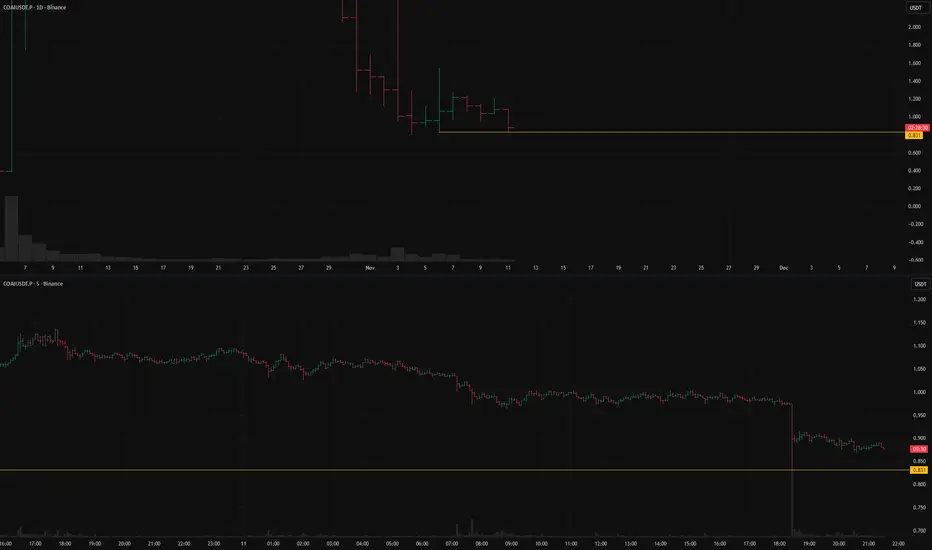
COAIUSDT.P: short setup from daily support at 0.831BINANCE:COAIUSDT.P is currently trading near its historical lows.
The setup looks ambiguous: on one hand, there are signals supporting a continuation of the short trend;
on the other, we might be seeing parabolic-style accumulation.
In any case, a local 5:1 move looks realistic in my view.
The chart stands out because on the lower timeframe, the price hit the support level almost to the tick,
a level formed a few days ago when the asset halted its drop and entered consolidation.
Such precise touches usually indicate a limit player positioned at the level —
and if that level gets broken, the asset could fall sharply.
I expect low volatility near the level,
and an additional confirmation would be a daily close below the current bar’s low or right at the level.
Key factors for this scenario:
Global & local trend alignment
Volatility contraction on approach
Price void / low liquidity zone beyond level
Momentum stall at the level
Immediate retest
No reaction after a false
Closing near the level
ONDS Bearish Setup or Breakout?ONDS on the 1D chart has shifted from a strong July–October uptrend into a decisive downtrend after topping near 11.50. Price now sits in a tight consolidation around 5.51, below the 20- and 60-day moving averages, which are capping rallies as dynamic resistance. The 120-day MA still sits below price near 4.60, so the long-term structure isn’t fully broken yet—but it’s being tested as volatility stays elevated.
A clear Descending Triangle is forming, with sellers pressing down from lower highs while buyers defend the 5.00 support zone. The primary path is bearish: a daily close below 5.00, ideally on rising volume, would confirm continuation lower, opening room toward the MA120 and the 4.00–4.60 zone. Invalidation for this breakdown view comes on a sustained move back above roughly 6.90–7.00, where prior structure and the MA60 align.
If 5.00 holds, a squeeze higher into 6.00–6.50 is possible, and a daily close above 6.65 would hint at a deeper squeeze toward 7.00–8.15 as a counter-trend move. MACD and Squeeze Momentum remain firmly bearish, so any bounce into resistance still favors sellers unless those indicators start to turn.
Thought of the Day 💡
Clear levels make decisions easy; respect them, don’t predict them.
This is a study, not financial advice. Manage risk and invalidations

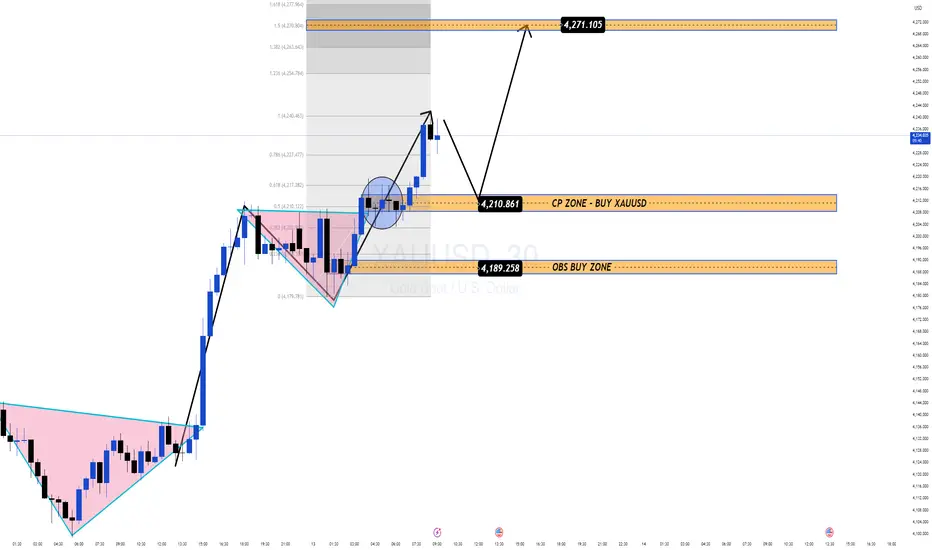
Gold Retesting CP Zone Before a Potential Rally Toward 4,270$Gold continues to respect its bullish structure after a clean breakout from the triangle accumulation pattern. The current pullback looks healthy and controlled, suggesting that price may simply be returning to key liquidity zones before launching the next impulse wave upward.
🔍 1. Market Structure – Clean Bullish Trend
Overall trend: Strong bullish on H1–H4.
Price broke out with momentum → beginning of a new impulse leg.
Recent correction tapped perfectly into the 0.382–0.50 Fibonacci area, confirming a typical bullish continuation pattern.
The key now is how price reacts around the CP Zone at 4,210 and the OBS Zone at 4,189.
📊 2. Key Technical Zones
🟩 CP BUY Zone: 4,210 – 4,211
• Fair retest zone
• Fibo confluence + prior breakout structure
→ High-probability reaction area.
🟧 OBS BUY Zone: 4,187 – 4,190
• 30m bullish Order Block
• Deep liquidity area where Smart Money often reloads
→ The “golden” buy zone if price sweeps deeper.
🎯 Primary Target
• 4,271$ (Fibo 1.618 extension + upper resistance)
→ Key expansion target for the ongoing bullish wave.
🔄 3. Trade Scenarios
Scenario 1 – CP Zone BUY (Priority)
If price retests 4,210 and shows bullish reaction → BUY continuation.
TP: 4,240 → 4,260 → 4,271
SL: Below 4,205
Scenario 2 – Deep Liquidity BUY (Alternate)
If price sweeps down into OBS 4,189–4,190, look for strong wick rejection → BUY.
TP: 4,220 → 4,240 → 4,271
SL: Below 4,180
🧠 MMFlow Insight
Trend remains undeniably bullish, no signs of reversal yet.
Pullbacks into CP/OBS are simply Smart Money accumulation phases.
As long as price holds above 4,189, the bullish bias remains dominant.
Expansion toward 4,27x is still the main roadmap.
👉 Avoid selling against the trend. Focus only on precision BUY setups at the right liquidity points.
AUDUSD Breakout and Potential RetraceHey Traders, in today's trading session we are monitoring AUDUSD for a buying opportunity around 0.64800 zone, AUDUSD was trading in a downtrend and successfully managed to break it out. Currently is in a correction phase in which it is approaching the retrace area at 0.64800 support and resistance area.
Trade safe, Joe.

ALTcoin Dominance Is On The Rise; ALTseason?BTC.dominance is coming down, while ALTcoin.dominance is on the rise, so ALTcoins could be doing better than Bitcoin in upcoming days/weeks, but for the real ALTseason, we need Crypto TOTAL market cap chart back to bullish mode.
OTHERS.D chart - ALTcoin dominance is breaking channel resistance line, so some ALTcoins are already nicely recovering, although Bitcoin is still searching for support.
As you can see, even OTHERS Crypto TOTAL market cap chart, which excludes top10 cryptocurrencies, is looking for a continuation higher after the recent complex w-x-y correction.
So, if it manages to break back above channel resistance line near 260B area, then ALTseason could be here, especially if Bitcoin starts recovering as well.

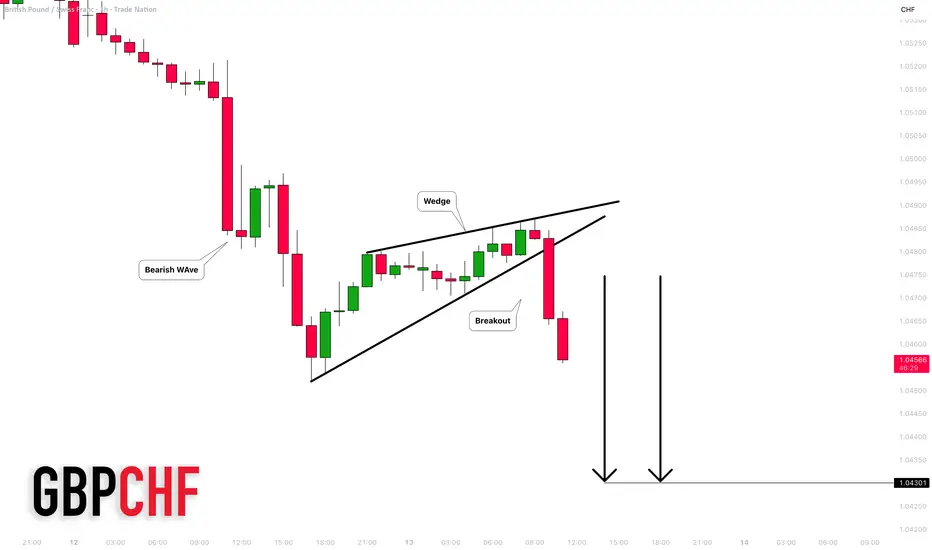
GBPCHF: Bearish Trend Continuation 🇬🇧🇨🇭
GBPCHF is trading in a strong downtrend.
A bearish breakout of a rising wedge pattern on an hourly time frame
indicates a highly probable trend continuation.
I expect a fall at least to 1.043 level.
❤️Please, support my work with like, thank you!❤️
I am part of Trade Nation's Influencer program and receive a monthly fee for using their TradingView charts in my analysis.
How I Caught 2R on USDJPY → and What’s NextIn the past few months, no pair has been as profitable as USDJPY.
If you followed my analysis from two days ago, you’re probably sitting on around a 2R profit right now.
Now, let’s talk about what’s next.
On the 15-minute timeframe, USDJPY has formed a clean range — and a breakout from this zone could trigger the next big move.
Setup and Entry Plan:
We can place a buy stop above the 155.002 resistance, though I personally prefer to wait for a breakout candle confirmation before entering.
At the moment, the structure doesn’t offer an ideal stop-loss placement.
If the price continues to range until just before the New York session, we’ll likely get a much tighter and more efficient stop.
Otherwise, the stop-loss can go below 154.604, or if you want to be safer, below 154.478.
Exit Plan:
The 155.874 zone is a solid first target for taking profit.
I recommend partial profits, since this trade aligns with both HWC and MWC structures — meaning continuation probability remains high.
However, if price fakes out below 155.002, it’s better to close the previous position (from two days ago), as we might be facing a short-term correction.
Goal:
The goal here is to capture the continuation of the HWC and the beginning of an MWC uptrend on the daily timeframe.
That’s why using partial profits helps you stay in sync with the trend while locking in higher R/R ratios safely.

NOTUSDT – broken faith and potential for a reversalNotcoin(NOT) - is a Web3 gaming project launched on January 1 within the TON ecosystem. Technically, Notcoin is an application inside the Telegram messenger. The project attracted users' attention through an announced token airdrop. The developers invited users to mine tokens simply by tapping on their smartphone screens. Within a few months, the game's audience exceeded 35 million people.
📍CoinMarketCap: #170
📍Twitter(X): 2.4M
________________
The NOT token dropped by -94.5% following its listing and a wave of hype. Such a decline is typically accompanied by a loss of faith in its growth and potential.
🔍 What I observe:
The price is moving within a descending channel.
A reversal pattern, the "inverse head and shoulders," is forming in the current zone, with a potential upside of around ~75%.
The key point is a breakout above the outer resistance of the channel.
The token has high liquidity.
NOT is traded on all major exchanges, including the top-tier ones.
It has excellent access to marketing and PR, which is important for pump scenarios.
💭 All key levels, possible scenarios, and targets are marked on the chart. Take them into account when building your own strategy.
________
📌 Not financial advice. Personal view and experience.

SCRT/USDT – Testing support. Will the scenario repeat?Secret - is a privacy-focused blockchain built on Cosmos. Its smart contracts, called Secret Contracts, enable DApps to utilize private data on Secret, similar to how smart contracts function on other blockchains. However, Secret Contracts transmit encrypted data through encrypted channels without exposing it. This is made possible by encrypting the contract state during execution.
All the charts are cropped, so I found a more complete historical chart of the coin and overlaid it to the left.
This coin has dropped by approximately -98% since its distribution. To put it in perspective, if you had invested $1,000 , you would now have only $20 …
We observe a formation resembling an internal channel (120%) and an external channel (280%) . The price is once again being squeezed near support at the lowest price zones available on Binance (where the main liquidity is).
My previous trading idea played out successfully in three zones .
Profit from the time of publication to the squeeze: +270%.
The price is moving within a descending channel , but at the same time, the sideways range I previously anticipated is also forming. Here, it’s crucial to adapt to the situation.
Right now, the entire market is experiencing a pullback toward support levels .
I've marked potential final liquidity grab zones on the chart—consider these in your trading strategy.
Also, I want to highlight how negative the news sentiment is at the moment. No one believes in a rally. But that's exactly how it always looks in similar price reversal zones !)))

FTTUSDT – new accumulation in an interesting zone🚨 This information is intended for thoughtful market participants who are willing to work in this field - not for those chasing gambling, guesswork, or getting stuck in news flow.
Price has returned to the support zone of the outer horizontal channel. Accumulation is currently taking place in this area.
📰 FTX is preparing for its third round of distributions - $1.9 billion, expected around September 30. Marked it on the chart. Whether they shift the date or not, the essence remains unchanged.
Possible scenarios:
1️⃣ A double bottom forms in the lower zone of the channel, with a pattern range of about 60%.
👇
- - - - - - - - - - - - - - - - - - - - - - - - - - - - - - - - - - - - - - - - - - - - - - - - -
2️⃣ Another option is a descending wedge, followed by a breakout on volume, a retest of the breakout zone, and further continuation.
👇
- - - - - - - - - - - - - - - - - - - - - - - - - - - - - - - - - - - - - - - - - - - - - - - - -
3️⃣ Next scenario: sideways consolidation within the current zone, with an inner range of 40% and outer range of 90%, followed by a breakout and movement toward the main targets of the larger channel.
👇
- - - - - - - - - - - - - - - - - - - - - - - - - - - - - - - - - - - - - - - - - - - - - - - - -
❗ I marked the downward (protective) zones on the chart that should be taken into account for each of the proposed scenarios — to align with your strategy. This is important. First the plan - then action.
👇
- - - - - - - - - - - - - - - - - - - - - - - - - - - - - - - - - - - - - - - - - - - - - - - - -
📌 P.S. In fact, everything is simpler than it seems.
I believe time is a key factor.
The main thing is to be ready for different scenarios before the final move.
There’s nothing to guess here.
Even if you add another pattern, it won’t change the core idea.

LYFT 1W from losses to profit investors believe,but for how longLYFT broke out of its long accumulation range between $8 and $20 and is now consolidating above the breakout level. The “breakout + retest” structure remains intact, with $20–21 acting as key support. A golden cross on the weekly chart confirms a shift toward bullish momentum. As long as price holds above $20, targets stay at $33.33 and $48.48.
Fundamentally , Lyft is in its strongest position in years. In Q3 2025, the company reported its first net profit of about $46 million after years of losses. Revenue grew 11% YoY to $1.68 billion, gross bookings rose 16%, and adjusted EBITDA reached roughly $139 million (+29% YoY). Active riders climbed past 28 million, average revenue per user increased, and corporate and premium rides strengthened overall performance. Cash flow improved, debt levels declined, and operating margins continued to expand.
The main challenge lies in competition and pricing pressure from Uber, as well as in sustaining profitability beyond a single quarter. While optimism is reflected in the stock price, consistent financial performance is now critical for further upside.
Technically, holding above $20 keeps the bullish setup valid. Any pullback toward $21–20 may offer a buy-the-dip opportunity with targets at $33 and $48.
Lyft finally turned profitable - now the real test is proving that growth isn’t just a quarterly anomaly.

AUDUSD – When Capital Starts Leaning Toward the BullsThe market is entering an interesting phase as Australia’s latest economic data brings renewed confidence to the AUD. Stronger-than-expected job growth and the RBA’s stance of “no interest-rate cuts anytime soon” have created a solid foundation for the Australian dollar to attract buying pressure. Meanwhile, the USD is gradually losing momentum as markets reduce expectations of a quick policy move from the Fed. This shift makes the AUD a more attractive short-term choice.
On the chart, AUDUSD has just broken above short-term resistance and is holding firmly above the 0.6560 nearby support — an important area the market may use to accumulate before pushing higher. The current structure leans bullish, with higher lows forming and clear buying interest each time price retests support.
As long as AUDUSD stays above 0.6560, the next target lies around 0.6620 — a zone that previously acted as strong rejection. This will be the level where bulls truly test their strength before deciding whether to extend the uptrend.

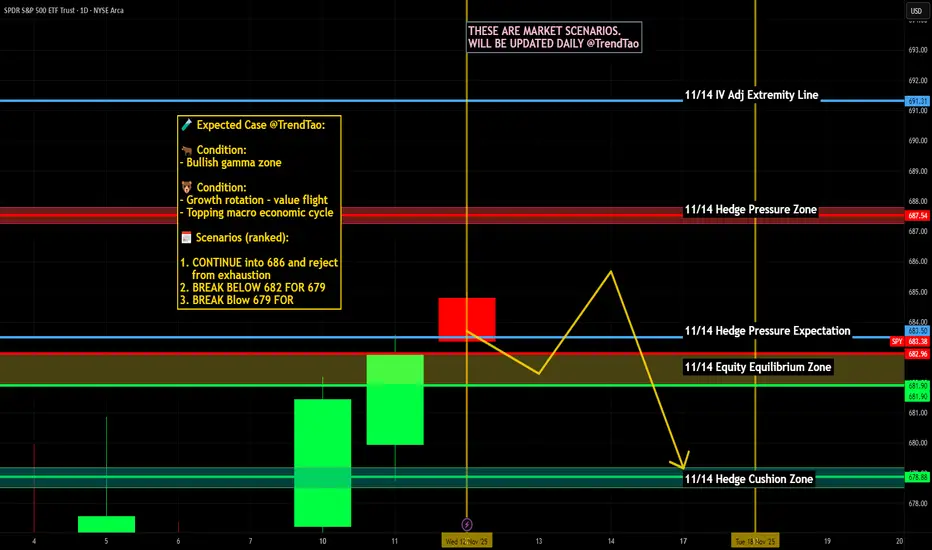
$SPY $SPX Scenarios — Thursday, Nov 13, 2025🔮 AMEX:SPY SP:SPX Scenarios — Thursday, Nov 13, 2025 🔮
🌍 Market-Moving Headlines
🚨 Inflation spotlight (⚠️ delay risk): October CPI and Jobless Claims — both subject to government shutdown delay — were originally scheduled for release this morning. Markets may stay cautious or reactive to leaks and private inflation trackers in the absence of official prints.
💬 Fed rotation continues: A packed Fed lineup — Mary Daly, John Williams, Kashkari, Hammack, and Bostic — will steer tone across the day, shaping expectations for December guidance.
📉 Budget check: A fresh federal deficit report (-$215B) adds to the fiscal backdrop narrative, though reaction may stay muted if major data doesn’t hit.
📊 Key Data and Events (ET)
⏰ 8:00 AM — Mary Daly (San Francisco Fed) speech
⏰ ⚠️ 8:30 AM — Consumer Price Index (Oct) | +0.3% MoM | +3.1% YoY (subject to delay)
⏰ ⚠️ 8:30 AM — Core CPI (Oct) | +0.3% MoM | +3.1% YoY (subject to delay)
⏰ ⚠️ 8:30 AM — Initial Jobless Claims (Nov 8) | 225,000 forecast (subject to delay)
⏰ 9:20 AM — John Williams (NY Fed) welcoming remarks
⏰ 10:25 AM — Neel Kashkari (Minneapolis Fed) opening remarks
⏰ 12:15 PM — Alberto Musalem (St. Louis Fed) speech
⏰ 12:20 PM — Beth Hammack (Cleveland Fed) speech
⏰ 2:00 PM — Monthly U.S. Federal Budget (Oct) | -$215B deficit vs -$257.5B prior
⏰ 3:20 PM — Raphael Bostic (Atlanta Fed) speech
⚠️ Note:
CPI and Jobless Claims carry the highest market impact this week — but both remain at risk of delay due to the ongoing federal data blackout. Fed speakers and any CPI proxies (like Cleveland Fed’s nowcast) will drive intraday volatility instead.
⚠️ Disclaimer: Educational and informational only — not financial advice.
📌 #SPY #SPX #trading #CPI #inflation #Fed #Williams #Bostic #Musanlem #Hammack #macro #markets #yields #shutdown
TSLA Plunging? The Fake Rebound Before the Real Crash!Tesla (TSLA) is entering a challenging phase as a wave of negative news hits from both fundamental and technical sides. Sales in China — Tesla’s second-largest market — have dropped to their lowest level in three years , sparking fears that real demand for EVs is cooling. At the same time, Elon Musk’s massive $1 trillion compensation package has raised concerns among investors who believe Tesla’s current valuation far exceeds its actual profit potential.
On the daily chart, TSLA is showing clear signs of weakness after an extended uptrend. The price is now testing the medium-term ascending trendline around the $430 zone . If buying pressure fails to hold this level, there’s a strong chance the price will break the trendline and enter a deeper correction phase .
In the short term, Tesla could continue to drop toward the $400 area , where strong support and the Ichimoku cloud base converge. Any rebounds, especially near the $450 resistance zone, should be viewed as opportunities for sellers to re-enter rather than signs of recovery.
