Can Silicon Nanowires Redefine America's Battery Future?Amprius Technologies has positioned itself at the convergence of breakthrough materials science and national security imperatives, developing the world's highest energy density lithium-ion batteries through proprietary silicon nanowire technology. The company's batteries deliver up to 450 Wh/kg with targets exceeding 500 Wh/kg - nearly double the performance of conventional graphite-based cells - by solving silicon's historical expansion problems through a unique rooted nanowire architecture that allows internal expansion without structural degradation.
The strategic value extends beyond pure technology metrics. Amprius has secured $50 million in federal funding under Biden's Bipartisan Infrastructure Law and maintains critical defense contracts, including repeat orders totaling over $50 million from unmanned aerial systems manufacturers. This government backing reflects the company's role in domestic supply chain security, as its 100% silicon anode technology reduces reliance on graphite imports while establishing gigawatt-hour manufacturing capacity in Colorado. The Department of Energy's investment essentially validates Amprius as a strategic national asset in the race for advanced battery independence.
Financially, the company has demonstrated rapid acceleration with H1 2025 revenue of $26.4 million already surpassing all of 2024, while achieving a crucial 9% positive gross margin that signals viable unit economics. However, the path to mass market viability remains challenging, with estimated capital expenditures of $120-150 million per GWh of capacity highlighting the complexity of scaling nanowire manufacturing. Wall Street maintains unanimous "Strong Buy" ratings with price targets above $11.67, though recent insider selling following the stock's 1,100% surge raises questions about current valuation versus near-term execution risks.
The company's hybrid manufacturing strategy - leveraging over 1.8 GWh of international contract capacity while building domestic production - reflects a calculated approach to managing capital requirements while capturing immediate high-margin defense and aerospace opportunities. Success hinges on the operational launch of their Colorado facility in H1 2025 and the ability to translate their performance advantages into cost-competitive production for broader electric vehicle markets.
Technology

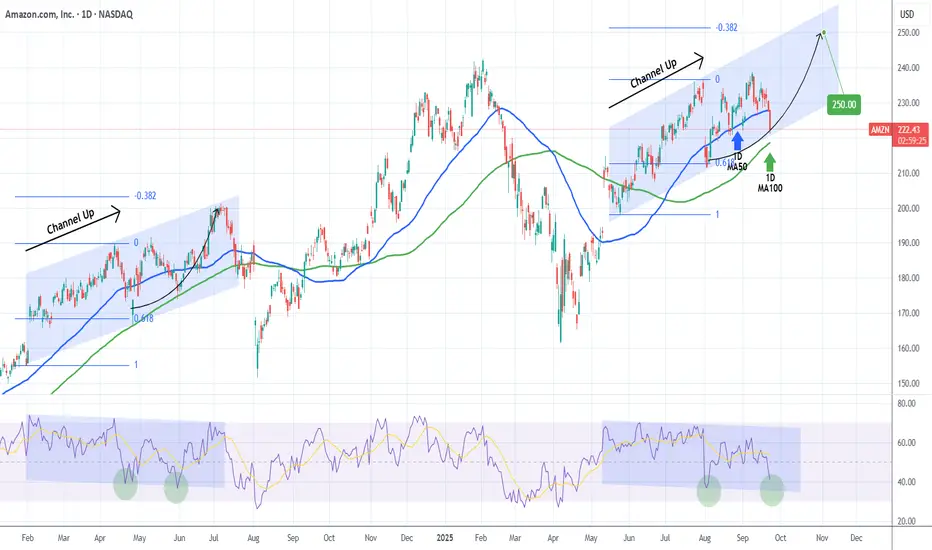
AMAZON Has it found a bottom?Amazon Inc. (AMZN) has been trading within a 4-month Channel Up and is currently pulling back on a Bearish Leg. The 1D MA100 (green trend-line) is just below and last time a similar Channel Up found support on it (May 31 2024), it rebounded for a -0.382 Fibonacci extension top.
As you can see, both patterns are identical, even making their first Higher Lows on their respective 0.618 Fib. Even their 1D RSI fractals are similar and right now we are headed of the 2nd Low (green circle).
As a result, we expect a bullish reversal there, targeting a little under $250 (Fib -0.382 ext).
-------------------------------------------------------------------------------
** Please LIKE 👍, FOLLOW ✅, SHARE 🙌 and COMMENT ✍ if you enjoy this idea! Also share your ideas and charts in the comments section below! This is best way to keep it relevant, support us, keep the content here free and allow the idea to reach as many people as possible. **
-------------------------------------------------------------------------------
💸💸💸💸💸💸
👇 👇 👇 👇 👇 👇
SOXL 1D — With a base like this, the ride’s worth itOn the daily chart of SOXL, since early March, a textbook inverse head and shoulders pattern has formed and is now in its activation phase. The left shoulder sits at $16.67, the head at $7.21, and the right shoulder at $15.11. The symmetry is classic, with volume stabilization and a narrowing range — all the elements are in place.
The key moment was the breakout through the descending daily trendline around $19.00. Price didn’t just pierce the level — it held above it, signaling a phase shift. There was an attempt to break through the 0.5 Fibonacci level at $19.60, which led to a pullback — not on heavy selling, but on decreasing volume. This wasn’t a rejection, it was a pause.
This pullback serves as a retest of the breakout zone and the 20-day moving average. The overall structure remains bullish: price stays above all key EMAs and MAs, RSI climbs past 60, and the candlestick structure is stable. Volume rises during up moves and fades during pullbacks — classic signs of reaccumulation.
The measured target from the pattern is $32.00, calculated from the head-to-neckline height projected from the breakout point. As long as price holds above $18.40, the setup remains intact. A break above $19.60 with confirmation would open the door to acceleration.
This isn’t a momentum play — it’s a setup months in the making. The structure is there, the confirmation is there, and most importantly — the price behavior makes sense. With a base like this, the ride ahead looks worth taking.

META Is this the final rally to $970??Meta Platforms (META) has been rising this month after successfully coming off August's Bull Flag. Technically this is an extension of the very aggressive rebound since the April 07 2025 Trade War bottom. It also took place right above the 1W MA100 (green trend-line).
This is quite similar to the Feb - March 2020 COVID crash, both corrections were -35.39% and -38.52% respectively. At the same time, they were both carried out by Bullish Megaphone patterns with similar 1W RSI sequences.
The Channel Up (green) that followed the COVID crash peaked on its 1.618 Fibonacci extension before turning sideways towards the 1W MA50 (blue trend-line) again.
As a result, given the remarkable symmetry between the two fractals so far, we can expect the current (post Trade War) Channel Up to peak near its 1.618 Fib ext at around $970.00.
-------------------------------------------------------------------------------
** Please LIKE 👍, FOLLOW ✅, SHARE 🙌 and COMMENT ✍ if you enjoy this idea! Also share your ideas and charts in the comments section below! This is best way to keep it relevant, support us, keep the content here free and allow the idea to reach as many people as possible. **
-------------------------------------------------------------------------------
💸💸💸💸💸💸
👇 👇 👇 👇 👇 👇

ARM Holdings — reversal pattern signals growth potentialOn the ARM chart an inverted head and shoulders pattern is taking shape with price approaching the neckline around 144–145 and a confirmed breakout above this level could trigger an upward move toward 220 with extended targets at 310–330. In case of a pullback the 128 zone remains key support to preserve the bullish structure. Fundamentally ARM continues to strengthen its role in chip architecture while growing demand in artificial intelligence and mobile technologies drives institutional interest. As long as the pattern holds the bullish scenario stays in play.

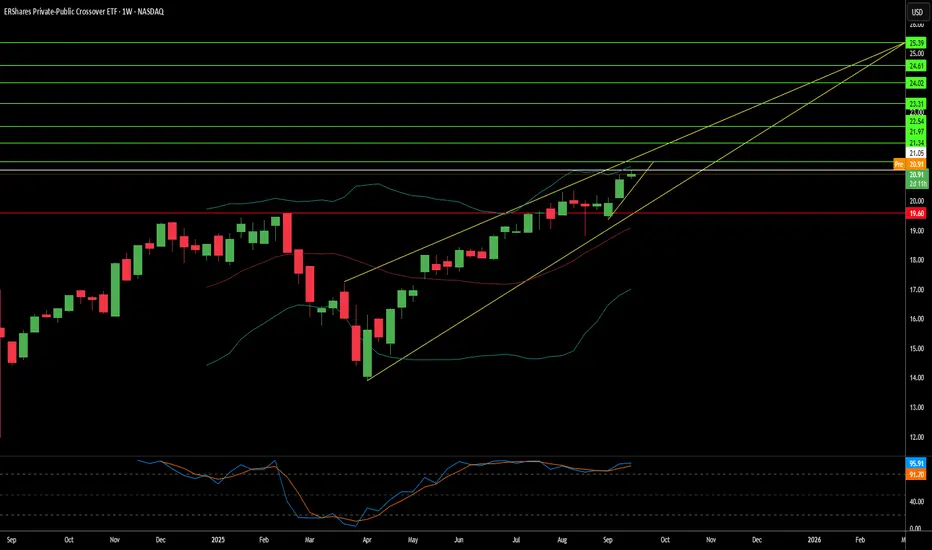
Can One Fund Bridge the $13 Trillion Private Market Gap?The ERShares Private-Public Crossover ETF (XOVR) represents a groundbreaking financial innovation that democratizes access to private equity investments, which have traditionally been reserved for institutional players and accredited investors. Following a strategic relaunch in August 2024, the fund has experienced remarkable growth, with assets under management reaching $481.5 million and attracting over $120 million in inflows since its initial SpaceX Investment. Built on Dr. Joel Shulman's proprietary "Entrepreneur Factor" methodology, XOVR combines the proven ER30TR Index (which accounts for over 85% of its portfolio) with carefully selected private equity holdings, creating a unique structure that offers daily liquidity and transparency while capturing pre-IPO value creation.
The fund's investment thesis centers on identifying companies at the convergence of technology, national security, and global strategy. Its marquee private holdings - SpaceX and Anduril Industries - exemplify this approach, representing critical players in a privatized defense industrial base. SpaceX has evolved beyond a commercial space company into a geostrategic asset through Starlink, which serves as essential communication infrastructure in modern conflicts, such as Ukraine. Anduril's AI-powered Lattice platform and its recent $159 million contract with the U.S. Army for mixed reality systems illustrate the military's shift towards agile, software-focused defense solutions. Both companies have constructed formidable competitive moats through technological innovation and robust intellectual property portfolios.
XOVR's performance validates its high-conviction strategy, delivering a 33.46% total return over the past year compared to its benchmark's 26.48%, with three-year annualized returns of 28.11%. The fund's concentrated approach - with top ten holdings comprising over 50% of the portfolio - is a deliberate design choice that enables outsized returns by taking conviction positions in category-defining innovators. Rather than following market trends, XOVR positions investors at the source of innovation, leveraging its unique structure to identify and access the next generation of disruptive companies with the potential to become tomorrow's market leaders.
The fund represents more than an investment vehicle; it embodies a fundamental shift in capital allocation that recognizes the blurring lines between public and private enterprise. By combining the accessibility and liquidity of public markets with the growth potential of private investments, XOVR offers retail investors unprecedented access to value creation opportunities that were once the exclusive domain of institutional players, positioning them to participate in the technological and strategic innovations that will define the next decade.
Wix | WIX | Long at $124.35NASDAQ:WIX is a company with steady growth projections driven by AI adoption, market expansion, user acquisition, and a focus on profitability. For example, earnings are forecast to grow 28.24% per year. Analysts project NASDAQ:WIX to achieve approximately $1 billion in free cash flow by 2028. While the current P/E is around 47x, its Forward P/E ratio is approximately 18x (potentially undervalued). I truly believe the changing economy will shift individuals into more entrepreneurship (what else can they do?) and that will be the driving force behind user growth.
From a technical analysis view, the price recently bounced off from my historical simple moving average band (often an area for share accumulation / consolidation). While it may trickle down to close the price gap on the daily chart near $110 in the near-term, I think the outlook needs to be long-term here given the projections. The only issue I see is the current high debt for NASDAQ:WIX , but interest rates are absolutely coming down soon which will help ease the strain.
Thus, at $124.35, NASDAQ:WIX is in a personal buy zone.
Targets into 2028:
$175.00 (+40.7%)
$250.00 (+101.1%)

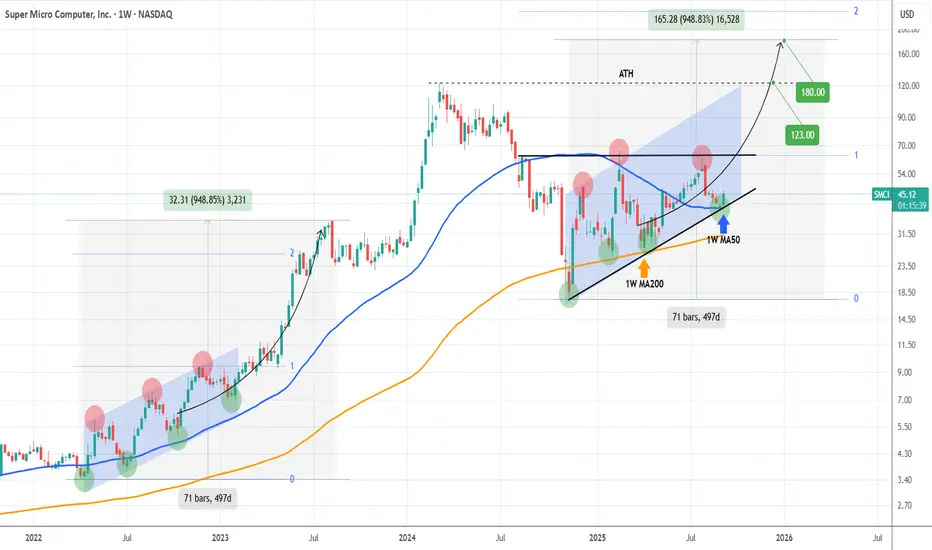
SMCI Rebounding on its 1W MA50 and targeting the ATH.Super Micro Computer Inc (SMCI) hit last week its 1W MA50 (blue trend-line) and this week posts a strong 1W candle. This rebound comes on the Higher Lows trend-line (bottom) of the 1-year Ascending Triangle.
It may not be exactly like the Channel Up of 2022 but it looks like a similar Accumulation pattern that preceded the massive 2023 rally. The Triangle typically breaks to the upside and technically targets the 2.0 Fibonacci extension. This time that would be even higher than the 2023 rise of +948.85%.
In any case that would be our over-extended Target ($180.00), with a more 'reasonable' one being the All Time High (ATH) of $123.00.
-------------------------------------------------------------------------------
** Please LIKE 👍, FOLLOW ✅, SHARE 🙌 and COMMENT ✍ if you enjoy this idea! Also share your ideas and charts in the comments section below! This is best way to keep it relevant, support us, keep the content here free and allow the idea to reach as many people as possible. **
-------------------------------------------------------------------------------
💸💸💸💸💸💸
👇 👇 👇 👇 👇 👇
Adobe | ADBE | Long at $347.44Adobe NASDAQ:ADBE
Technical Analysis:
Trend is, overall, moving sideways. The price gap on the daily chart between $303.29 and $317.87 is likely to be closed in the near-term. The stock may reach the $280's to $290's to form a double bottom before a move up, so short-term investors should note the near-term risks. Long-term, however, if growth projections are accurate, all of those price gaps above the current price are likely to be filled...
Earnings and Revenue Growth
Expected annual revenue growth between 2025-2028 is ~41% (cumulative), growing from around $23.7 billion in 2025 to $33.3 billion in 2028.
EPS growth from $20.7 in 2025 to $26.2 in 2028.
www.tradingview.com
Health
Debt-to-Equity: 0.53x (very good)
Altman's Z-Score/Bankruptcy Risk: 10.2 (excellent/very low risk)
Quick Ratio/Ability to pay current bills: 1.02 (okay, but some risk)
Insiders
Warning: Selling heavily outweighs buying.
openinsider.com
Action
Due to the high-growth potential of NASDAQ:ADBE related to AI and its current "value" (compared purely to the rest of tech), solid health, etc., I am personally going long at $347.44. More shares will be gathered if the price reaches the low $300's or between $280-$300 and the fundamentals remain the same. Only major warning is the amount of insider selling.
Targets in 2028
$450.00 (+29.5%)
$645.00 (+85.6%)

Vimeo | VMEO | Long at $3.87Vimeo NASDAQ:VMEO provides a cloud-based platform for video creation, hosting, and sharing - primarily serving businesses, creators, and enterprises for professional video content management. While NASDAQ:VMEO has a **lot** of competition, it is a rather "healthy" company:
Debt-free (a rarity out there...)
Maintained profitability over the last twelve months, with a healthy gross profit margin of 78%
Earnings are forecast to grow 34.76% per year
[*}Revenue growth rate through 2027 is projected at 5.36% (modest)
Adjusted EBITDA guidance raised to $35 million, up from $25-30 million
Upcoming product developments, including AI-powered features and new SKUs, are expected to drive further growth
Insider bought over $868,000 in shares in the last year at an average price of $5.04
Subscriber growth is a concern...
From a technical analysis perspective, the stock price is currently near the bottom of my historical simple moving average bands. This region is typically an area of consolidation. The two open price gaps below the current price on the daily chart (down to $3.38) will likely get closed in the near-term before a move up. I do believe this is a risky investment, though, given the competition and economic headwinds. I would not be surprised if the market flipped and took this down near or below $1... But, if one is going purely by what the company reports concerning fundamentals and general growth, this is an undervalued stock in the $3 range.
Thus, if the insider/company hype is true, NASDAQ:VMEO is in a personal buy zone at $3.87 - with near-term risk of the stock dropping to close the price gaps on the daily chart down to $3.38... or below.
Targets into 2028:
$5.00 (+29.2%)
$6.40 (+65.4%)

Atlassian Corp | TEAM | Long at $180.12Atlassian Corp NASDAQ:TEAM
Technical Analysis:
Currently trading withing my historical simple moving average zone (i.e. reversion to the mean). This area is typically reserved for share accumulation. Many gaps above to close (as high as $420.80. I anticipate the price to stairstep up over the next few years as the company moves to AI.
Earnings and Revenue Growth
3x EPS growth by 2028 and revenue growth from ~$5 billion to ~$9 billion.
www.tradingview.com
Health
Debt-to-Equity: 0.73x (good)
Altman's Z-Score/Bankruptcy Risk: 6.8 (excellent/very low risk)
Insiders
Warning: Tremendous amount of selling.
openinsider.com
Action
Due to the high-growth potential of NASDAQ:TEAM and solid health, I am personally going long at $180.12. Only major warning is the amount of insider selling.
Targets in 2028
$223.00 (+23.8%)
$380.00 (+111.0%)

RFIL ready for breakout at earningsGreat small cap tech company working in connectivity has been performing very well.
The chart looks poised to jump if earnings are good, with a VCP pattern base consolidating.
If earnings are good, this could really jump.

NVIDIA Has it bottomed??NVIDIA Corporation (NVDA) broke last week below its 1D MA50 (blue trend-line) for the first time in 4 months (since May 06). That was perceived as the bullish trend's strongest Support and rightfully so technically.
The next level to watch as a Support is the 1D MA100 (green trend-line), which was the level that held and led the stock to its previous peak during the last strong bullish trend of October 31 2023 to June 20 2024.
As you can see, there was a situation similar to today's where the price again broke below the 1D MA50 during the uptrend but kept the 1D MA100 intact and rebounded. Still, it managed to touch the 0.236 Fibonacci retracement level.
As a result, there might be potential for one more weekly Leg down to $155.00 (Fib 0.236) before recovering but this would also most likely mean breaking below the 1D MA100. This is doubtful but not impossible but still there are higher probabilities of a rebound sooner.
A strong indicator that is in Support of this is the 1D RSI, which just touched its 2-year Support Zone, a level that has always been a 'Buy' whether short or long-term. As far as a Target is concerned, the 2024 Channel Up peaked on the -0.382 Fibonacci extension, which is at $245.00.
-------------------------------------------------------------------------------
** Please LIKE 👍, FOLLOW ✅, SHARE 🙌 and COMMENT ✍ if you enjoy this idea! Also share your ideas and charts in the comments section below! This is best way to keep it relevant, support us, keep the content here free and allow the idea to reach as many people as possible. **
-------------------------------------------------------------------------------
💸💸💸💸💸💸
👇 👇 👇 👇 👇 👇

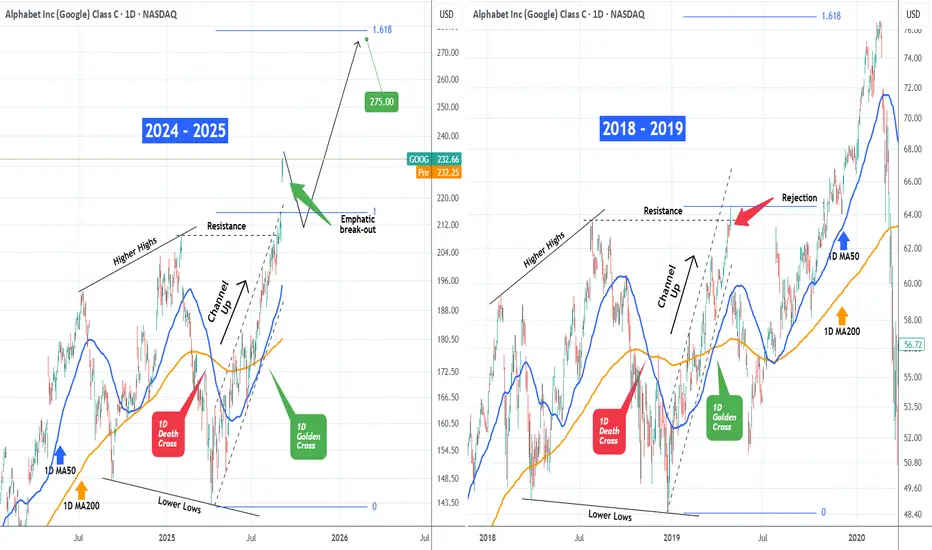
GOOGLE Massive weekly break-out! Is $275 next?Last time we took a look at Google (GOOG) was 3 months ago (May 29, see chart below), giving a strong buy signal within its then Channel Up, that hit our $197.00 Target in less than 2 months:
This week the stock has broken above its April - August 2025 Channel Up, soaring on the very positive news, breaching the $230.00 barrier. In fact, the whole 2024 - 2025 price action resembles the pattern of 2018 - 2019 up until the current break-out.
In April 29 2019 the price opened downwards massively, the opposite of what occurred now. After it found Support and rebounded a month later, Google eventually started a new long-term rally that almost reached the 1.618 Fibonacci extension.
We will apply a similar structure as we move forward, expecting the current fundamental euphoria to recede on the short-term, with our optimal technical buy being near the 1D MA50 (blue trend-line). After that, our long-term Target will be $275.00 (just below the 1.618 Fibonacci extension).
-------------------------------------------------------------------------------
** Please LIKE 👍, FOLLOW ✅, SHARE 🙌 and COMMENT ✍ if you enjoy this idea! Also share your ideas and charts in the comments section below! This is best way to keep it relevant, support us, keep the content here free and allow the idea to reach as many people as possible. **
-------------------------------------------------------------------------------
💸💸💸💸💸💸
👇 👇 👇 👇 👇 👇
Atlassian Corporation — September 02, 2025Sergio Richi Premium ✅
NASDAQ:TEAM #AtlassianCorporation — Atlassian Corporation (NASDAQ:TEAM) Insider Activity Report | Technology | Software - Application | USA | NASDAQ | September 02, 2025.
Price (Sept 2, 2025) : $172.66
On August 28, Director Scott Belsky bought 1,455 shares at $173.00 (~$252K). This is his first disclosed purchase. Unlike CEO sales under pre-arranged 10b5-1 plans, this was an open-market buy—at levels that insiders view as undervalued following strong FY25 results.
(SEC Form 4)
www.sec.gov
1. Company Profile / Overview:
Atlassian Corporation (NASDAQ: TEAM) is a global leader in enterprise collaboration and productivity software. Its flagship products include Jira, Confluence, Trello, and Bitbucket, serving more than 300,000 organizations worldwide.
Atlassian’s strategy is anchored in:
• Cloud transition – shifting its massive install base from on-prem to recurring cloud revenues.
• AI integration – with over 2.3 million active AI users and a strategic partnership with Google Cloud to scale adoption.
• Enterprise expansion – record multi-million-dollar contracts, deeper penetration into Fortune 500.
• Financial strength – FY25 revenue hit $5.22B (+19.7% YoY), with cloud revenue up 26%. Free cash flow reached $1.4B, giving the company flexibility for reinvestment and M&A.
Insiders own ~37% of the stock, institutions ~53%—a rare alignment of interests between management and Wall Street.
2. Institutional Flows (Q2 2025):
• FMR (Fidelity): +74%
• D.E. Shaw: +321%
• Two Sigma: +285%
• Vanguard: +2.6% (largest holder at 17.4M shares)
Net effect: significant inflows despite a -30% YTD drawdown.
Charts:
• (2W)
TEAM seasonality:
TEAM Hedge Fund Flows:
TEAM Ownership:
3. The setup:
TEAM has defended the $170 support zone. Belsky’s buy at $173 validates this level as institutional demand. A breakout above $190 could accelerate momentum, with the next resistance in the $220–235 range.
Entry : $172–173
🎯 Take Profit 1: $235 (+36.1%)
🎯 Take Profit 2: $273 (+58.0%)
Insider conviction, institutional accumulation, and strong AI/Cloud fundamentals line up with a bullish long-term setup. Risk/reward skews heavily to the upside. I’m targeting +36–58% upside in the next 6–12 months as TEAM extends its global uptrend.

AFRM - NEW 52-WEEK HIGHAFRM - CURRENT PRICE :88.46
AFRM made a new 52-week high last Friday with burst in trading activity. The 52-week high resistance level near 82.00 - 83.00 is considered significant resistance level based on the share price history as it had been touched several times. One of the bullish signs for this stock is that the RSI is moving above 50 level steadily since 27 May 2025 - look at the red circle. Take note also that there is a rising support line - indicating demand is getting higher. There is possibility that the stock may trend higher in near term.
ENTRY PRICE : 83.00 - 89.00
TARGET : 97.00 and 104.00
SUPPORT : 78.00
Notes : For chart pattern lovers, look at the heliview chart (bigger picture). There is a CUP & HANDLE pattern !

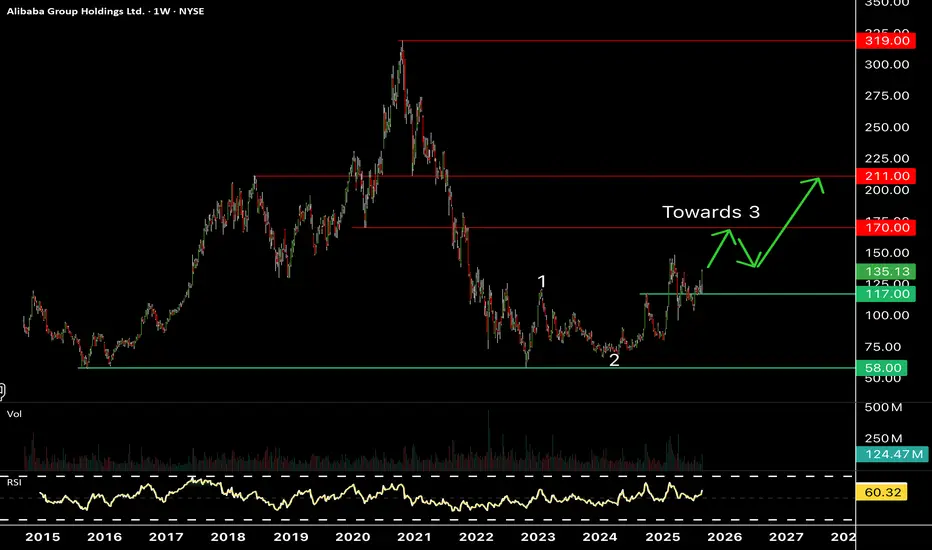
Alibaba looking to move higherToday's results seem to have trigger Alibaba for much higher levels. The market seems to have appreciated the growth of its cloud and AI business as well as its new AI chips.
Chinese big cap techs are much cheaper than US counterparts and seem to be presenting interesting opportunities.
Next resistance/target in the $170 area as long as $117 support is holding.
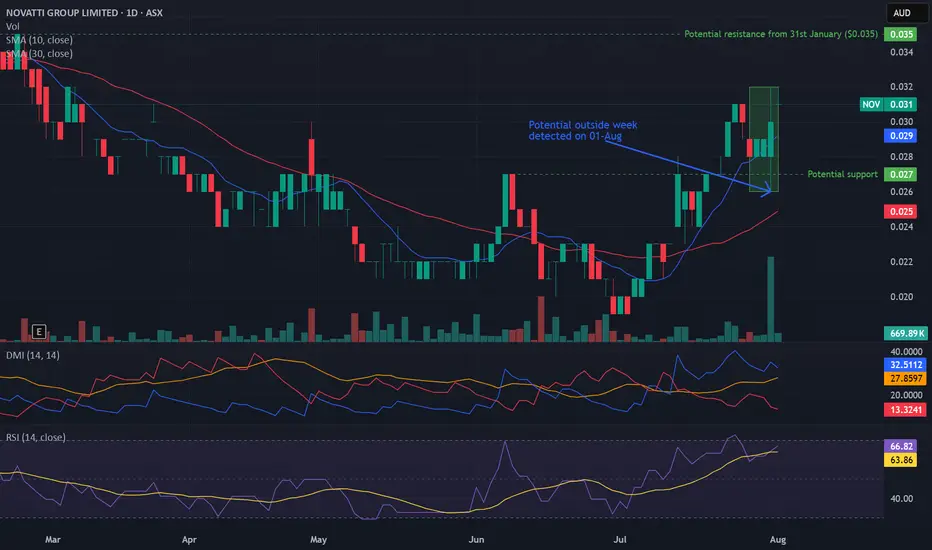
Potential outside week and bullish potential for NOVEntry conditions:
(i) higher share price for ASX:NOV above the level of the potential outside week noted on 31st July (i.e.: above the level of $0.032).
Stop loss for the trade would be:
(i) below the low of the outside week on 31st July (i.e.: below $0.026), should the trade activate.
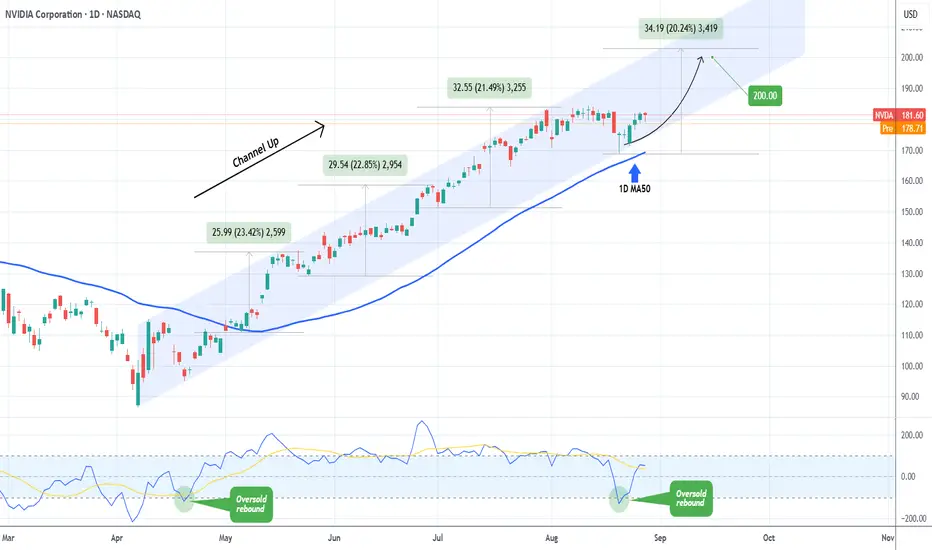
NVIDIA Is it still a buy after its Earnings release?NVIDIA Corporation (NVDA) delivered stronger-than-expected second-quarter earnings on Wednesday, but its data center revenue came in slightly below forecasts as U.S. restrictions on H20 chip sales to China weighed on results. The result was a 3.1% fall on the company's stock in after-hours trading following the report.
The obvious question is this: Is it still a buy?
The answer can be given by purely looking at the technicals. Based on the bigger picture, the stock's 5-month pattern remains a Channel Up since the April 07 bottom, and in fact the recent dip on August 20 was a Higher Low exactly on the pattern's bottom and almost on the 1D MA50 (blue trend-line), which has been intact since May 06.
Given also the fact that the 1D CCI rebounded with aggression after marginally breaking below its oversold level (-100.00), similar to April 21, we expect NVIDIA to resume the bullish trend and extend this new Bullish Leg.
Since the last three Bullish Legs have all increased by a little more than +20%, we expect the price to easily reach our $200.00 long-term Target, before the next technical correction occurs.
-------------------------------------------------------------------------------
** Please LIKE 👍, FOLLOW ✅, SHARE 🙌 and COMMENT ✍ if you enjoy this idea! Also share your ideas and charts in the comments section below! This is best way to keep it relevant, support us, keep the content here free and allow the idea to reach as many people as possible. **
-------------------------------------------------------------------------------
💸💸💸💸💸💸
👇 👇 👇 👇 👇 👇
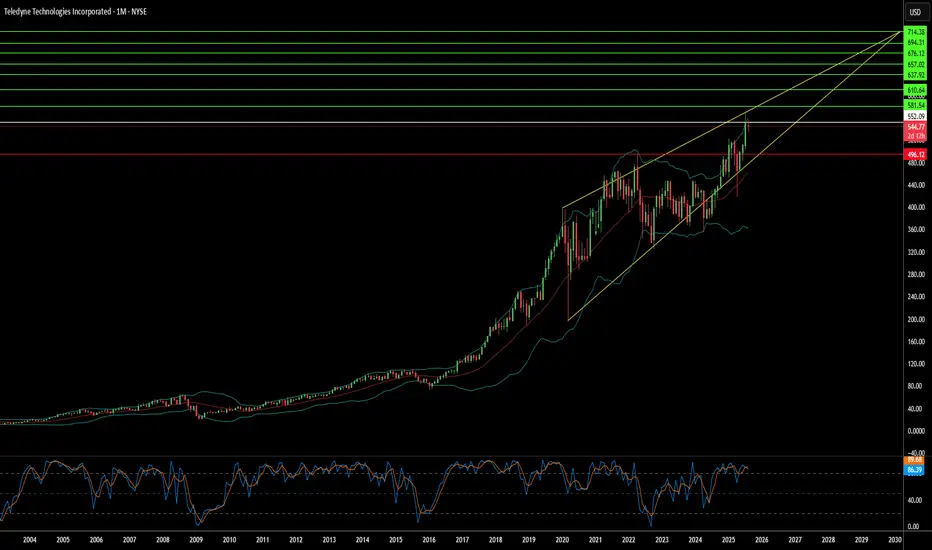
How Does a Silent Giant Dominate Critical Technologies?Teledyne Technologies has quietly established itself as a formidable force across defense, aerospace, marine, and space markets through a disciplined strategy of strategic positioning and technological integration. The company recently reported record Q2 2025 results with net sales of $1.51 billion (10.2% increase) and demonstrated exceptional organic growth across all business segments. This performance reflects not market timing but the culmination of deliberate long-term positioning at the intersection of mission-critical, high-barrier-to-entry markets where geopolitical factors create natural competitive advantages.
The company's strategic acumen is exemplified by products like the Black Hornet Nano micro-UAV, which has proven its tactical value in conflicts from Afghanistan to Ukraine, and the emerging Black Recon autonomous drone system for armored vehicles. Teledyne has strengthened its market position through geopolitically aligned partnerships, such as its collaboration with Japan's ACSL for NDAA-compliant drone solutions, effectively turning regulatory compliance into a competitive moat against non-allied competitors. The 2021 acquisition of FLIR Systems for $8.2 billion demonstrated horizontal integration mastery, with thermal imaging technology now deployed across multiple product lines and market segments.
Teledyne's competitive advantage extends beyond products to intellectual property dominance, holding 5,131 patents globally with an exceptional 85.6% USPTO grant rate. These patents span imaging and photonics (38%), defense and aerospace electronics (33%), and scientific instrumentation (29%), with frequent citations by industry giants like Boeing and Samsung indicating their foundational nature. The company's $474 million annual R&D investment, supported by 4,700 engineers with advanced degrees, ensures continuous innovation while building legal barriers against competitors.
The company has proactively positioned itself to meet emerging regulatory requirements, particularly the Department of Defense's new Cybersecurity Maturity Model Certification (CMMC) mandate, which takes effect in October 2025. Teledyne's existing cybersecurity infrastructure and certifications provide a crucial advantage in meeting these standards, creating an additional "compliance moat" that will likely enable the company to capture increased defense contract opportunities as competitors struggle with new requirements.
Opera Limited | OPRA | Long at $16.68Opera Limited NASDAQ:OPRA is best known for its web browsers (Opera, Opera GX, and Opera One - which integrates advanced AI features and enhanced tab management). The company has expanded its portfolio to include mobile browsers, advertising technology, and other internet consumer products, positioning itself as a leader in delivering personalized and secure browsing experiences. With a focus on AI-driven tool and a growing user base, Opera serves millions of users worldwide, particularly in emerging markets.
The growth projections for NASDAQ:OPRA look great due to its expansion of AI-driven features, growth in advertising revenue, and penetration in emerging markets. Revenue is excepted to rise 15-25% year-over-year into 2026 and 10-20% year-over-year in 2027. NASDAQ:OPRA is extremely healthy, with a debt-to-equity of 0.01x, Quick Ratio of 2.43x, and extremely low bankruptcy risk. Also, there is a nice 4.7% dividend with share ownership. Low float: 83 million.
From a technical analysis perspective, the stock is (currently) bouncing off my historical simple moving average channel and has very strong upward momentum. While the price could enter my historical simple moving average channel in the near-term ($13-$15), I think the momentum is there to take it higher to fill the major gap on the daily chart between $26.25 - $26.98. It will likely take some time, but lower interest rates and new AI tools/news may fuel a positive rally long-term.
Unless, the market flips...
Thus, at $16.68, NASDAQ:OPRA is in a personal buy zone with short-term risk for a drop near $13.
Targets into 2028:
$22.00 (+31.9%)
$26.75 (+60.4%)

Resideo Technologies, Inc. ~ Bullish (Short-term)...Resideo Technologies, Inc. engages in the manufacture and development of technology-driven products and solutions that provide critical comfort, energy management, water management, and safety and security solutions to residential and commercial markets. It operates through the Products and Solutions, and ADI Global Distribution segments. The Products and Solutions segment offers temperature and humidity control, thermal water and air solutions, as well as security panels, sensors, peripherals, communications devices, video cameras, other home-related lifestyle convenience solutions, cloud infrastructure, installation, and maintenance tools, and related software. The ADI Global Distribution segment provides low-voltage security products including security and life safety, access control and video products and participates significantly in the broader related markets of smart home, power, audio, ProAV, networking, communications, wire and cable, and data communications. The company was founded on April 24, 2018 and is headquartered in Scottsdale, AZ.

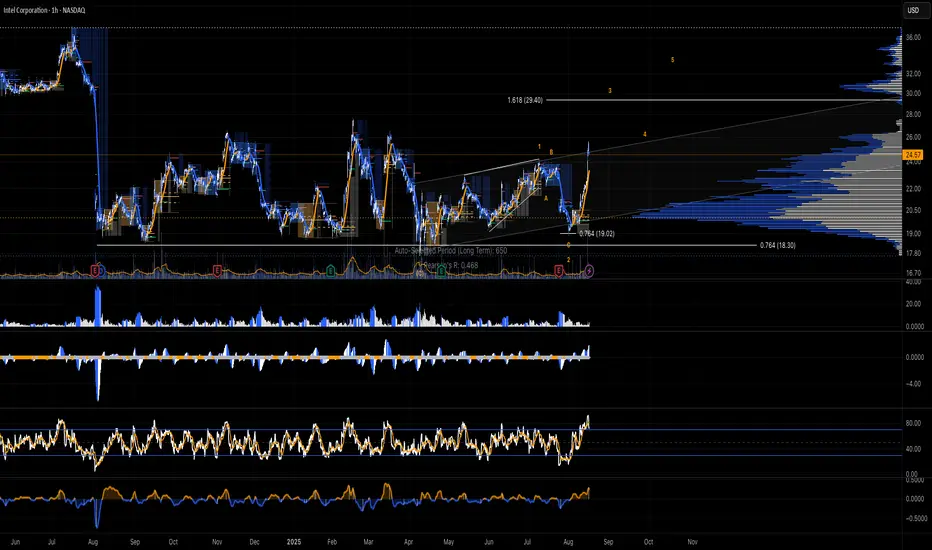
Intel Corp. $INTC ~ Bulls in Charge...Intel Corp. engages in the design, manufacture, and sale of computer products and technologies. It delivers computer, networking, data storage, and communications platforms. The firm operates through the following segments: Client Computing Group (CCG), Data Center and AI (DCAI), Network and Edge (NEX), Mobileye, Accelerated Computing Systems and Graphics (AXG), Intel Foundry Services (IFS), and All Other. The CCG segment consists of platforms designed for notebooks, 2-in-1 systems, desktops, tablets, phones, wireless and wired connectivity products, and mobile communication components. The DCAI segment delivers solutions to cloud service providers and enterprise customers, along with silicon devices for communications service providers and high-performance computing customers. The NEX segment offers computing system solutions from inflexible fixed-function hardware to general-purpose compute, acceleration, and networking devices running cloud native software on programmable hardware. The Mobileye segment develops driving assistance and self-driving solutions. The AXG segment provides products and technologies designed to help customers solve the toughest computational problems. Its products include CPUs for high-performance computing and GPUs targeted for a range of workloads and platforms, from gaming and content creation on client devices to delivering media and gaming in the cloud, and the most demanding high-performance computing and AI workloads on supercomputers. The IFS segment refers to full stack solutions created from the foundry industry ecosystem. The All Other segment represents results from other non-reportable segments and corporate-related charges. The company was founded by Robert Norton Noyce and Gordon Earle Moore on July 18, 1968 and is headquartered in Santa Clara, CA.