AMD Trade Setup | AI Leadership + Strong Earnings MomentumAdvanced Micro Devices NASDAQ:AMD remains a key name in the ongoing AI and semiconductor rally. Just ahead of earnings, AMD announced a $1B partnership with the U.S. Department of Energy (DOE) (Oct. 27), a major validation of its role in high-performance computing. This bullish development set the stage for strong momentum into the earnings release.
🚀 Earnings Recap:
AMD delivered a solid Q3 report with 36% YoY revenue growth, margin expansion, and upbeat guidance. The Client and Data Center segments led the charge, while Embedded was softer. With macro support for semiconductors and increasing AI investment, market sentiment remains bullish.
🔧 Trade Plan:
Entry: $224
Take Profit 1: $248
Take Profit 2: $267
Stop Loss: $211
Techstocks

AMAZON flashing a massive 5-year Sell Signal.More than 5 months ago (May 28, see chart below), we gave a strong buy signal on Amazon Inc. (AMZN), which last Friday hit our $255 Target:
This time we come across a massive Sell Signal on the 1W time-frame as the price hit (and is so far being rejected on) the 5-year Higher Highs trend-line that started back on the August 31 2020 Top.
We can see that during that period of time, Amazon had started a Triple Top formation that eventually led to the final rejection and the start of the 2022 Bear Cycle. Until we can talk about such a correction, we can expect at least a pull-back to its 1W MA50 (blue trend-line) as all of those 2020/21 rejections did. As a result, our medium-term Target on Amazon is $220.
Notice also the similarities between the 1W RSI sequences between the two fractals (2020/21 and 2024/25), both forming Lower Highs patterns.
-------------------------------------------------------------------------------
** Please LIKE 👍, FOLLOW ✅, SHARE 🙌 and COMMENT ✍ if you enjoy this idea! Also share your ideas and charts in the comments section below! This is best way to keep it relevant, support us, keep the content here free and allow the idea to reach as many people as possible. **
-------------------------------------------------------------------------------
💸💸💸💸💸💸
👇 👇 👇 👇 👇 👇

APPLE First correction signals in 7 months start to emerge.Almost 1.5 month ago (September 19, see chart below), we gave a buy signal on Apple Inc. (AAPL), which recently hit our $273 Target:
This time we go back to our long-term perspective and view Apple on the 1W time-frame, as the Bullish Leg (green) since the April 07 bottom, is approaching the top (Higher Highs trend-line) of the 4-year Channel Up.
The previous Bullish Leg peaked just below the 1.236 Fibonacci extension, so we can't rule out one final push to round $285 but on the long-term, a technical pull-back is favored.
The 2023 Bullish Leg eventually corrected on the 1W MA50 (blue trend-line), hitting its 0.382 Fibonacci retracement level at the same time. Even the smaller April - July 2024 Leg pulled-back to he 0.5 Fib.
All of those Channel Up tops have been also met with a 1W RSI break above the 70.00 oversold level, which is something that hasn't taken place yet. Similarly the 1W MACD hasn't started to reverse on the levels of most of previous tops.
In any case, we expect to see Apple hitting $236 at least on the long-term, which is its 0.382 Fib and marginally below the 1W MA50.
-------------------------------------------------------------------------------
** Please LIKE 👍, FOLLOW ✅, SHARE 🙌 and COMMENT ✍ if you enjoy this idea! Also share your ideas and charts in the comments section below! This is best way to keep it relevant, support us, keep the content here free and allow the idea to reach as many people as possible. **
-------------------------------------------------------------------------------
💸💸💸💸💸💸
👇 👇 👇 👇 👇 👇

META Buy Opportunity – KZDZ ModelMETA Game Plan – KZDZ Model
📊 Market Sentiment
On 29/10, the FED lowered rates by 25BPS, as expected. However, Powell’s remarks added uncertainty around further cuts in December, stating that future decisions will be data-dependent.
One FED member dissented, preferring no cut this cycle — a notable shift from September’s unanimous decision.
Following this, rate-cut expectations dropped from 95% to 68%, sparking short-term bearish sentiment as traders took profits and hedged exposure.
Despite this volatility, the mid-to-long term outlook remains bullish given the broader liquidity cycle and easing policy stance.
📈 Fundamental
META earnings missed expectations, triggering a sharp sell-off. While short-term sentiment is bearish, the long-term outlook remains supported by ongoing AI development initiatives.
📈 Technical Analysis
1-Hit oversold RSI on the daily timeframe.
2-Retraced to the 0.5 Fibonacci equilibrium zone (≈ $640).
3-Tested a major HTF Key Zone around $625, signaling potential accumulation.
📘 Model in Use – Key Zone with Discount Zone (KZDZ Model)
The KZDZ Model identifies areas where discounted Fibonacci levels align with strong HTF liquidity zones, offering high-probability reversal opportunities.
1️⃣ Identify HTF Key Zone
2️⃣ Align with Discount Zone (0.5–0.75 range)
3️⃣ Look for confirmation structure on LTF
4️⃣ Execute and manage risk accordingly
📌 Game Plan
Scenario 1 (Black Path): Watch for price to hit $625 and close above $640 (daily). Upon confirmation, plan to buy C640 options targeting $680–$700.
Scenario 2 (Red Path): If price fails to reclaim $640, monitor for a deeper move to $560, then look for weekly rejection above that zone. Entry via C560 options, targeting $620–$700.
🎯 Setup Trigger
Scenario 1 → Daily close above $640 after retesting $625.
Scenario 2 → Weekly close above $560 zone.
📋 Trade Management
Scenario 1: Buy C640 Calls → take profits at $680–$700.
Scenario 2: Buy C560 Calls → partial profits $620–$640, rest at $680–$700.
Move stop to breakeven after first target is hit.
💬If this META breakdown supports your outlook, like, comment, and follow.
For deeper sentiment and strategy updates, subscribe to my Substack free access available.
⚠️ This analysis is for educational purposes only and does not constitute financial advice. Always conduct your own research before trading or investing.

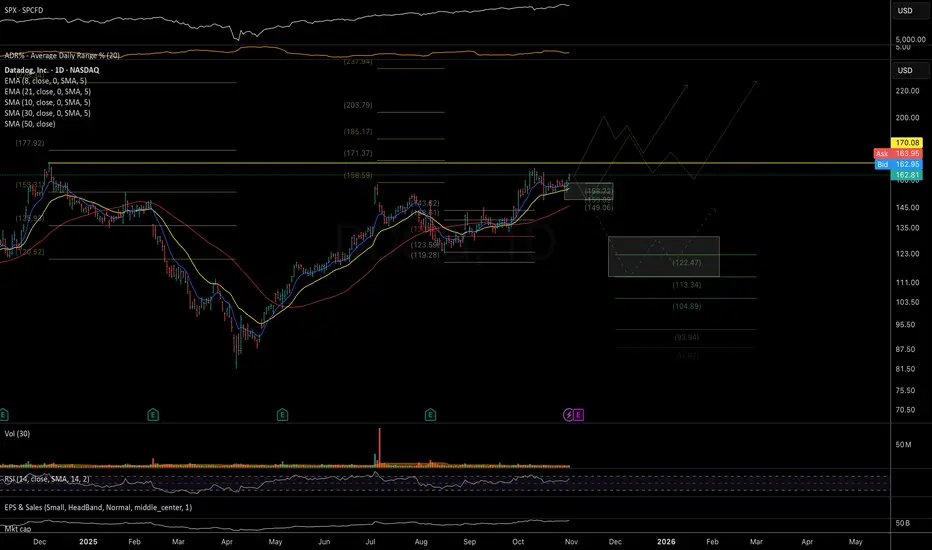
DDOG: interesting macro potential Interesting large multi-year VCP formation. Earnings are on Nov 6. While there’s still a chance that the correction from the June highs isn’t fully complete and that price is currently in a higher-degree bounce (running flat correction), I’ll be on the lookout for a potential (gap-up) earnings breakout.
If such a move occurs—especially if supported by a strong and positive catalyst—I’ll be watching for a delayed-reaction setup for a possible entry.
Chart:
Macro view:
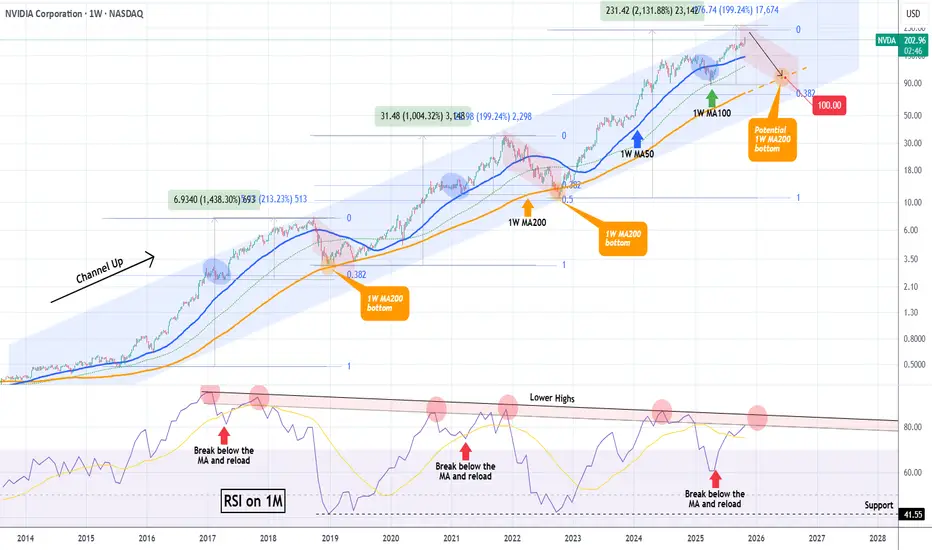
NVIDIA hit $5 Trillion but the end of the rally may be near.NVIDIA Corporation (NVDA) broke this week the $5 Trillion market cap barrier, becoming the first company to do so. In the meantime, it is extending the rally that started on the April 07 Low on the 1W MA100 (green trend-line), following the end of the Tariff War.
This rally has been nothing more than a part of the larger technical Bullish Leg inside the 10-year Channel Up that NVIDIA has been trading in. Within this pattern, the price has had rather asymmetric Bullish Legs in terms of rise % but has always been rejected at the top of the Channel Up and corrected back to the 1W MA200 (orange trend-line).
Following the mid-Bullish Leg corrections to the 1W MA50 (blue trend-line), the final rallies of the Bullish Legs before their Tops have been around +200%. Then their corrections/ Bearish Legs have always hit the 1W MA200 (as mentioned), with one time bottoming just above the 0.382 Fibonacci retracement level and the other below it (0.5 Fib).
We previously had NVIDIA's top at around $240, which is slightly below this expected +200% rise from the 1W MA100 bottom. As a result, we project that a potential contact with the 1W MA200 for the 2026 Bearish Leg can be achieved around $100, which is above the 0.382 Fib, similar to 2018.
Note that a very reliable Top indicator has also been the 1M RSI and its 9-year Lower Highs Zone. Every time the RSI entered the Zone and then broke below its MA (yellow trend-line) and rebounded, the next hit was the Bullish Leg's Top. Right now the 1M RSI is about to enter this Zone for the second time, indicating that we may be approaching the end of this long-term rally.
-------------------------------------------------------------------------------
** Please LIKE 👍, FOLLOW ✅, SHARE 🙌 and COMMENT ✍ if you enjoy this idea! Also share your ideas and charts in the comments section below! This is best way to keep it relevant, support us, keep the content here free and allow the idea to reach as many people as possible. **
-------------------------------------------------------------------------------
💸💸💸💸💸💸
👇 👇 👇 👇 👇 👇
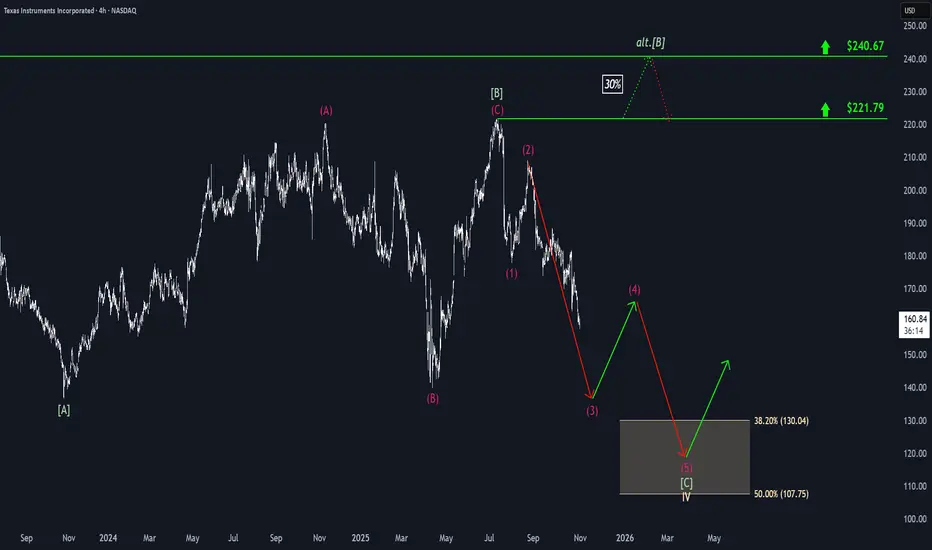
Texas Instruments: Extending DeclinesDespite some interim countermoves, Texas Instruments continued to see further sell-offs, advancing our primary scenario. Currently, we still see additional downside potential in magenta wave (3) before expecting a temporary rebound in wave (4). With wave (5), TXN is likely to dip into our beige Target Zone between $130.04 and $107.75, completing the broader correction of beige wave IV. There remains a 30% chance that a new (corrective) high in green wave alt. could still materialize, delaying the end of the correction. In this scenario, price would first move above resistance at $221.79 before reversing at the higher $240.67 level.
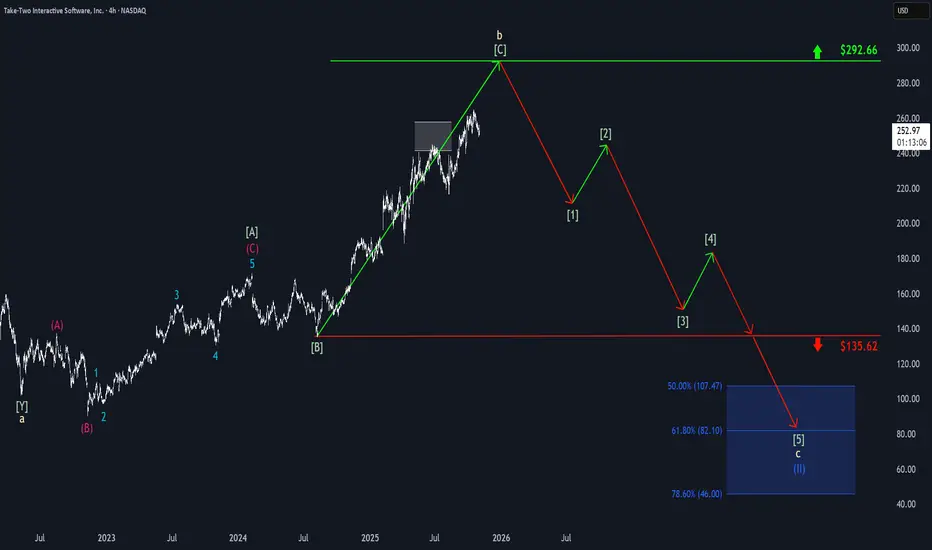
Take-Two: Momentum Fades, but Recovery ExpectedTake-Two’s upward momentum has faded recently, leading to a noticeable pullback. However, we expect the stock to rebound soon and resume the corrective advance of beige wave b, moving closer to resistance at $292.66. At that point, the stock is likely to reverse course and begin a green downward impulse, which should ultimately finalize the correction of blue wave (II). We have identified a blue Target Zone between $107.47 and $46 for this significant bottom.
ROCKET LAB has topped. Sell signal on Bearish Divergence.Last time we took a look at Rocket Lab (RKLB) was more than 5 months ago (May 12, see chart below) where we gave a Buy Signal exactly on the 1D MA50 and the price instantly reacted with a rebound, easily hitting our $32.00 Target:
This time we are getting a Sell Signal on the chart as despite the stock's Higher Highs, its 1D RSI has been trading under Higher Lows since July 17, exhibiting a Bearish Divergence. The last similar Bearish Divergence was seen on January 24 2025, which was RKLB's previous Channel Up Top.
That signal triggered a correction that extended all the way back to the 0.382 Fibonacci retracement level and hit the 1D MA200 (orange trend-line) before bottoming. As a result, we are now turning bearish on Rocket Lab, targeting $40.00 (Fib 0.382).
-------------------------------------------------------------------------------
** Please LIKE 👍, FOLLOW ✅, SHARE 🙌 and COMMENT ✍ if you enjoy this idea! Also share your ideas and charts in the comments section below! This is best way to keep it relevant, support us, keep the content here free and allow the idea to reach as many people as possible. **
-------------------------------------------------------------------------------
💸💸💸💸💸💸
👇 👇 👇 👇 👇 👇

BKKT: price in the support zone to decide on the next movePrice decided to pull back deeper into the support zone, following an alternative path suggested in the October update.
Watching for the nature of the reaction from current levels, as price might be finishing either the entire correction since October highs or just its first wave. In any case, I’m expecting at least a bounce in the coming days.
Chart:
Previously:
• On support (Oct 9, in weekly overview):
Chart:
On support zone and potential start of a new swing (Oct 14):
Chart:
www.tradingview.com

NTSK Netskope: the rocket is on the padNetskope’s shares (ticker NTSK) are trading after a successful IPO, but the chart suggests we’re still in early accumulation phase. The price is hovering in the ~$21-24 zone, and a breakout above near resistance is needed to confirm strength. The first target is $28, with potential extension toward $35–40 if the structure holds. Given IPO volatility, entry requires careful stop-management and confirmation of trend support.
Netskope operates in the rapidly expanding cloud security market (SASE/Zero Trust). With revenue growth exceeding 30% and narrowing losses, the company is well-positioned in the AI-security wave. While the TAM (total addressable market) is large and growth prospects strong, the business still faces profitability and competitive risks.
The rocket may not yet be launched, but the launchpad is set. Stay patient, wait for the “ignition” signal, and let the engine build thrust before liftoff.

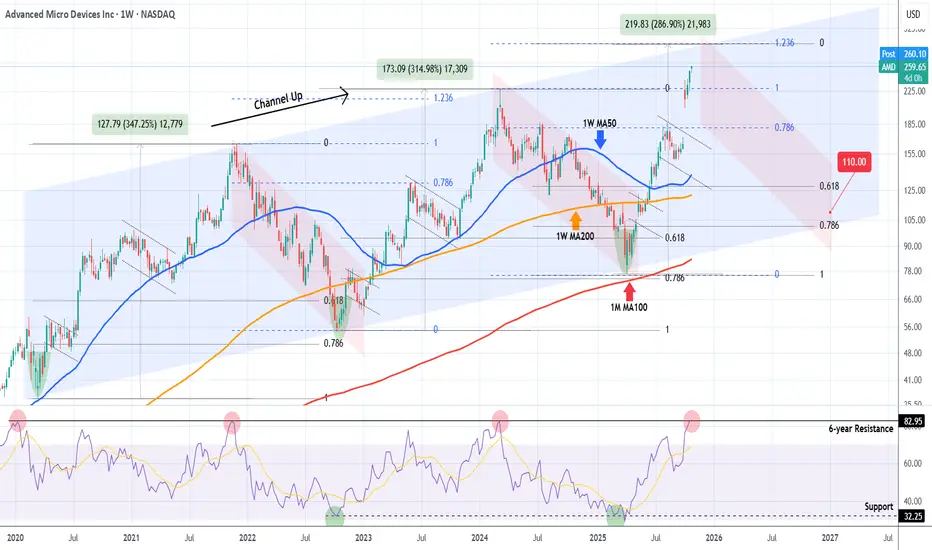
AMD Is it approaching a multi-year top and turning into a Sell ?Almost 8 months ago (March 07, see chart below) we made a bold call (for the time) on Advanced Micro Devices (AMD), expecting it to bottom on its 1M MA100 (red trend-line) and then rebound, targeting $320:
Well the Bullish Leg of its 6-year Channel Up had been even more aggressive than we expected and is already approaching its top (Higher Highs trend-line), much earlier than we expected.
This is technically the right time to book the amazing +240% profits from the April 07 bottom, as the 1W RSI just hit its 6-year Resistance, which has marked the Channel's two Tops.
Even though the Bullish Leg can technically extend as high as +287% on the 1.236 Fibonacci extension (like the previous did), the focus of a long-term investor should now be to buy (much) lower, preferably as close to the 1M MA100 as possible.
The last two Higher Lows of the Channel Up have been priced just above the 0.786 Fibonacci retracement level, so our fair long-term Target is currently at $110.00.
So do you also think AMD is approaching the end of the (long-term) road and is gradually turning into a Sell?
-------------------------------------------------------------------------------
** Please LIKE 👍, FOLLOW ✅, SHARE 🙌 and COMMENT ✍ if you enjoy this idea! Also share your ideas and charts in the comments section below! This is best way to keep it relevant, support us, keep the content here free and allow the idea to reach as many people as possible. **
-------------------------------------------------------------------------------
💸💸💸💸💸💸
👇 👇 👇 👇 👇 👇
LUMN: entering important resistance zonePrice held the support zone outlined in the September update and has since followed through in line with the suggested trend structure, now approaching a key mid-term resistance area at 8.40–9.70, where some form of topping behavior might develop.
Further clarity on potential mid-term support zones will emerge once there’s evidence of a top forming. For now, as long as the price remains above key EMAs (8/21 dEMA), upside momentum remains intact, with the potential to reach higher resistance levels — or even stage a blow-off move toward the November 2024 highs.
Chart:
Previously:
On support and upside potential (Sep 29):
Chart:
www.tradingview.com

SNDK: at macro resistance Price broke out through the resistance zone highlighted in the September update and continued to show strong upside momentum. However, the trend structure now appears substantially extended at current levels.
As long as the price remains below the 207–225 resistance zone, I expect selling pressure to start building, potentially leading to a pullback toward the 130–100 support area.
Chart:
Previously:
On resistance level (Sep 26):
Chart:
www.tradingview.com

PALANTIR sitting on a Buy Zone. Target $220.Palantir (PLTR) has been trading within a Channel Up since early May and is currently consolidating on its bottom (Higher Lows trend-line). while holding he 1D MA50 (red trend-line). The 4H MA50 (blue trend-line) - 1D MA50 range has been technically the most optimal buy zone of this pattern.
With the 4H RSI exhibiting a Bull Flag similar to May - June, we expect the stock to aim for at least its 2.618 Fibonacci extension at $220.00. If broken, it may extend for an end-of-year rally to $255.00 completing a +80% Bullish Leg similar to the Channel's first.
-------------------------------------------------------------------------------
** Please LIKE 👍, FOLLOW ✅, SHARE 🙌 and COMMENT ✍ if you enjoy this idea! Also share your ideas and charts in the comments section below! This is best way to keep it relevant, support us, keep the content here free and allow the idea to reach as many people as possible. **
-------------------------------------------------------------------------------
💸💸💸💸💸💸
👇 👇 👇 👇 👇 👇

RIVIAN Triangle to give one more rally?Rivian Automotive (RIVN) has been trading within a 1.5 year Triangle pattern, with the price currently consolidating just below both the 1D MA50 (blue trend-line) and 1D MA200 (orange trend-line).
All previous Higher Lows of the pattern have been priced on at least the 0.786 Fibonacci retracement level, which is currently just below or when the 1D RSI approaches the 30.00 oversold level.
As a result, we expect a rebound near the bottom of the pattern, targeting its top (Lower Highs trend-line) at $15.75.
-------------------------------------------------------------------------------
** Please LIKE 👍, FOLLOW ✅, SHARE 🙌 and COMMENT ✍ if you enjoy this idea! Also share your ideas and charts in the comments section below! This is best way to keep it relevant, support us, keep the content here free and allow the idea to reach as many people as possible. **
-------------------------------------------------------------------------------
💸💸💸💸💸💸
👇 👇 👇 👇 👇 👇

RGTI : First Long Position AreaNASDAQ listed Rigetti Computing Inc. stock is currently trading above the 50 and 200 period moving averages.
Once it gained momentum, it later lost it but its outlook is not weak at the moment.
Right now, if the Iran-Israel war uncertainty is overcome and if there is no bad news affecting the index, the gap may close.
Risk/Reward ratio of 3.00 is a very valuable ratio to try with small position amounts.
Risk/Reward Ratio : 3.00
Stop-Loss : 9.91
Take-Profit : 18.2
Regards.

TESLA New Bullish Leg to $600 has started.Last time we took a look at Tesla (TSLA) more than a month ago (September 11, see chart below), we gave a massive buy signal that worked out instantly, as we saw the resemblances between the recent Triangle accumulation pattern and that of late 2024, setting a $600 long-term Target:
This time we take a better look at the Channel Up that has emerged. Technically it looks like a Bearish Leg (red Channel Down) has ended and with the 1D MA50 (blue trend-line) holding, a new Bullish Leg has been initiated.
The previous Bullish Leg, which by the way started after a 1D MA100 (green trend-line) hold, rose by +59.26%. This puts the next Higher High technically above our $600 long-term Target.
Notice also how the 1D MACD is about to form a new Bullish Cross, with all previous ones being a strong Buy Signal. At the same time, the 1D RSI found support and bounced on its 5-month Higher Lows trend-line.
-------------------------------------------------------------------------------
** Please LIKE 👍, FOLLOW ✅, SHARE 🙌 and COMMENT ✍ if you enjoy this idea! Also share your ideas and charts in the comments section below! This is best way to keep it relevant, support us, keep the content here free and allow the idea to reach as many people as possible. **
-------------------------------------------------------------------------------
💸💸💸💸💸💸
👇 👇 👇 👇 👇 👇

$MAGS: Magnificent Seven ETF – Tech Titan or Overhyped?(1/9)
Good afternoon, everyone! ☀️ CBOE:MAGS : Magnificent Seven ETF – Tech Titan or Overhyped?
With MAGS at $46.85, is this ETF a powerhouse of tech giants or just another bubble waiting to burst? Let’s decode the code! 🔍
(2/9) – PRICE PERFORMANCE 📊
• Current Price: $ 46.85 as of Mar 18, 2025 💰
• Recent Move: Likely up, reflecting tech sector strength, per data 📏
• Sector Trend: Tech stocks soaring with AI and cloud hype 🌟
It’s a tech fest—let’s see if it’s worth the buzz! ⚙️
(3/9) – MARKET POSITION 📈
• Market Cap: Approx $1.87B (assuming 40M shares) 🏆
• Operations: Tracks Apple, Microsoft, Amazon, Alphabet, Meta, Tesla, Nvidia ⏰
• Trend: Dominant players in tech, driving innovation and market trends 🎯
Firm in the heart of Silicon Valley! 🚀
(4/9) – KEY DEVELOPMENTS 🔑
• Tech Rally: Magnificent Seven companies hit new highs, per data 🌍
• Earnings Season: Strong Q4 results from underlying firms, per posts on X 📋
• Market Reaction: MAGS up, reflecting sector momentum 💡
Navigating through tech’s highs and lows! 🛢️
(5/9) – RISKS IN FOCUS ⚡
• Regulatory Scrutiny: Antitrust concerns for big tech players 🔍
• Market Volatility: Tech stocks prone to swings due to innovation and competition 📉
• Economic Factors: Interest rates and global economic conditions impact growth ❄️
It’s a risky ride—buckle up! 🛑
(6/9) – SWOT: STRENGTHS 💪
• Industry Leaders: The Magnificent Seven are pioneers in their fields 🥇
• Growth Potential: AI, cloud computing, and other tech trends fuel expansion 📊
• Dividend Payouts: Some companies offer dividends, adding income potential 🔧
Got the best of both worlds! 🏦
(7/9) – SWOT: WEAKNESSES & OPPORTUNITIES ⚖️
• Weaknesses: High valuations, potential for overinvestment 📉
• Opportunities: Emerging technologies like quantum computing, biotech integration, per strategy 📈
Can they stay ahead of the curve? 🤔
(8/9) – POLL TIME! 📢
MAGS at $46.85—your take? 🗳️
• Bullish: $50+ soon, tech’s unstoppable 🐂
• Neutral: Steady, risks balance gains ⚖️
• Bearish: $40 looms, overhyped and due for correction 🐻
Chime in below! 👇
(9/9) – FINAL TAKEAWAY 🎯
MAGS’s $46.85 price reflects the dynamism of the tech sector 📈, but with risks from valuations and regulatory pressures 🌿. DCA-on-dips could be a strategy to manage volatility. Gem or bust?

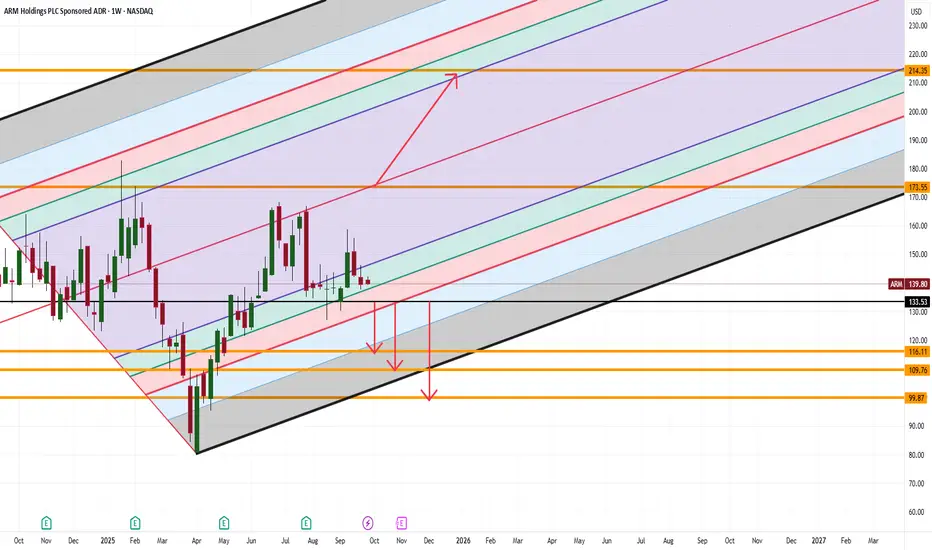
ARM Traders Won’t Like This SetupARM Holdings is sitting at a pivotal zone, and the next move could be brutal for one side of the market.
-If $133.53 breaks, momentum opens a slide toward $116, then $109, with $99 lurking as the deeper target.
-But if price can reclaim $173, the stage is set for a rally toward $213.
Here’s what makes this fascinating: most traders get tunnel vision on the current chop… while the real story is how violent ARM tends to move once it clears a range.
👉 The question isn’t if it moves, it’s which side gets trapped first.
How are you preparing for either outcome?
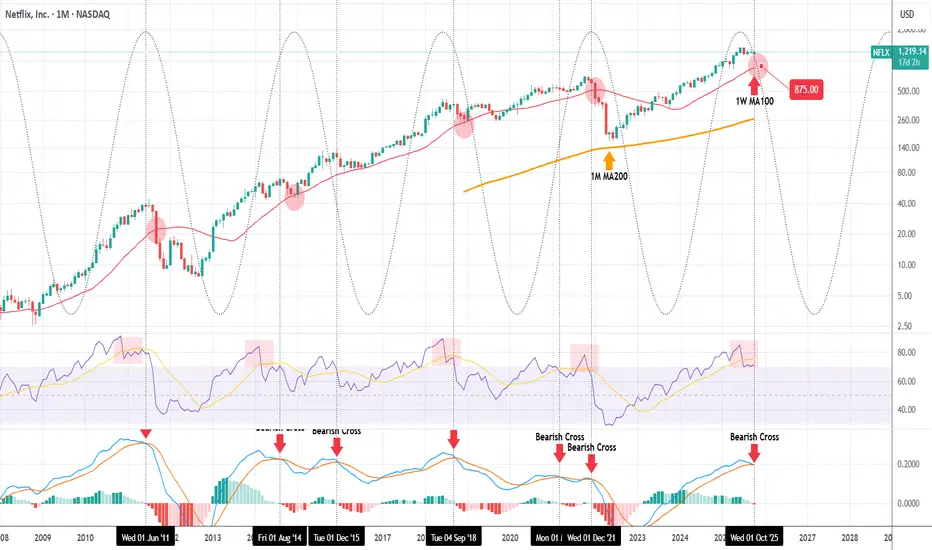
NETFLIX has topped and can pull back to $875.Netflix (NFLX) has formed one of its strongest Sell Signals in the last 15 years. That's the 1M MACD Bearish Cross.
The stock has been trading on a very consistent pattern ever since the 2008 U.S. Housing Crisis and during this multi-year span, the best indicator for a Top has been the 1M MACD forming a Bearish Cross.
As you can see, this month marks the 7th such occurrence since June 2011. All previous formations resulted in the price pulling-back to touch at least its 1W MA100 (red trend-line). Only two times the correction has been bigger that was that first Bearish Cross in June 2011 and the most recent December 2021, which almost hit the 1M MA200 (orange trend-line), the market's ultimate multi-decade Support.
These Top signals match fairly well the Sine Waves, which as you see form somewhat reliable Cycles. Those confirm that Netflix currently stands on a long-term Top. Even the 1M RSI is similar to the Top patterns suggested by the Sine Waves.
As a result, we expect the stock to start a multi-month technical pull-back, with a fair projection of making contact with its 1W MA100 being $875.00. That's our Target.
-------------------------------------------------------------------------------
** Please LIKE 👍, FOLLOW ✅, SHARE 🙌 and COMMENT ✍ if you enjoy this idea! Also share your ideas and charts in the comments section below! This is best way to keep it relevant, support us, keep the content here free and allow the idea to reach as many people as possible. **
-------------------------------------------------------------------------------
💸💸💸💸💸💸
👇 👇 👇 👇 👇 👇
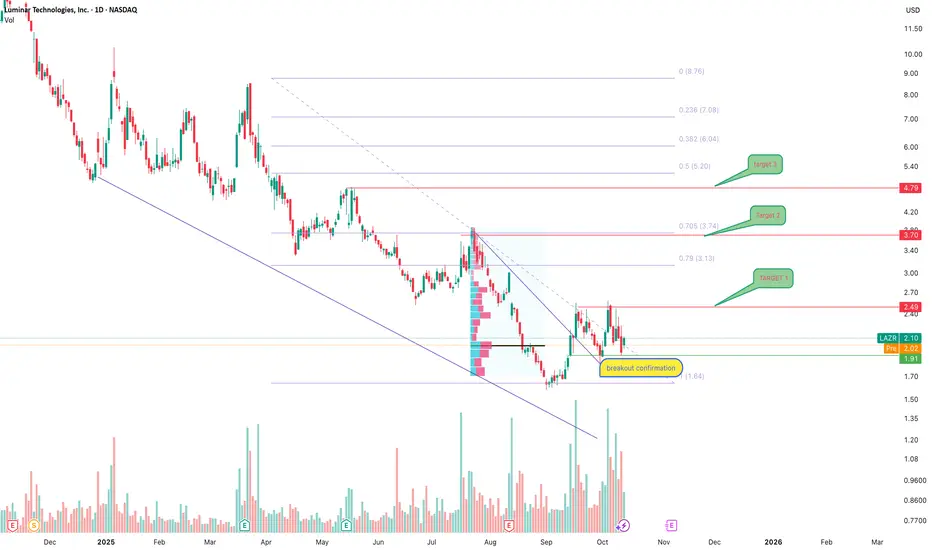
LAZR trend breakout and early recovery phaseLuminar Technologies (NASDAQ: LAZR) is showing the first signs of trend reversal after a prolonged decline. On the daily chart, the price broke the descending trendline and confirmed a breakout around the 1.90–2.00 zone, where accumulation started.
Technically, the 2.00–2.10 area acts as base support.
As long as the price stays above this level, the upside targets are 2.49 (TP1), 3.70 (TP2), and 4.79 (TP3) — all aligned with key Fibonacci levels. Rising volume supports the bullish bias.
From a fundamental perspective, Luminar remains a major player in the lidar industry, with partnerships including Volvo and Mercedes-Benz. Despite short-term pressure from higher rates, operational improvements and scaling could strengthen margins in the medium term.
This setup looks like an early recovery stage — the sentiment shifts slowly, but sustained support above 2.00 is the confirmation needed. Emotions aside — we wait for structure and confirmation.
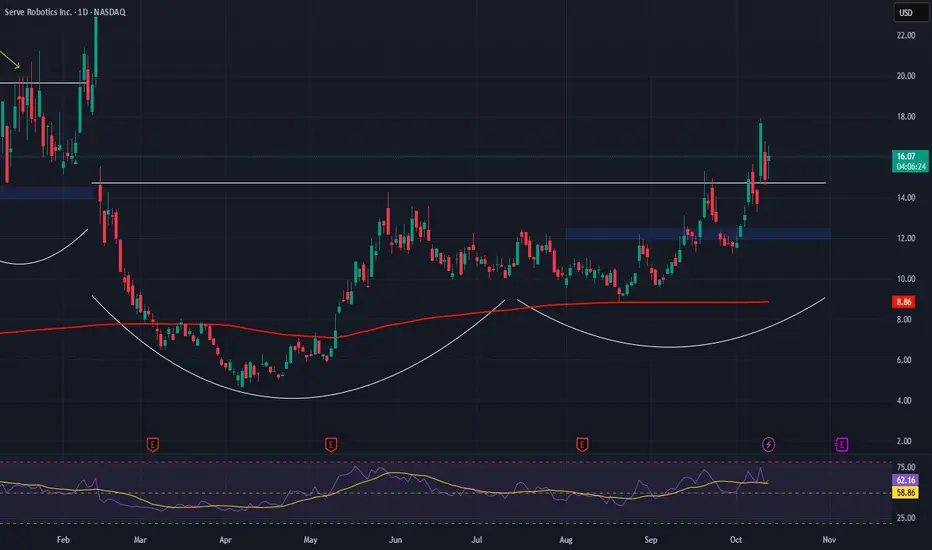
Serve Robotics Inc. (NASDAQ: SERV) – Bullish Setup EmergingServe Robotics NASDAQ:SERV is revolutionizing last-mile logistics with AI-powered delivery robots, offering strong exposure to the booming robotics and automation sector. The company's recent momentum and strategic partnerships signal major upside potential.
🔍 Key Drivers:
📈 Explosive Growth:
Q2 2025 revenue up 46% YoY
Deliveries jumped 80% QoQ
Clear signs of scaling and market demand
🤝 Uber Eats Partnership:
Multi-year deal to deploy 2,000 Gen3 robots in U.S. cities, including Chicago
Unlocks access to the projected $160B autonomous food delivery market by 2030
🌍 Long-Term Outlook:
Tied to ARK Invest’s $860B global robotics forecast
Targeting $60–80M annualized revenue once fully scaled
💰 Backed by Giants:
Supported by Uber and Nvidia
$167M raised in 2024 to fund expansion and AI development
📊 Trade Setup:
Bullish above: $12.00–$12.50
Upside target: $23.00–$24.00
Trend outlook: Strong momentum, backed by fundamentals and market demand