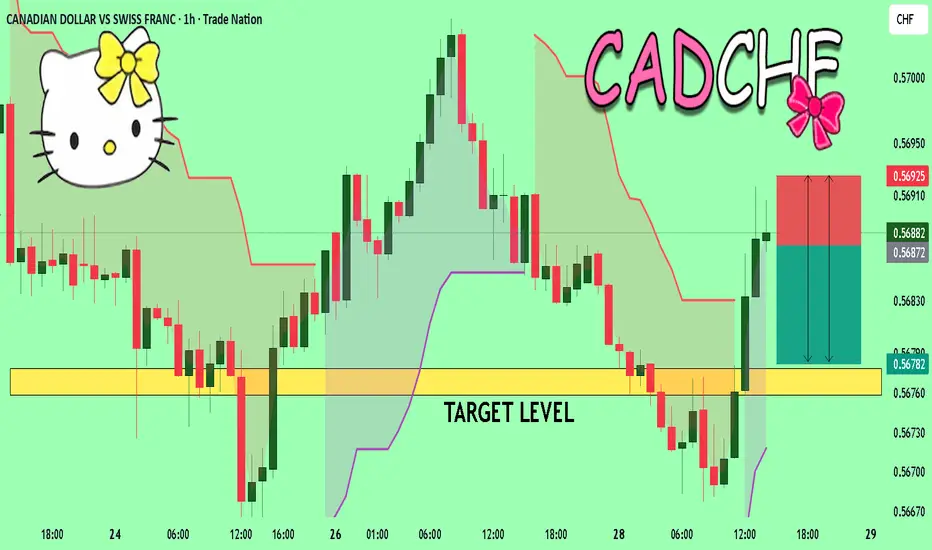
CADCHF A Fall Expected! SELL!
My dear followers,
I analysed this chart on CADCHFand concluded the following:
The market is trading on 0.5687 pivot level.
Bias - Bearish
Technical Indicators: Both Super Trend & Pivot HL indicate a highly probable Bearish continuation.
Target -0.5677
Safe Stop Loss - 0.5692
About Used Indicators:
A super-trend indicator is plotted on either above or below the closing price to signal a buy or sell. The indicator changes color, based on whether or not you should be buying. If the super-trend indicator moves below the closing price, the indicator turns green, and it signals an entry point or points to buy.
Disclosure: I am part of Trade Nation's Influencer program and receive a monthly fee for using their TradingView charts in my analysis.
———————————
WISH YOU ALL LUCK
Tecnicalanalysis
USDCHF: Growth & Bullish Continuation
Our strategy, polished by years of trial and error has helped us identify what seems to be a great trading opportunity and we are here to share it with you as the time is ripe for us to buy USDCHF.
Disclosure: I am part of Trade Nation's Influencer program and receive a monthly fee for using their TradingView charts in my analysis.
❤️ Please, support our work with like & comment! ❤️

GOLD: Long Signal with Entry/SL/TP
GOLD
- Classic bullish setup
- Our team expects bullish continuation
SUGGESTED TRADE:
Swing Trade
Long GOLD
Entry Point - 3901.6
Stop Loss - 3884.4
Take Profit - 3938.6
Our Risk - 1%
Start protection of your profits from lower levels
Disclosure: I am part of Trade Nation's Influencer program and receive a monthly fee for using their TradingView charts in my analysis.
❤️ Please, support our work with like & comment! ❤️

EURJPY The Target Is UP! BUY!
My dear friends,
EURJPY looks like it will make a good move, and here are the details:
The market is trading on 177.10 pivot level.
Bias - Bullish
Technical Indicators: Supper Trend generates a clear long signal while Pivot Point HL is currently determining the overall Bullish trend of the market.
Goal - 177.51
Recommended Stop Loss - 176.90
About Used Indicators:
Pivot points are a great way to identify areas of support and resistance, but they work best when combined with other kinds of technical analysis
Disclosure: I am part of Trade Nation's Influencer program and receive a monthly fee for using their TradingView charts in my analysis.
———————————
WISH YOU ALL LUCK

GBPJPY IDEA FOR 28, OCT 2025Overall, bearish momentum is evident. Sessional Bias is also bearish, but we expect a price retracement back up during LND. If the current structure holds, we prepare for more bearish lags and movements.
As usual, my calls or analysis are based on what we see, the current Bias, and from a probability standpoint, meaning that this projection may be or may not be validated, so tread carefully. As usual, this is not financial advice; trade responsibly.

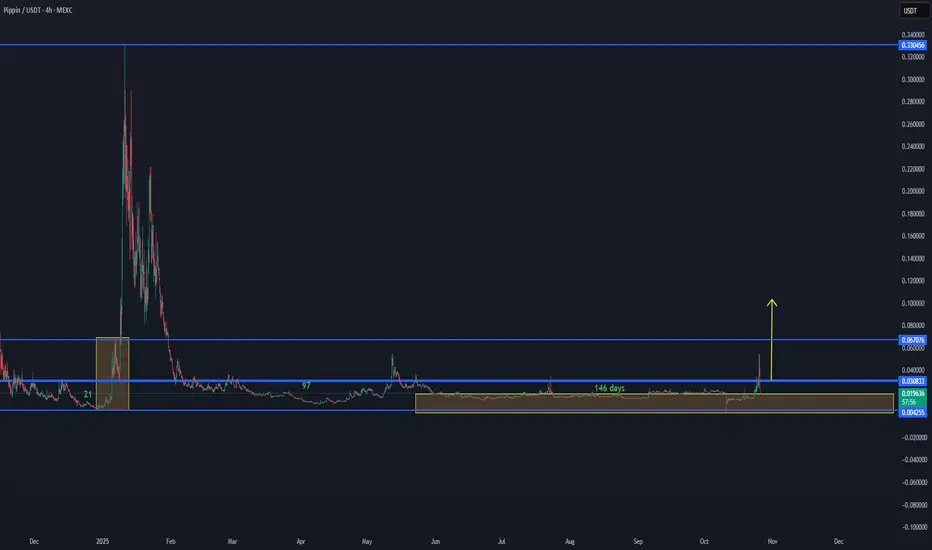
PIPPIN:USDT Market Outlook – Volume Range Formation💠 PIPPIN:USDT Market Outlook – Volume Range Formation
PIPPIN:USDT is showing early signs of new volume activation after an extended 146-day accumulation period within the lower range between 0.0042 – 0.0308 USDT.
This current setup indicates a potential volume range development, similar to the previous expansion phase observed earlier in the chart.
If momentum continues to build and volume sustains, the next major resistance zone sits around 0.067 USDT, followed by a broader target area toward 0.33 USDT on higher timeframes.
At this stage, stability above 0.018–0.020 USDT would confirm the base structure and strengthen the bullish outlook.
📊 Summary:
Range support: 0.0042 – 0.018 USDT
Key activation zone: 0.018–0.030 USDT
Target zones: 0.067 → 0.33 USDT
Structure: Accumulation → Early volume build-up
🔎 Focus: Watching for continuation of volume inflow and break above 0.0308 USDT to confirm next phase expansion.
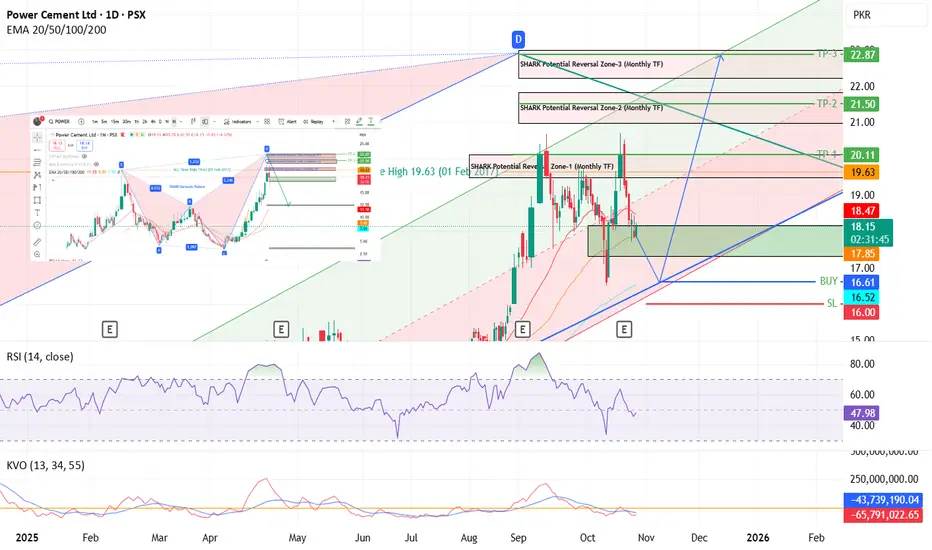
POWER - PSX - Technical Analysis - Monthly & DailyPOWER on Monthly Time Frame, has completed the SHARK Harmonic Pattern Zone-1 and has tested it twice and then price came down. It may even try to test Zone 2 or Zone 3 by taking support from Weekly Trend Line (Blue). Even presently price is in support zone (green) and may go up again from this zone.
A regression channel has also been drawn which price is following.
In my personal opinion, price will try to test SHARK Potential Reversal zone 3 before eventually coming down.
I recommend entering the trade as marked on the chart. From 17 to 23 in next 2 to 3 months is quite possible.
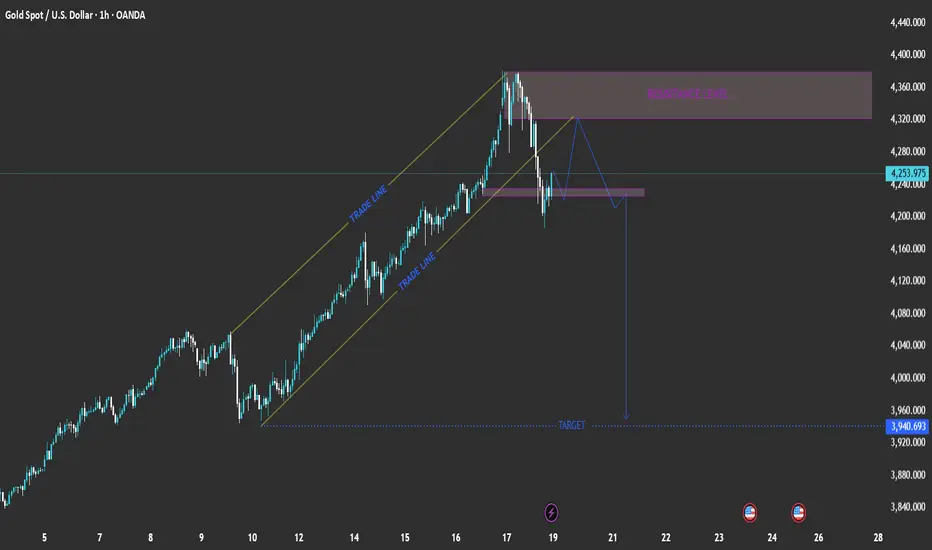
XAU/USD: Channel Breakout → Retest → Downside Target at 3,940EURONEXT:FTI1! EURONEXT:FTI1! EURONEXT:VU8F2026 EURONEXT:VM81! EURONEXT:VV6X2025 EURONEXT:V26X2025 EURONEXT:NS8Z2025 EURONEXT:YG8F2026 Pair: Gold Spot (XAU/USD)
Timeframe: 1-hour
Current Price: 4,253.975
Trend: Recently broke out of an ascending channel (bearish signal)
📉 Chart Breakdown
1. Ascending Channel (Trade Lines)
Price was moving steadily inside a rising channel, indicated by the two parallel yellow “TRADE LINE” levels.
The break below the lower trade line suggests weakening bullish momentum and potential trend reversal.
2. Resistance Level (4,320 – 4,360 zone)
Marked in purple, this zone served as a key resistance.
Price rejected strongly from this area, confirming seller presence.
3. Structure Retest and Potential Move
After the channel break, price retraced back to retest the broken channel support (now resistance).
The projected blue path shows a lower-high formation followed by a new drop, completing a bearish continuation pattern.
4. Target Zone
The projected target is near 3,940.693, aligning with previous structure support.
This level could serve as a profit-taking area for short positions.
📊 Summary of Key Levels
Zone Type Range / Level
4,320 – 4,360 Resistance Strong supply zone
4,220 – 4,240 Retest zone Potential short entry area
3,940 Target Bearish target / demand zone
⚙️ Trading Plan Concept (Hypothetical)
Bias: Bearish
Entry Idea: Wait for rejection from 4,220–4,240 zone.
Stop Loss: Above 4,280 (resistance)
Take Profit: Around 3,940 (target)
Risk/Reward: Approximately 1:3 or better
🧭 Conclusion
The chart suggests that Gold (XAU/USD) might be entering a corrective bearish phase after failing to sustain its bullish channel. A retest of broken structure before another drop aligns with typical market structure behavior.
analysis for Gold (XAU/USD) based on your 15-minute chart:he chart shows a descending channel (marked by “TRADE LINE”) that recently broke to the upside, suggesting a possible short-term bullish reversal.
A strong resistance zone is visible near 4140–4160, where price has previously rejected multiple times.
The target zone below is marked around 4042.57, which aligns with prior swing support.
Key Levels
Resistance: 4140 – 4160
Support: 4080 – 4060
Target (Downside): 4042
Upside Break Zone: Above 4160 could lead toward 4180+
Analysis Summary
The price broke out of a short-term bearish channel, indicating potential for a bullish correction toward resistance (4140–4160).
However, this zone is critical resistance; rejection here may trigger a pullback back toward 4080 or even the target at 4042.
Momentum indicators suggest the move is reactive (short-term retracement), not yet a trend reversal.
⚙️ Trading Outlook
Bearish Bias: Below 4140 → potential retest toward 4060–4040.
Bullish Confirmation: Only above 4160 → continuation to 4180–4200. MIL:RACE MIL:LDO MIL:STLAM MIL:ENI MIL:STMMI MIL:STMMI MIL:ENEL MIL:MONC MIL:PRY MIL:TIT MIL:FCT MIL:AZM MIL:WBD

EURUSD: Market of Sellers
The analysis of the EURUSD chart clearly shows us that the pair is finally about to tank due to the rising pressure from the sellers.
Disclosure: I am part of Trade Nation's Influencer program and receive a monthly fee for using their TradingView charts in my analysis.
❤️ Please, support our work with like & comment! ❤️

GBPUSD: Short Trade with Entry/SL/TP
GBPUSD
- Classic bearish formation
- Our team expects pullback
SUGGESTED TRADE:
Swing Trade
Short GBPUSD
Entry - 1.3340
Sl - 1.3350
Tp - 1.3321
Our Risk - 1%
Start protection of your profits from lower levels
Disclosure: I am part of Trade Nation's Influencer program and receive a monthly fee for using their TradingView charts in my analysis.
❤️ Please, support our work with like & comment! ❤️

EURAUD Sellers In Panic! BUY!
My dear subscribers,
EURAUD looks like it will make a good move, and here are the details:
The market is trading on 1.7765 pivot level.
Bias - Bullish
Technical Indicators: Both Super Trend & Pivot HL indicate a highly probable Bullish continuation.
Target - 1.7842
About Used Indicators:
The average true range (ATR) plays an important role in 'Supertrend' as the indicator uses ATR to calculate its value. The ATR indicator signals the degree of price volatility.
Disclosure: I am part of Trade Nation's Influencer program and receive a monthly fee for using their TradingView charts in my analysis.
———————————
WISH YOU ALL LUCK

GBPJPY What Next? SELL!
My dear subscribers,
This is my opinion on the GBPJPY next move:
The instrument tests an important psychological level 203.99
Bias - Bearish
Technical Indicators: Supper Trend gives a precise Bearish signal, while Pivot Point HL predicts price changes and potential reversals in the market.
Target - 203.66
My Stop Loss - 204.17
About Used Indicators:
On the subsequent day, trading above the pivot point is thought to indicate ongoing bullish sentiment, while trading below the pivot point indicates bearish sentiment.
Disclosure: I am part of Trade Nation's Influencer program and receive a monthly fee for using their TradingView charts in my analysis.
———————————
WISH YOU ALL LUCK

Gold Bearish Rejection from Supply Zone (OB + FVG Confluence)Key Observations and SMC Components:
Market Structure Shift (MSS): The label "MSS" suggests that the previous bullish market structure has been broken to the downside, indicating a potential shift to a bearish trend.
Order Block (OB): A bearish Order Block is identified (labeled "OB"), which is typically the last up-close candle before the strong move down. This zone is a high-probability area where institutional selling pressure is expected to resume.
H1 FVG (Hourly Fair Value Gap): Within the Order Block, an H1 FVG (or Inefficiency) is identified. This is an area where price moved strongly without overlapping all three candles, leaving a gap. Fair Value Gaps are often used as targets for price to retrace and "fill" before continuing the dominant move.
CRT-L and CRT-H:
CRT-L (Current Range Top/High) marks the top of the range before the sharp drop.
CRT-H (Current Range Low/Bottom) marks the low point of the current swing leg.
Projected Move: The large green arrow and the curved line indicate the anticipated price action: a retracement (pullback) upwards into the H1 FVG and the OB zone, followed by a rejection and a continuation of the downward move towards and potentially below the CRT-H low.
Current Price Action: The price is currently at the very bottom of the sharp drop, hovering around $4,041.48. The dotted line and arrow show the expectation of a rally into the shaded resistance zone.
Trading Bias and Expectation
The overall bias is bearish. The analyst expects price to:
Rally (short-term bullish retracement): Move up to the area between approximately $4,065 and $4,080 (the OB and H1 FVG zone).
Reject and Trend (long-term bearish continuation): Find strong resistance in the OB/FVG zone, and then reverse to continue the downtrend, aiming to break the CRT-H low.

EURCHF: Bearish Continuation is Highly Probable! Here is Why:
Looking at the chart of EURCHF right now we are seeing some interesting price action on the lower timeframes. Thus a local move down seems to be quite likely.
Disclosure: I am part of Trade Nation's Influencer program and receive a monthly fee for using their TradingView charts in my analysis.
❤️ Please, support our work with like & comment! ❤️

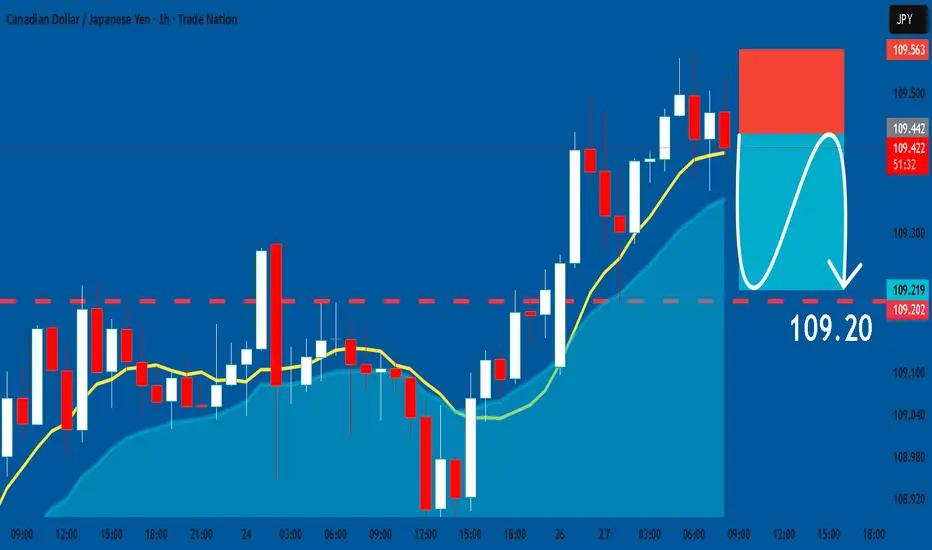
CADJPY: Bearish Continuation & Short Signal
CADJPY
- Classic bearish pattern
- Our team expects retracement
SUGGESTED TRADE:
Swing Trade
Sell CADJPY
Entry - 109.44
Stop - 109.56
Take - 109.20
Our Risk - 1%
Start protection of your profits from lower levels
Disclosure: I am part of Trade Nation's Influencer program and receive a monthly fee for using their TradingView charts in my analysis.
❤️ Please, support our work with like & comment! ❤️
AUDUSD My Opinion! SELL!
My dear followers,
This is my opinion on the AUDUSD next move:
The asset is approaching an important pivot point 0.6538
Bias - Bearish
Technical Indicators: Supper Trend generates a clear short signal while Pivot Point HL is currently determining the overall Bearish trend of the market.
Goal - 0.6510
About Used Indicators:
For more efficient signals, super-trend is used in combination with other indicators like Pivot Points.
Disclosure: I am part of Trade Nation's Influencer program and receive a monthly fee for using their TradingView charts in my analysis.
———————————
WISH YOU ALL LUCK

GOLD Massive Long! BUY!
My dear friends,
Please, find my technical outlook for GOLD below:
The price is coiling around a solid key level - 4068.0
Bias - Bullish
Technical Indicators: Pivot Points Low anticipates a potential price reversal.
Super trend shows a clear buy, giving a perfect indicators' convergence.
Goal - 4087.0
Safe Stop Loss - 4058.5
About Used Indicators:
The pivot point itself is simply the average of the high, low and closing prices from the previous trading day.
Disclosure: I am part of Trade Nation's Influencer program and receive a monthly fee for using their TradingView charts in my analysis.
———————————
WISH YOU ALL LUCK

EURNZD Under Pressure! SELL!
My dear subscribers,
My technical analysis for EURNZD is below:
The price is coiling around a solid key level - 2.0233
Bias - Bearish
Technical Indicators: Pivot Points High anticipates a potential price reversal.
Super trend shows a clear sell, giving a perfect indicators' convergence.
Goal - 2.0208
My Stop Loss - 2.0248
About Used Indicators:
By the very nature of the supertrend indicator, it offers firm support and resistance levels for traders to enter and exit trades. Additionally, it also provides signals for setting stop losses
Disclosure: I am part of Trade Nation's Influencer program and receive a monthly fee for using their TradingView charts in my analysis.
———————————
WISH YOU ALL LUCK

USDCAD Expected Growth! BUY!
My dear subscribers,
USDCAD looks like it will make a good move, and here are the details:
The market is trading on 1.3993 pivot level.
Bias - Bullish
My Stop Loss - 1.3986
Technical Indicators: Both Super Trend & Pivot HL indicate a highly probable Bullish continuation.
Target - 1.4007
About Used Indicators:
The average true range (ATR) plays an important role in 'Supertrend' as the indicator uses ATR to calculate its value. The ATR indicator signals the degree of price volatility.
Disclosure: I am part of Trade Nation's Influencer program and receive a monthly fee for using their TradingView charts in my analysis.
———————————
WISH YOU ALL LUCK

GBPCAD Technical Analysis! BUY!
My dear friends,
My technical analysis for GBPCAD is below:
The market is trading on 1.8627 pivot level.
Bias - Bullish
Technical Indicators: Both Super Trend & Pivot HL indicate a highly probable Bullish continuation.
Target - 1.8651
Recommended Stop Loss - 1.8615
About Used Indicators:
A pivot point is a technical analysis indicator, or calculations, used to determine the overall trend of the market over different time frames.
Disclosure: I am part of Trade Nation's Influencer program and receive a monthly fee for using their TradingView charts in my analysis.
———————————
WISH YOU ALL LUCK

AAVE/USDT – New Volume Box Activation🔹 AAVE/USDT – New Volume Box Activation
AAVE is forming a new volume box structure between $203 – $385, showing renewed momentum after the last low recovery. Price is currently stabilizing around the lower range with growing volume, suggesting early accumulation activity.
As long as AAVE holds above the $200 support zone, we follow for a possible continuation inside this box. The first target for structure development sits around $322, followed by $385 as the main breakout resistance level.
The setup remains active as long as the current momentum and volume stay consistent — confirmation on lower time frames will define the strength of the next move.

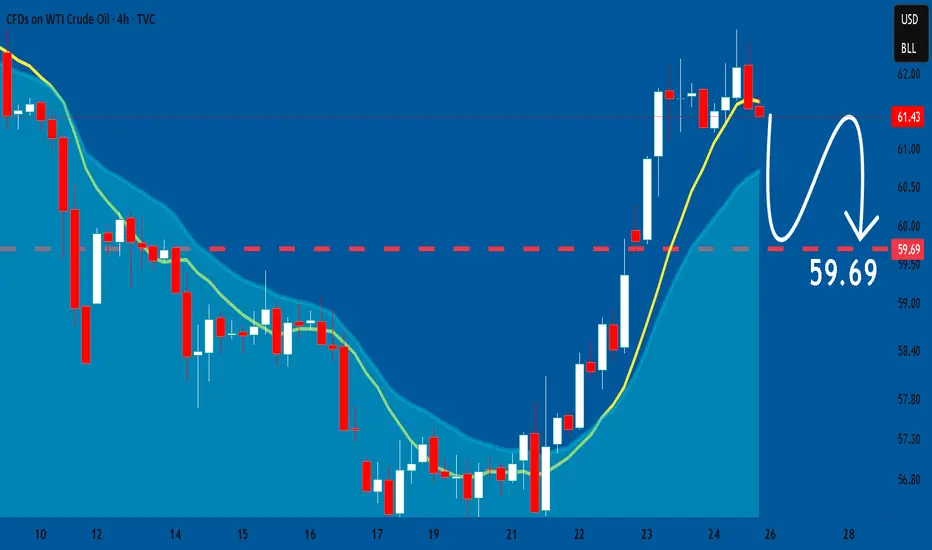
USOIL: Bearish Continuation is Highly Probable! Here is Why:
The analysis of the USOIL chart clearly shows us that the pair is finally about to tank due to the rising pressure from the sellers.
Disclosure: I am part of Trade Nation's Influencer program and receive a monthly fee for using their TradingView charts in my analysis.
❤️ Please, support our work with like & comment! ❤️