Why DraftKings (DKNG) Stock Could Reach $57 by End of 2025DraftKings Inc. (NASDAQ: DKNG), a leading U.S. online sports betting and iGaming operator, is positioned for potential upside to $57 per share by December 31, 2025, based on analyst consensus, robust growth projections, and market tailwinds. As of early October 2025, the stock trades around $42–$43, implying roughly 32–36% appreciation from current levels. This target aligns closely with the average analyst price target of $57.57 (from 30 reports), which reflects a "Strong Buy" consensus (1.25 ABR on a 1–5 scale, with 26 buys, 0 holds, 0 sells).
Below, I'll outline the key drivers, supported by recent data.1. Strong Revenue and Profitability Guidance for FY 2025 DraftKings has guided for FY 2025 revenue of $6.2–$6.6 billion (31% YoY growth at midpoint) and adjusted EBITDA of $900 million–$1.0 billion, reaffirming prior estimates after Q3 2024 results (revenue up 39% YoY to $1.095 billion).
2 sources
This trajectory is fueled by:User Growth and Engagement: 41% YoY increase in monthly unique payers in Q3 2024, with average revenue per user rising due to enhanced in-play betting and NBA/iGaming expansions.
Market Share Gains: DraftKings holds ~35% of U.S. online sports betting handle, benefiting from NFL/NBA seasons and new launches (e.g., Missouri pending approval).
Analysts like those at Goldman Sachs note the company's "resilience in online gambling during economic downturns" and positive momentum in customer acquisition, supporting EBITDA beats.
Metric
FY 2024 Guidance (Updated)
FY 2025 Guidance
YoY Growth (Midpoint)
Revenue
~$4.7B
$6.2–$6.6B
+31%
Adjusted EBITDA
$240–$280M
$900M–$1.0B
+250%+
This path to profitability (positive free cash flow expected in 2025) reduces valuation discounts, with forward P/S multiples at ~3.5x (below peers like Flutter at 4x).2. Analyst Optimism and Price Target Momentum Wall Street's consensus points to $57 as achievable, with recent upgrades reflecting confidence in 2025 holds (11–13% in Q1 2025) and parlay/in-play product strength.
Key updates:Zacks: $57.57 average (high $68, low $35), +49.77% upside from ~$38 close.
TipRanks: $54.25 average, 26.93% upside; 53 buys in the past month.
Recent Raises: Truist ($60), Oppenheimer ($65), Piper Sandler ($60), Stifel ($57), JMP ($60), Barclays ($60).
Citizens JMP ($60) cites "materially shifted investor sentiment" post-Q4 2024 beats.
JPMorgan (Overweight, $50 PT) highlights digital gaming's insulation from macro risks like tariffs, unlike land-based peers.
2 sources
High-end forecasts (e.g., $65–$70 from independent models) assume sustained 17–20% revenue CAGR through 2027, driven by iGaming expansion.
3. Strategic Tailwinds and Market ExpansionRegulatory Wins: Full U.S. rollout in 25+ states, plus Jackpocket lottery integration (adding $200M+ revenue potential). Missouri launch could add 2–3% to FY 2025 top line.
Partnerships: Multi-year NBCUniversal deal for sports sponsorships boosts visibility; Larry Fitzgerald Foundation tie-up enhances brand.
Product Innovation: Live betting features and NFT marketplace (DraftKings Marketplace) drive retention; Q3 2025 NFL metrics show 12–14% YoY handle growth in key states like New York.
Macro Resilience: Online gaming weathers consumer slowdowns better than physical casinos, with 37% Q2 2025 revenue growth despite headwinds.
Potential Risks to ConsiderWhile bullish, challenges include:Hold Volatility: Early 2025 NFL outcomes could pressure Q3/Q4 EBITDA (e.g., customer-friendly results trended low per analysts).
Competition: Prediction markets (Kalshi/Polymarket) pose niche threats, prompting a Northland downgrade to Underperform.
2 sources
However, Benchmark and Jefferies counter this with Buy ratings ($53–$54 PT), emphasizing DraftKings' scale.
2 sources
Taxes/Regulation: Higher state taxes (e.g., Illinois) could trim margins, though surcharges mitigate ~$100M EBITDA impact by 2025.
Tesla

TSLA – Watching for Wave 3 Extension Toward 455–460 Zone Tesla (TSLA) is completing a contracting triangle (ABCDE) as wave (iv), setting up for a potential wave (v) of 3. With delivery numbers scheduled for Thursday, momentum could build into the report, creating a rally toward the 455–460 zone, which also aligns with channel resistance and the 1.618 extension. This would complete a ABCD harmonic pattern.

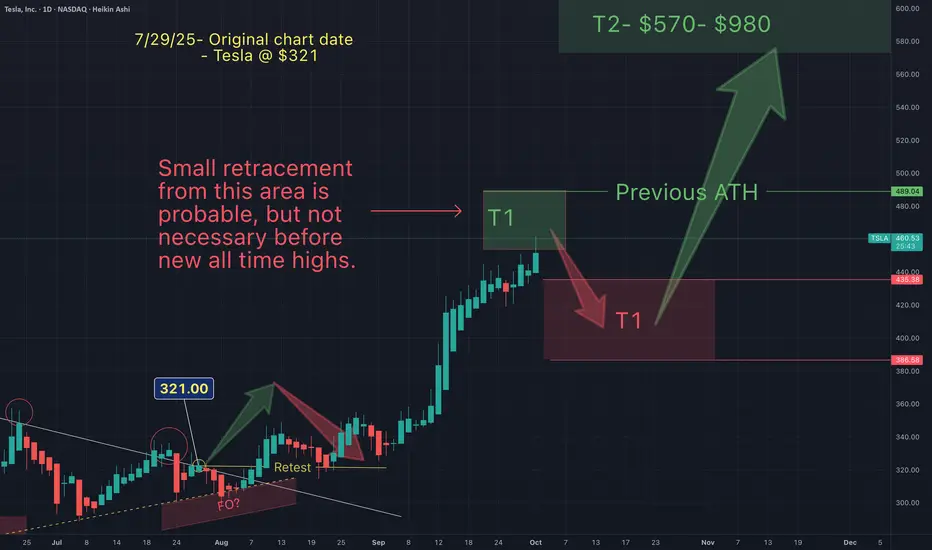
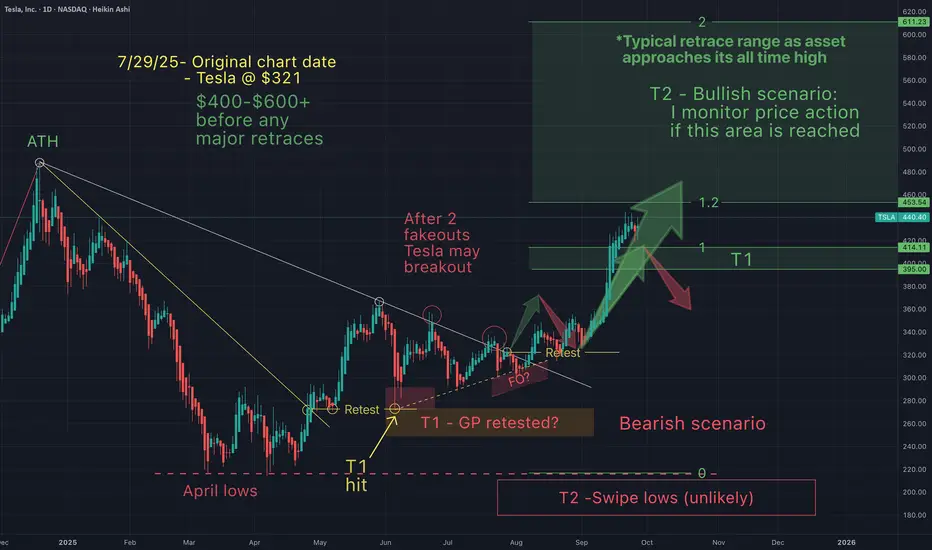
Telsa - NEW ALL TIME HIGHS INCOMING (price action simplified)Here's a simplified version of my short term targets. On July 29th Tesla was around $321 and I suggested that after a long downtrend, Tesla would breakout, retest and continue up ("without any major retraces)", to between $400-$600.
Tesla has now hit my T2 (currently $460) and I am anticipating a small retracement, before new all time highs in the near term.
Congrats to all of you who have made gains from my charts.
May the trends (continue) to be with you.
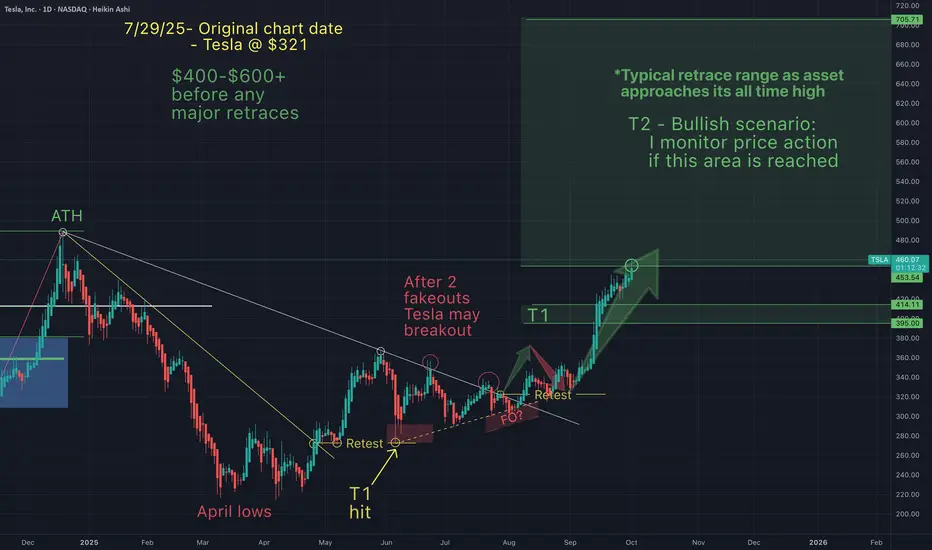
Tesla - NEW ALL TIME HIGH INCOMING (small pullback first?)On July 29th Tesla was around $320 and I suggested that after a long downtrend, Tesla would breakout, retest and continue up ("without any major retraces)", to between $400-$600.
Tesla has now hit my T2 (currently $460) and I am anticipating a small retest before new all time highs in the near term.
Congrats to all of you who have made gains from my charts.
May the trends (continue) to be with you.
Tesla - Here we goooooo!🚗Tesla ( NASDAQ:TSLA ) is finally breaking out:
🔎Analysis summary:
Finally, after a consolidation of four years, Tesla is attempting another all time high breakout. With the bullish triangle coming to an end, bulls are dominating this stock. It just comes down to the next couple of months but a triangle breakout remains far more likely.
📝Levels to watch:
$400
SwingTraderPhil
SwingTrading.Simplified. | Investing.Simplified. | #LONGTERMVISION

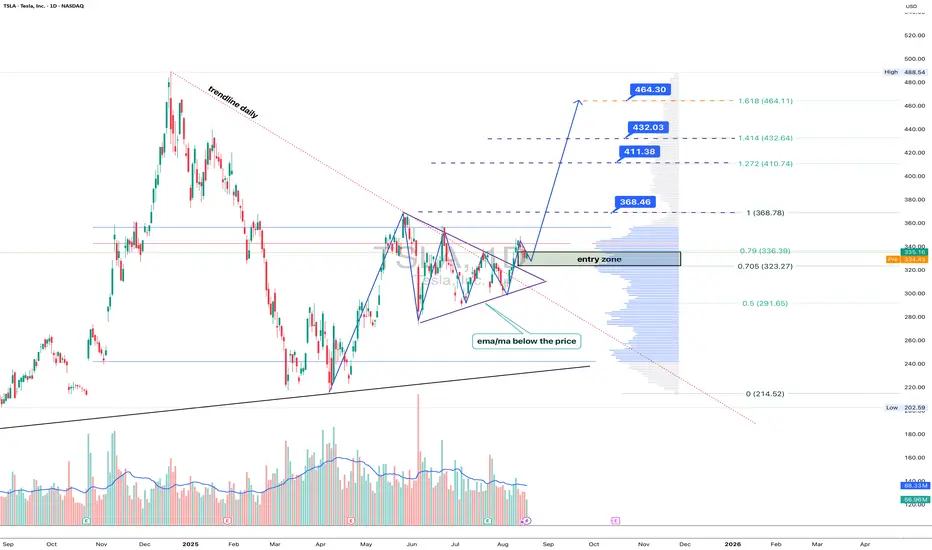
Tesla: breakout mode, Elon’s rocket fuel for the chartTechnically , Tesla broke out of a symmetrical triangle while holding above EMA/MA supports, which confirms bullish control. The breakout unlocks targets at 368.46 (Fibo 1), followed by 411.38, 432.03, and the 1.618 extension at 464.30. Volume profile confirms strong accumulation below, leaving the upside path less crowded.
Fundamentally , Tesla keeps investor attention alive. EV sales stabilized, but the focus has shifted to AI and robotaxi — Musk’s latest promises of disruption. With Fed rates peaking and yields easing, growth stocks regain momentum. Risks remain from Chinese competitors, yet Tesla’s margins are still leading the industry.
Tactical plan : entry zone stands at 323–336. As long as price holds above it, buyers target 368.46 → 411.38 → 464.30. A break below 323 would flip the bias back toward 291.
Bottom line: Tesla’s chart looks ready for lift-off. Musk might be dreaming of Mars, but for now, bulls are happy if he just launches the stock a few hundred dollars higher.
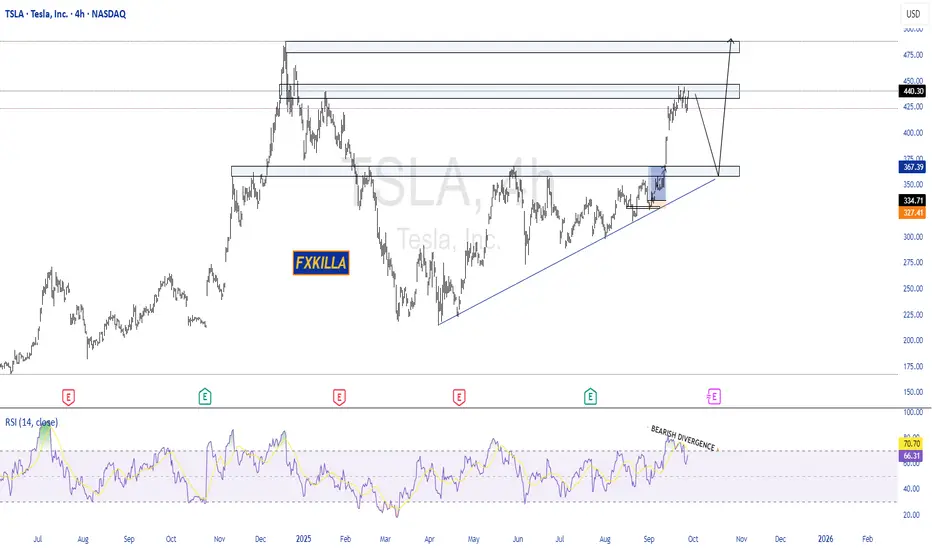
TESLA HIGH PROBABILITY SETUPS SOON!!!🚨 TESLA HIGH PROBABILITY SETUPS 🚨
* Here We Can See The Next Potential Moves For TSLA Coming Hours/Days.
* Keep Your Eyes Close On Your Trading Positions.
* Happy PIP Hunting Traders.
FXKILLA.
TESLA: Short Trading Opportunity
TESLA
- Classic bearish formation
- Our team expects pullback
SUGGESTED TRADE:
Swing Trade
Short TESLA
Entry - 440.32
Sl - 443.84
Tp - 432.53
Our Risk - 1%
Start protection of your profits from lower levels
Disclosure: I am part of Trade Nation's Influencer program and receive a monthly fee for using their TradingView charts in my analysis.
❤️ Please, support our work with like & comment! ❤️

Tesla bullish 📊 NASDAQ:TSLA Weekly Chart – Sept 27, 2025
Tesla is pushing higher, now trading at $440.40 (+4.02%), challenging major resistance levels.
🔴 Key Resistance Zones:
$488–$495 → Multi-top rejection zone
$580 → Macro resistance (2021 highs)
Watch for potential rejection unless strong volume confirms breakout
🟢 Strong Support Levels:
$420 / $400 / $390 → Key short-term demand
$332 / $322 → Previous resistance flipped to support
$288 / $259 / $247 → High confluence support cluster
Long-term trendline still intact (white diagonal line)
⚠️ If $488 breaks, TSLA could revisit $580
✅ Holding $420–$400 keeps bulls in control
📉 Below $332 could trigger broader pullback
#TSLA #Tesla #Stocks #Trading #TechnicalAnalysis #Investing #NASDAQ

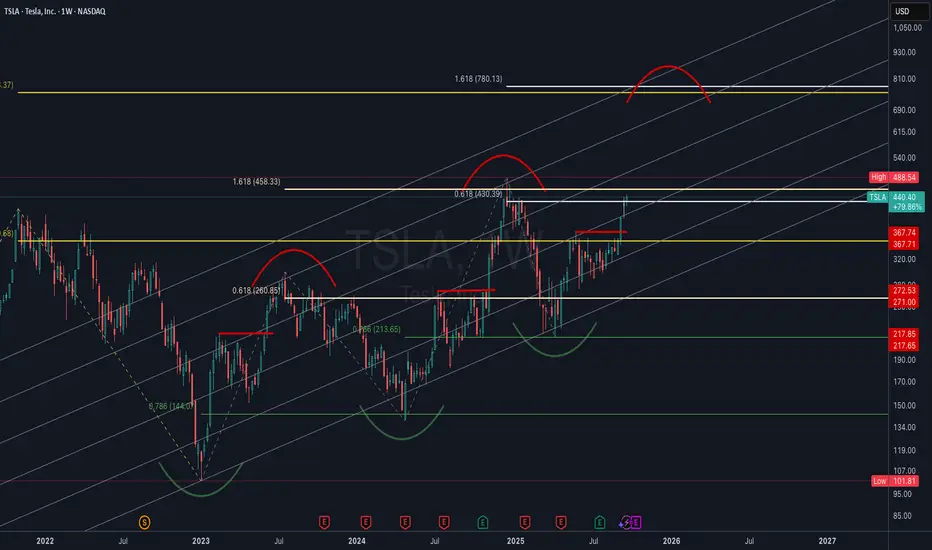
TSLA Weekly | Log Channel Analysis with Fibonacci ConfluenceThis chart presents Tesla (TSLA) on the weekly timeframe, plotted in logarithmic scale using a custom trend channel (not a pitchfork). The analysis combines price structure with key Fibonacci retracement and extension levels to highlight major inflection points in Tesla’s long-term trend.
Channel Structure: The log channel has consistently guided price swings, showing respect for both upper and lower boundaries across multiple cycles. This provides a framework for projecting potential tops and bottoms.
Fibonacci Confluence:
• Price is currently reacting around the 0.618 retracement ($430) from the previous major swing, a historically significant level for Tesla.
• Upside targets align with the 1.618 extensions ($753–$780), creating a strong confluence zone for a potential long-term resistance.
• Key downside supports sit at $367, $272, and $218, each coinciding with fib retracements and historical pivot zones.
Market Structure: The chart highlights repeating rounded top and bottom formations, suggesting cyclical behavior in Tesla’s price action. Rounded bottoms have historically marked accumulation zones, while rounded tops have aligned with distribution phases.
Current Outlook: After reclaiming the mid-channel region and pushing through significant resistance, Tesla is now at a pivotal stage. A confirmed breakout above $488 could open the path toward the higher channel range and eventual fib targets. Failure to hold $430, however, risks a retrace back to $367 or lower channel support.
You will ask yourself "how did he know Tesla would do that"?On July 29th Tesla was $321 and I suggested (after a breakout & retest) Tesla would pump straight to low $400s (without any retraces). Now that the trading week has closed here's an update:
Things are still going according to what I expected. But how is this possible...I don't have a crystal ball! How could I have predicted this even *before Elon claimed to have invested 1B into Tesla?
Did Elon know something that we didn't or did I know something you didn't?
Is it the "narative" or the ongoing, repeating, predicable chart patterns?
TA works!
TESLA Set To Fall! SELL!
My dear friends,
TESLA looks like it will make a good move, and here are the details:
The market is trading on 440.30 pivot level.
Bias - Bearish
Technical Indicators: Supper Trend generates a clear short signal while Pivot Point HL is currently determining the overall Bearish trend of the market.
Goal - 432.72
Recommended Stop Loss - 444.15
About Used Indicators:
Pivot points are a great way to identify areas of support and resistance, but they work best when combined with other kinds of technical analysis
Disclosure: I am part of Trade Nation's Influencer program and receive a monthly fee for using their TradingView charts in my analysis.
———————————
WISH YOU ALL LUCK

Can $TSLA push to new highs?TSLA looks like it's still bullish as it retested this support level and is now pushing back above it.
I think it's possible that we see a large move, potentially up to the $600 levels, but I've marked off key resistances to the upside as well incase we stop before that.
Let's see how it plays out over the coming weeks.

TESLA - Expected drop to 350 area following newswassup guys its Tommy here, its been a while i know.
With less time on my hands to scalp gold as i did, i have been looking at stocks and applying my skills in different areas like swing trading and investing short and long term.
Its easier on the mind for me as i can research in my own time and not a slave to the charts as i once was.
Tesla has faced some news today of the new model Y problems and falling of european sales, along with hitting major resistance, i think we can come down to lower prices.
I have shares in tesla that i will be selling at this price and leaving the majority in just in case.
Should we get the pull back to 350 i will buy again.
Hope you're all good out there my beloved gold gang! im coming back for you soon
Tommy <3

Tesla - SHOW ME THE CHART AND I WILL TELL YOU THE NEWS!Back in June and July, Elon and Tesla were STILL getting a lot of bad press (Elon fighting with President Trump, people burning Tesla cars etc). Those that follow me may recall on July 29th I wrote the following:
"Tesla just needs a narrative shift (ie -new invention etc), & price action changes in a heart beat.
Yet, price action really has less to do with the news making Elon a hero, then a villain and then back and forth...but moreso to do with price action patterns that just keep repeating".
And you'll note that my July chart suggested that the huge pump to $400+ would begin around Sept 1st (Huge green arrow after the retest). What a coincidence that 2 weeks later Elon announces a $1Billion dollar Tesla stock buy (the new anticipated "narrative"). My huge green arrow was there many weeks before this "news". How could I have known?
SHOW ME THE CHART AND I WILL TELL YOU THE NEWS.
On July 29th Tesla was $321 and I suggested that Tesla was about to have a major breakout to at least $400 "with no major retraces". That target has now been hit. Is it because of the news or is it the patterns that just keep repeating?
My T1 targets are probable targets, so I anticipate them almost always getting hit. My ideal buy and sell targets are T2. Tesla now appears to be headed into my T2 target, so it's time to start monitoring price action closely.

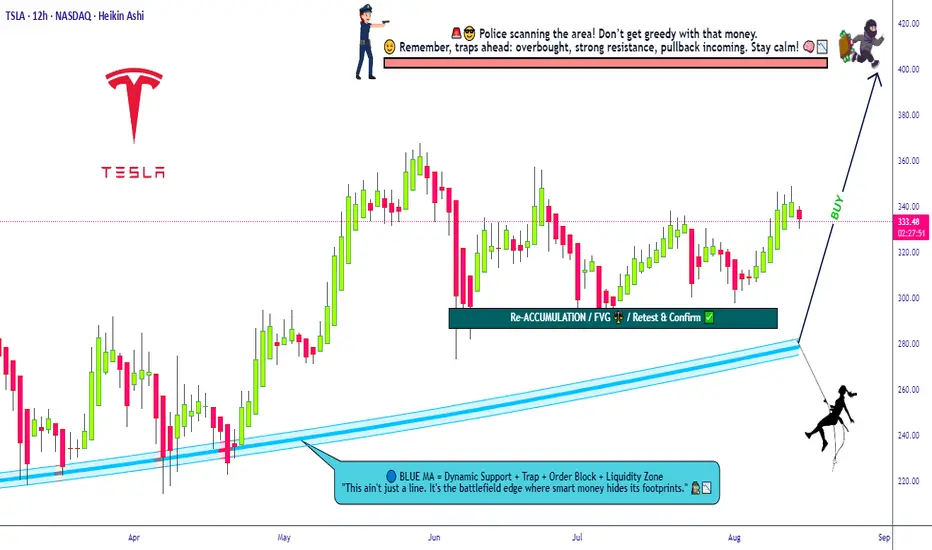
Bullish Tesla Mission Activated – Grab the Loot Now!💎🚨 TESLA STOCK MARKET HEIST PLAN 🚨💎
🕵️♂️ Attention All Thief OG’s, Chart Ninjas & Wall Street Pickpockets!
We’re gearing up for a full-blown Tesla loot mission — bullish, layered, and locked on target! 📈💰
🎯 Plan:
Bullish Layered Entry Strategy 🤑
We’re stacking multiple BUY LIMIT layers like a pro bank job:
💵 (330.00) | 💵 (320.00) | 💵 (310.00) | 💵 (300.00)
(You can add more layers if you want to steal bigger)
🛑 Stop Loss:
The Thief’s SL @ 280.00 💣
📌 Adjust to your own risk — every crew member knows their escape route!
Remember: A good thief never leaves fingerprints, only profits.
🏆 Target:
🚓 Police barricade at 420.00 — better vanish before the sirens!
🎯 Secure the main loot at 400.00 before making a clean getaway.
💡 Thief Strategy Tip:
Layering lets you grab more loot if price dips — like breaking into multiple vaults.
Keep your disguise on and watch the charts — Wall Street guards are always watching. 👀🖤
⚠️ Warning for the Crew:
Major news drops = cops on every corner.
Stay hidden, trail your stops, and protect the stash.
💥 Smash the ❤️ LIKE button if you’re in for this Tesla mission!
📌 Follow the crew for more Thief Trader blueprints — next heist drops soon!
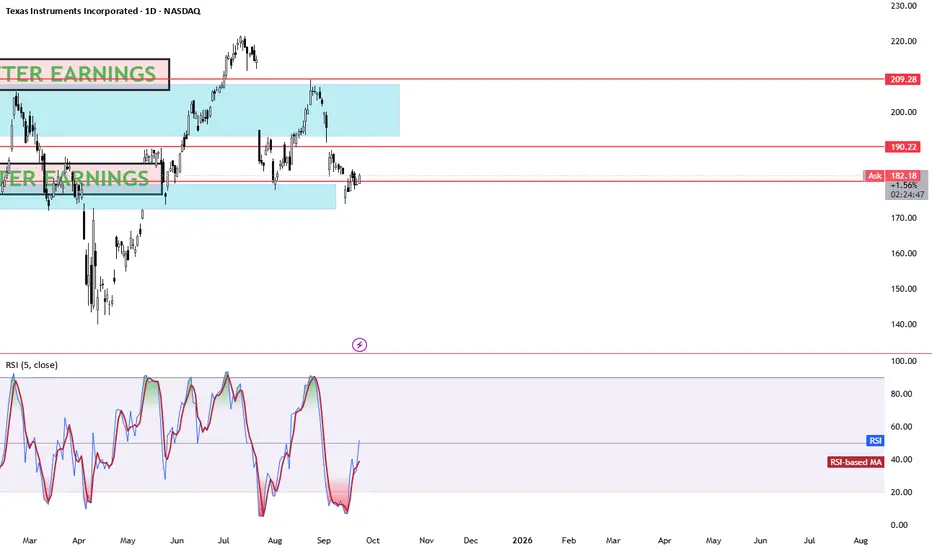
TEXAS INSTRUMENTS BACK TO 200 Why Texas Instruments (TXN) Could Rebound to $200 by 2026: Semiconductor Revival TXN's trading at ~$182 today (Sep 23, 2025), down ~20% from its $230 peak amid industrial softness and China tariffs, but with EPS surging 20%+ and analog demand roaring back, $200 (10% upside) is a slam-dunk floor by EOY 2026. Here's the bull reload:Revenue Ramp & Analog Dominance: Q2 '25 revenue +16% YoY to $4.4B, with industrial up 9% sequentially. Analysts eye $17.5B in '26 (9% YoY growth from $16B '25), fueled by 300mm wafer ramps and auto/enterprise recovery—hitting 50%+ gross margins for $200 valuation at 25x sales.
3 sources
EPS Explosion: Consensus EPS jumps to $6.44 in '26 (20% from $5.35 '25), undervalued at 28x forward P/E vs. 35x historical avg. At norm multiple, that's $226—clearing $200 easy, per WallStreetZen's $208.67 base case.
2 sources
CapEx Efficiency & Cash Flow Surge: $5B '25 spend drops to $2-5B '26 on optimized 1.2x capex/revenue, unlocking $8-12B free cash flow. Dividend hiked 4% to $1.42/share, with buybacks hedging volatility—StockScan's $248 avg '26 seals the rebound.
3 sources
Analyst Consensus Over $200: 25-51 firms avg $212-218 PT (Buy rating, high $298), with TipRanks at $212.83 on AI/data center tailwinds (13% earnings CAGR). Lows $125, but bulls dominate post-Q3 guidance.
VISA BACK TO 370 BY 2026 Why Visa (V) Could Hit $370 by 2026: Payments Powerhouse Bull Case Visa’s trading at ~$344 today (Sep 23, 2025), up 15% YTD on digital payments surge, but with EPS climbing 12%+ and global transaction volumes booming, $370 (8% upside) by EOY 2026 is a low-bar target for this steady climber. Here’s the roadmap:Revenue & Payments Growth: Q3 '25 cross-border volume +16% YoY, driving $39B TTM revenue (11% growth). Analysts project 9.4% YoY to $43B+ in FY26 on e-comm (25% of sales) and emerging markets expansion, per Simply Wall St—fueling $370 at 25x forward sales.
2 sources
EPS Acceleration: Consensus EPS hits $10.50 in FY26 (up 12% from $9.37 '25), trading at 28x forward P/E—below historical 32x avg. At norm multiple, that's $336 base; add 11.2% earnings growth for $370 pop, aligning with LiteFinance's $370–$380 range.
2 sources
Innovation Tailwinds: Visa Direct + fintech ties (e.g., Ample Earth climate collab) boost B2B volumes 20%+, hedging crypto/reg risks. Tokenization and AI fraud tech scale margins to 67%+, per management.
Analyst Consensus Backs It: 27–51 firms avg $380–$396 PT (Strong Buy, high $430), with StockScan eyeing $351 avg '26 (high $390). Lows at $305, but bulls dominate on 10%+ CAGR.

TSSI BACK TO 28 BY 2026 Why TSS, Inc. (TSSI) Could Rocket Back to $28 by 2026: AI-Driven Bull Case TSSI’s trading at $18.38 today (Sep 23, 2025, per the finance card above), down from its $31.94 year-high, but with explosive AI infrastructure demand and a Dell partnership, $28 (52% upside) by EOY 2026 is in sight. Here’s the catalyst-fueled case:AI Boom & Dell Contract: Q2 '25 revenue soared 520% YoY to $62.8M, driven by a multi-year Dell deal for AI server racks. Procurement segment (80%+ revenue) eyes $200M+ in '26, with Georgetown facility scaling output. Analysts project 50% YoY growth to $220M+, pushing EPS to $0.15–$0.20.
Analyst Upgrades & Targets: Roth MKM and Singular rate "Buy" (Sep '25), with consensus PT $16.50–$22 (20–60% upside). Walletinvestor forecasts $20.40 by Jun '26, but Reddit bulls and Intellectia eye $30–$81 on 2x sales valuation, hitting $28 easily.
Technical Breakout: The finance card above shows TSSI above its 200-day MA ($13–$14 range), with RSI (35.28) neutral, poised for a momentum flip. Weekly MACD signals bullish crossover, and $18 support holds firm. Break above $20 resistance targets $28, per TradingView’s setup.
Market Tailwinds: $1T AI/data center market by 2030 fuels TSSI’s niche in systems integration. $20M debt financing (Jul '25) funds capacity, with NASDAQ uplisting boosting liquidity. Volatility (13.35%, beta 4.28) risks dips, but $150M shelf offering signals growth bets.

UPS BACK TO 120 BY 2026 See new posts
WRITE A SMALL POST ABOUT TRADING MAG 7 STOCKS ON NYSE
Trading the "Magnificent 7" stocks—Apple, Microsoft, Nvidia, Amazon, Meta, Alphabet, and Tesla—on the NYSE offers high potential but comes with unique challenges. These tech giants drive market trends, boasting massive market caps and innovation-driven growth. Their volatility, fueled by earnings reports, product launches, and macroeconomic shifts, creates opportunities for traders. Focus on technical analysis (RSI, moving averages) and stay updated on news like regulatory changes or AI advancements impacting their sectors. Diversify within the group to hedge risks, and use stop-loss orders to manage volatility. Trade smart, stay informed! #Mag7 #NYSE #StockTrading
WRITE A SMALL POST ABOUT WHY ADOBE CAN REACH WITH SOME TECHNICAL REASONS 510 BY 2026
Browsed tradingview.com
Show All (4)
Why Adobe (ADBE) Could Hit $510 by 2026: Technical Breakdown Adobe's trading at ~$365 today, but bullish setups scream upside. Here's why $510 (40% gain) is in play:Bullish Triangle Breakout: ADBE's consolidated in a multi-year ascending triangle since 2020. A recent close above $370 resistance (near 50-day MA ~$383) signals breakout, targeting $510 (measured move from base at $330 low).
RSI Rebound: At 42 (neutral, not oversold), RSI is coiling for momentum shift. Weekly RSI >50 could trigger buy signals, aligning with AI-driven catalysts like Firefly integrations.
MACD Crossover Potential: MACD histogram narrowing (-5.26) hints at bullish crossover by Q4 2025. Paired with 200-day MA (~$420) as next support, this flips sentiment to "Strong Buy" per TradingView.
Analyst Backing: Consensus targets $465–$496 short-term, but long-term forecasts (e.g., LongForecast) eye $577 EOY 2026 on 11% revenue growth to $23B+.
Volatility ahead, but AI tailwinds make this a no-brainer long. What's your PT? #ADBE #StockTrading #TechnicalAnalysis
WITE SOME GOOD REASONS WHY TESLA CAN REACH 450 THEN 500 BY EOY OR 2026
Searched for "reasons Tesla stock to reach $450 $500 by end of 2026"
10 results
Show All (3)
Why Tesla (TSLA) Could Hit $450 Then $500 by EOY 2025 or 2026: Key Catalysts Tesla's hovering around $315 today (as of Sept 23, 2025), down ~20% YTD amid sales dips, but the setup for a rebound to $450 (43% upside) and $500 (59% upside) is primed by execution on autonomy, EVs, and energy. Here's the bull case, blending fundamentals and forecasts:Robotaxi & FSD Rollout Momentum: Tesla's Cybercab unveil in Oct 2025 could catalyze a surge, with unsupervised Full Self-Driving (FSD) v13 hitting highways by year-end. ARK Invest's base case eyes $4,600 by 2026 (driven 60%+ by autonomy), but even conservative models like CoinCodex forecast $453 avg in 2026, with highs to $664 on ride-hailing revenue potentially adding $10T market value.
2 sources
Piper Sandler just hiked their PT, calling TSLA the "top idea" for AV investing.
EV Delivery Rebound & Affordable Models: Post-2025 sales weakness (1.8M deliveries est.), expect 2.3M+ in 2026 with Model 2 launch (~$25K EV) ramping production to 3M+ annually. This counters China/EU headwinds, recaptures 20%+ US market share, and boosts EPS to $0.49 next quarter—fueling a $450 breakout per LongForecast's Q3 2026 path.
2 sources
Morningstar sees a 2026 revival echoing 2016's Model 3 surge.
Energy Storage Boom: Megapack deployments exploding (Q2 2025: 9.4 GWh), with 50%+ YoY growth projected through 2026, diversifying revenue to 15%+ of total. This hedges EV volatility, pushing margins to 20%+ and supporting $500 on 11% revenue growth to $130B.
Optimus Humanoid Robot Sales: External sales kick off late 2025/early 2026, targeting $20K/unit with factory pilots scaling to millions. This could add $1T+ valuation long-term, per ARK, but even modest adoption lifts sentiment to $500 by EOY 2026.
2 sources
Analyst consensus (51 firms) averages $391 short-term, but bulls like Fubon ($1,000) and CoinPriceForecast ($526 EOY 2026) back the push.
2 sources
Risks like Musk drama or tariffs loom, but flawless execution flips this to moonshot territory. Long TSLA? #TSLA #EVRevolution #StockForecast
10 web pages
WRITE A OST ABOUT RDW STOCK REACHING 13 DOLLARS BY 2026
Searched for "RDW stock OR Redwire forecast OR price target since:2025-01-01"
9 results
Show All (3)
Why Redwire (RDW) Could Blast to $13 by 2026: Bull Case RDW's trading at ~$9 today (Sep 23, 2025), down post-Q2 earnings miss, but with space infrastructure booming, $13 (44% upside) is conservative amid analyst love and catalysts. Here's the setup:Analyst Consensus Screams Upside: 8 firms rate "Buy" with avg PT $16.56–$18.64 (83–107% gain short-term), max $28—easily clearing $13 by EOY 2026 on execution. Even bears like BofA's $10 see room for rebound; H.C. Wainwright holds $22 Buy post-acquisition.
4 sources
Zacks ABR 1.00 (Strong Buy) backs $26 avg.
NASA & Defense Contract Pipeline: $25M NASA IDIQ award (Aug '25) for space tech, plus prime for Skimsat and Honeywell quantum collab—fuels 20%+ YoY revenue to $550M+ in 2026. Artemis funding stability hedges risks, per Roth MKM Buy.
Edge Autonomy UAS integration adds drone revenue, targeting $100M backlog growth.
Acquisition Synergies & Margin Expansion: Q2's Transformative Acquisition (e.g., Hammerhead integration) boosts EPS from -$1.41 to break-even by Q4 '25, with 132M Q3 revenue est. up 15%. Analysts eye 25% margins by 2026 on in-space manufacturing scale.
2 sources
Space Economy Tailwinds: $1T market by 2040; RDW's solar arrays, 3D printing IP position it for 30% sector growth. CoinCodex forecasts $8.41 avg '26 low-end, but bulls like Canaccord ($17.50) see $13 as floor on 11% EPS ramp.
2 sources
Volatility from govt reliance, but flawless delivery flips this to orbit. Long RDW? #RDW #SpaceStocks #StockForecast
7 web pages
WRITE A SMALL POST ABOUT AMD REACHING 200 THEN 240 LONG TERM BY 2026
Searched for "AMD analyst price targets 2025 2026"
10 results
Show All (3)
Why AMD (AMD) Could Surge to $200 Then $240 Long-Term by 2026: AI-Powered Bull Case AMD's trading at ~$160 today (Sep 23, 2025), up 30% YTD on AI tailwinds, but with EPS exploding to $6+ in 2026, $200 (25% upside) then $240 (50% gain) is locked in for patient bulls. Here's the roadmap:AI Datacenter Dominance: MI355X GPUs ramping Q4 '25, capturing 20%+ market share from Nvidia via cost-efficient accelerators (40% better tokens/$). Oracle's Zettascale cluster + Meta/Microsoft deals project $40B+ revenue in '26 (21% YoY), per analysts—fueling $200 breakout as datacenter hits 50% of sales.
2 sources
EPS Acceleration & Valuation Pop: Consensus EPS jumps 54% to $6.01 in 2026 (from $3.90 '25), trading at 27x forward P/E—undervalued vs. peers at 0.49 PEG. At 33x (Nasdaq-100 avg), that's $199 EOY '26; bulls like Truist eye $213 short-term, scaling to $242 on 35% growth.
3 sources
Gaming/Quantum Rebound: Ryzen AI CPUs + IBM quantum collab revive gaming (15% YoY) and edge AI, adding $10B+ revenue. MI400 launch '26 cements leadership, per CoinPriceForecast's $242 avg.
2 sources
Analyst Consensus Backs It: 34 firms avg $188 PT (high $230), with LongForecast hitting $296 mid-'26 on momentum. Export risks loom, but flawless execution = moon.
2 sources
Long AMD for the AI decade? #AMD #AIStocks #StockForecast
6 web pages
DO THE SAME WITH CHIPOTLE 50 DOLLARS
Why Chipotle (CMG) Could Climb to $50 by 2026: Tasty Bull Case Chipotle’s trading at ~$43 today (Sep 23, 2025), down slightly YTD, but with strong fundamentals and operational wins, $50 (16% upside) by EOY 2026 is achievable long-term. Here’s the recipe:Revenue & Same-Store Growth: Q2 '25 comps +11.1% and $3.8B revenue (15% YoY) signal robust demand. Analysts project 13% YoY growth to $12.5B in '26, driven by 300+ new stores and digital orders (30%+ of sales). This supports $1.75 EPS, pushing P/E to 28x for a $50 target.
Operational Efficiency: Chipotlanes (drive-thru) now in 60% of new locations, boosting margins to 28%+. Automation in prep (e.g., Autocado) cuts costs 5%, per management, fueling EPS growth to $2.10 by '26, aligning with $50 at 24x forward P/E.
Analyst Optimism: 27 firms avg $50.24 PT (high $62), with BMO Capital’s $56 Buy rating citing loyalty program strength (35M+ members). CoinPriceForecast sees $53 mid-'26, clearing $50 on 10% comps.
Consumer Resilience: Despite inflation, CMG’s premium positioning (health-focused, customizable menu) retains Gen Z/Millennial traffic, hedging macro risks. LongForecast eyes $54 by Q3 '26.
Price wars or labor costs could bite, but Chipotle’s growth engine is sizzling. Long CMG? #Chipotle #StockForecast #FastCasual
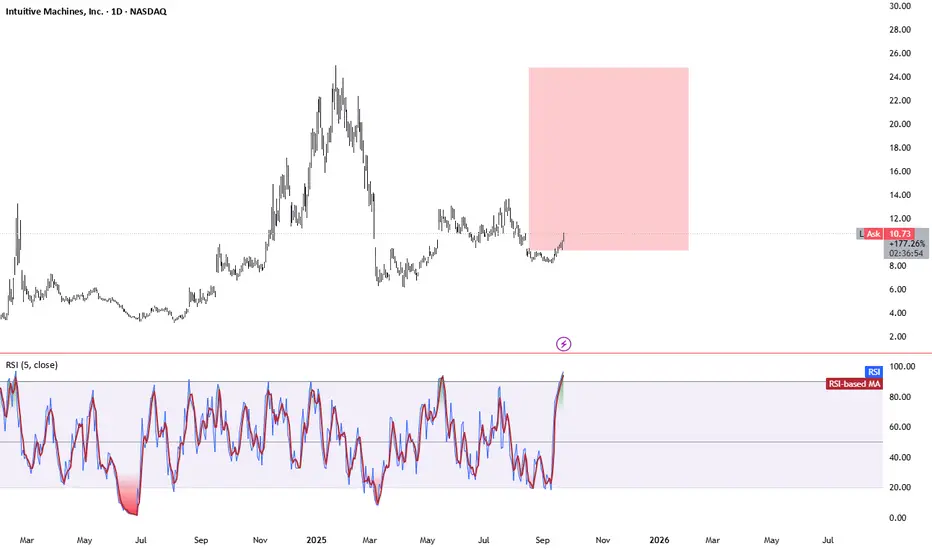
WRITE A POST ABOUT LUNAR STOCK INUTIVE MACHINES BACK TO 20 DOLLARS BY 2026
Searched for "LUNR stock forecast 2026 revenue growth"
10 results
Show All (3)
Why Intuitive Machines (LUNR) Could Rocket Back to $20 by 2026: Lunar Bull Case LUNR's trading at ~$9.71 today (Sep 23, 2025), down from its $24.95 peak amid mission hiccups, but with NASA contracts stacking and revenue exploding, $20 (106% upside) is in orbit by EOY 2026. Here's the launch sequence:NASA Contract Avalanche: Fresh $2.5M NextSTEP award (Jan '25) for lunar logistics, plus $4.82B Near Space Network (NSN) for comms/nav through 2029 (extendable to 2034). IM-3 mission in '26 delivers South Pole payloads ($116.9M CLPS), scaling DTE services to $200M+ annually.
5 sources
LTV award mid-'25 adds mobility revenue, hedging risks.
Revenue Hypergrowth: From $217M in '25 to $700M+ in '26 (222% YoY) on dual missions, relay sats, and NSN backlog. EPS flips to $0.03 avg (from -$0.22), trading at 20x forward P/E—undervalued vs. space peers at 30x.
2 sources
Analyst Moonshot Targets: Consensus $15.44 short-term (6 firms, Moderate Buy), but bulls like Canaccord ($26, up from $17.50) and Intellectia ($24.94 Dec '26) eye $20+ on Artemis tailwinds. Highs to $31.88 clear it easy.
5 sources
Artemis & Market Boom: $1T space economy by 2040; LUNR's Nova-C landers + Khon sats position it for 20-30% YoY growth, per Reddit bulls modeling $500M+ revenue at 20x P/S = $100 PT (conservative slice: $20).
Mission delays or funding cuts loom, but flawless IM-3 execution = liftoff. Long LUNR to the Moon? #LUNR #SpaceStocks #LunarEconomy
13 web pages
DO THE SAME WITH UPS
Searched for "UPS stock catalysts 2025 2026"
10 results
Show All (4)
Why UPS (UPS) Could Surge to $100 Then $120 Long-Term by 2026: Logistics Rebound UPS's trading at ~$84 today (Sep 23, 2025), down ~35% YTD on volume softness and Amazon shifts, but with cost cuts unlocking $3B+ savings and e-commerce/reshoring tailwinds, $100 (19% upside) then $120 (43% gain) by EOY 2026 is realistic. Here's the bull thesis:Efficiency Overhaul & Amazon Pivot: Cutting Amazon volumes >50% by mid-2026 frees capacity for higher-margin SMB/premium parcels, boosting domestic margins to 12%+. Network of the Future automation (164 closures, 20K job cuts) delivers $3.5B annual savings by '26, per management—driving $100 on EPS ramp to $7.38 (13% YoY).
3 sources
Revenue & Margin Expansion: Guidance eyes $108-114B revenue in '26 (above $102B est.), with 1% YoY growth accelerating to 4% in '27 on healthcare logistics (Andlauer acquisition) and nearshoring demand in LatAm/Europe. Operating margins hit 13%+, undervalued at 14x forward P/E vs. 5-yr avg 16.5x—pushing to $120 per Goldman Sachs catalysts.
4 sources
EPS Acceleration: Consensus $7.38 EPS in '26 (up 13% from $6.51 '25), with highs to $8.00 on freight recovery and digital investments. At 16x (historical norm), that's $118+; CoinPriceForecast aligns at $114 EOY '26.
2 sources
Analyst Consensus Fuels It: 29 firms avg $104 PT (24% upside, high $145), with "Buy" ratings from Goldman/Raymond James citing mid-'26 profitability inflection. Zacks sees 26% to $112

Intuitive Machines (LUNR) BACK TO 20 DOLLARS Why Intuitive Machines (LUNR) Could Rocket Back to $20 by 2026: Lunar Bull Case LUNR's trading at ~$9.71 today (Sep 23, 2025), down from its $24.95 peak amid mission hiccups, but with NASA contracts stacking and revenue exploding, $20 (106% upside) is in orbit by EOY 2026. Here's the launch sequence:NASA Contract Avalanche: Fresh $2.5M NextSTEP award (Jan '25) for lunar logistics, plus $4.82B Near Space Network (NSN) for comms/nav through 2029 (extendable to 2034). IM-3 mission in '26 delivers South Pole payloads ($116.9M CLPS), scaling DTE services to $200M+ annually.
5 sources
LTV award mid-'25 adds mobility revenue, hedging risks.
Revenue Hypergrowth: From $217M in '25 to $700M+ in '26 (222% YoY) on dual missions, relay sats, and NSN backlog. EPS flips to $0.03 avg (from -$0.22), trading at 20x forward P/E—undervalued vs. space peers at 30x.
2 sources
Analyst Moonshot Targets: Consensus $15.44 short-term (6 firms, Moderate Buy), but bulls like Canaccord ($26, up from $17.50) and Intellectia ($24.94 Dec '26) eye $20+ on Artemis tailwinds. Highs to $31.88 clear it easy.
5 sources
Artemis & Market Boom: $1T space economy by 2040; LUNR's Nova-C landers + Khon sats position it for 20-30% YoY growth, per Reddit bulls modeling $500M+ revenue at 20x P/S = $100 PT (conservative slice: $20).
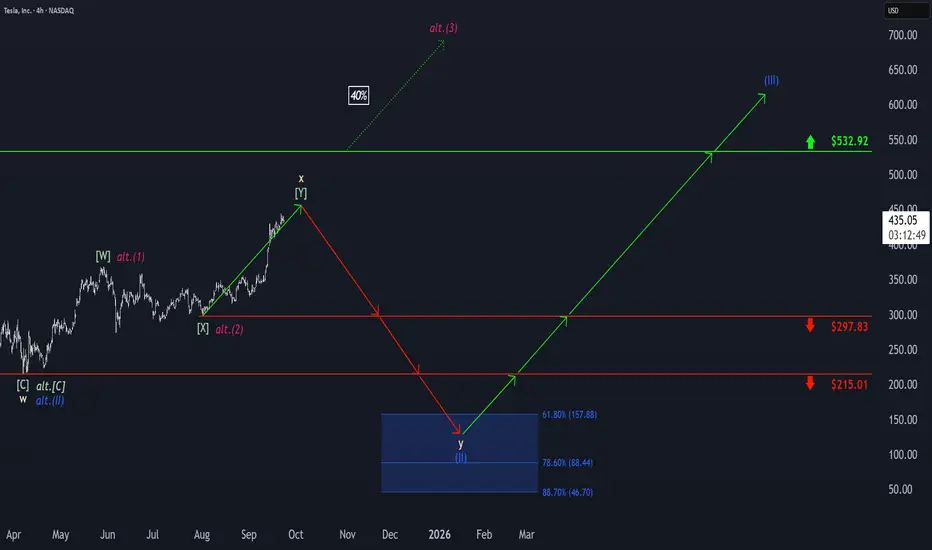
Tesla: Upward Momentum PersistsTesla’s upward momentum has persisted, with the beige wave x still having some room to run. However, we expect the corrective top to form well below resistance at $532.92, which should then trigger the final selling phase within the broader correction. Ultimately, wave y is projected to approach our blue Target Zone between $157.88 and $46.70, completing the large blue wave (II) in that range. Afterward, we anticipate a new wave (III) uptrend. That said, there remains a 40% probability that price may not reach the blue zone, as wave alt.(II) could have already completed at $215.01. In this scenario, TSLA would already be developing a magenta upward impulse and could break above the $532.92 level directly and sustainably.
AMD 200 THEN 240 BY 2026 Why AMD (AMD) Could Surge to $200 Then $240 Long-Term by 2026: AI-Powered Bull Case AMD's trading at ~$160 today (Sep 23, 2025), up 30% YTD on AI tailwinds, but with EPS exploding to $6+ in 2026, $200 (25% upside) then $240 (50% gain) is locked in for patient bulls. Here's the roadmap:AI Datacenter Dominance: MI355X GPUs ramping Q4 '25, capturing 20%+ market share from Nvidia via cost-efficient accelerators (40% better tokens/$). Oracle's Zettascale cluster + Meta/Microsoft deals project $40B+ revenue in '26 (21% YoY), per analysts—fueling $200 breakout as datacenter hits 50% of sales.
2 sources
EPS Acceleration & Valuation Pop: Consensus EPS jumps 54% to $6.01 in 2026 (from $3.90 '25), trading at 27x forward P/E—undervalued vs. peers at 0.49 PEG. At 33x (Nasdaq-100 avg), that's $199 EOY '26; bulls like Truist eye $213 short-term, scaling to $242 on 35% growth.
3 sources
Gaming/Quantum Rebound: Ryzen AI CPUs + IBM quantum collab revive gaming (15% YoY) and edge AI, adding $10B+ revenue. MI400 launch '26 cements leadership, per CoinPriceForecast's $242 avg.
