VIPS Trades to watch #2I like this area but it still a little high for me. Im going to wait til it comes back down to the trend line and show support. That should bring the price of the option down and maybe I will pick up 4 or 5 of these.
by iCantw84it
05.24.2021
Thecurve

BABA looks nice here but...BABA before diving in head first I would like to see something like this happen first.
i Call this the iCantw84it Break in momentum
by iCantw84it
05.20.2021

MGI guess who just popped out of the cloud like a good lil stockMGI guess who just popped out of the cloud like a good lil stock
by iCantw84it
05.20.2021

SPCE going into Re-Accumulation- how to identifyThis is reaccumulation on spce and will continue going up. buckle up moon shot lets GO!
by iCant84it
05.20.2021

PLTR its all about holding out til the end of this week. Once this week closes out this will launch.
by iCantw84it
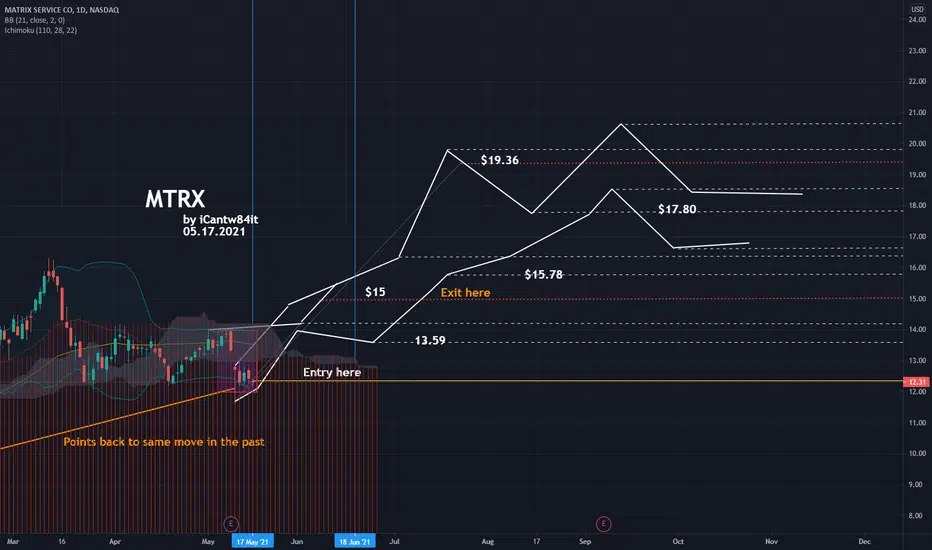
05.17.2021


MTRX Set up for an easy $3 runTesting a Scalp here not sure if this will move enough for me but I like the way this looks and want to test this trendline that I saw. Took entry with two option calls til June 18th.
FUBO Fubotv breakdown two plausible pathsEven with missing expectations everything else on this stock has been extremely good and the price is very under valued. Expecting a boom in this soon.
by iCant84it
05.17.2021


Breaking down Wyckoff into 5 steps called the CURVEBefore I knew what wyckoff was, I saw something in the market and studied it 12 hours a day for 8 months. Even made a rule set for it. It wasn't until 2 months ago I started looking to find the missing pieces of the puzzle. Thats when I found wyckoff. Wyckoff is the technical step by step version of what the curve is, except I can explain the curve in 5 steps vs 16-24 over 4 different variations and 4-8 different variations of that. It's a little too much for the avg person. The curve is purely visual and easy to understand. In this video I go over Facebooks price action and correlate that to both wyckoff and the curve.
If you would like to see more videos like this please like follow subscribe, and leave a comment below. This will help me guage if there is a need to learn more.
I have acquired savant syndrome , 1 of 33 people in the world, who have gained a talent after a traumatic brain injury. At first it was just art and painting. I never was great at drawing and I couldnt paint before the wreck. 11 staples later I was paint portraits near realism and spray painting 50ft by 50ft buildings, even though I had never held a spray can before that. I started looking at charts 9 months ago and have spent more than 12 hours a day since looking at them. The curve is my baby, I found wyckoff a few months ago. Together it gives me a vast understanding of whats happening in the market and where price should go. I combine this with some other things I have found in the market to plot trend lines that should envelope Price action and even predict the highs and lows as it moves.
I use these trendlines not to predict really but to give me a non emotional trigger to either get in or stay out of the market. If Price Action respects the trendlines, then this would be a stock I would play. My target is the highs and lows of the trendline. Simple enough. I have started with an extremely small amount of money and have made more that 5 x my money which is hard when you can't really play stocks that are known for moving because they cost more. Finding cheaper option plays that are going to pop with momentum is what I have used this with in order to build my account large enough to play stronger more stable option plays like HD GS etc...
Thanks again for watching,
iCantw84it
05.15.2021

FB Prediction and breaking down Wyckoff in 5 steps (the Curve)Before I knew what wyckoff was, I saw something in the market and studied it 12 hours a day for 8 months. Even made a rule set for it. It wasn't until 2 months ago I started looking to find the missing pieces of the puzzle. Thats when I found wyckoff. Wyckoff is the technical step by step version of what the curve is, except I can explain the curve in 5 steps vs 16-24 over 4 different variations and 4-8 different variations of that. It's a little too much for the avg person. The curve is purely visual and easy to understand. In this video I go over Facebooks price action and correlate that to both wyckoff and the curve.
If you would like to see more videos like this please like follow subscribe, and leave a comment below. This will help me guage if there is a need to learn more.
I have acquired savant syndrome , 1 of 33 people in the world, who have gained a talent after a traumatic brain injury. At first it was just art and painting. I never was great at drawing and I couldnt paint before the wreck. 11 staples later I was paint portraits near realism and spray painting 50ft by 50ft buildings, even though I had never held a spray can before that. I started looking at charts 9 months ago and have spent more than 12 hours a day since looking at them. The curve is my baby, I found wyckoff a few months ago. Together it gives me a vast understanding of whats happening in the market and where price should go. I combine this with some other things I have found in the market to plot trend lines that should envelope Price action and even predict the highs and lows as it moves.
I use these trendlines not to predict really but to give me a non emotional trigger to either get in or stay out of the market. If Price Action respects the trendlines, then this would be a stock I would play. My target is the highs and lows of the trendline. Simple enough. I have started with an extremely small amount of money and have made more that 5 x my money which is hard when you can't really play stocks that are known for moving because they cost more. Finding cheaper option plays that are going to pop with momentum is what I have used this with in order to build my account large enough to play stronger more stable option plays like HD GS etc...
Thanks again for watching,
iCantw84it
05.15.2021

The way of the BitcoinI am not trying to be pessimist and i will not. Check the graph! The middle line of the Trend is a strong resistance and strong support. Bitcoin seems respecting this trend. Not only the trend itself! Check the parallel lines as well.
Bitcoin tried this support yesterday and bounced. Looks like it is going to try one more time. If Bitcoin can not cross down the support, this may indicate a rise and the targets are 8400 - 9.600 - 10.400! However, if it crosses down the median and closes day below, there is a different scenario and we can go back to $6K - $6.5K
I will update this post at the beginning of the week with the statistical probabilities of the following week. Keep in touch!
Btw, you can use my statistical method's indicators to see the probabilities of any asset classes:
The Curve
The Path
Bests,
Atilla
