Bitcoin's 4-year bullish cycle is coming to an end.The price reversal and manipulation zone could be between $120K and $133K, indicating a big bearish movement.
Quarterly analysis indicates a target of approximately $24,750.
QT + ICT + SMC
- Sainty
Three Drives

Looking at a bearish marketWe have a clear dealing range with the dealing range high at 1.88296 and dealing range low at 1.83054. This appear to be a bearish market because the daily liquidity has been raided and the structure has been broken to the downside to mitigate the fair value gap around the equilibrium price. We are ideally anticipating price to rebalance the imbalance and active the fair value gap at the extreme premium and provide us with a selling opportunity to the discounted area…

Bitcoin sell short bigFirst, we are waiting for confirmation of the twin ceiling. After the support of 72,000 is broken, we will move towards 39,000.

BTC daily bull flag formationBTC is looking bullish on the daily chart in my opinion. One more pullback might be in order before we test new highs on the daily chart. The 100 sma has crossed over the 200 sma and the 50 sma is crossing the 21 sma. The rsi is neutral at time of publication. This bullish breakout could occur in late july after a pullback in the near term.
I think bitcoin is setting up to make another all time high push as summer draws on.
Not financial advice. Do your own DD.
Thanks for viewing the idea.
Comment what you think is going to happen over the course of this summer.


SPX : Where Where - according to the F
This is a continuation of the previous SELL idea. This time, we go into the details, where we can actually see price action moving in lock-step.
Lets make lots of money. Please keep the SL tight.
Good luck.


ACXUSDT – Resistance Zones Marked on the Chart!
“Key levels ahead—will resistance hold or will we see a breakout?”
🔥 Key Insights:
✅ Resistance Zones Clearly Defined – Watch for strong reactions.
✅ Rejection = Short Setup – Only with LTF breakdown + CDV confirmation.
💡 The Smart Plan:
Focus on LTF (15M & 1H) Price Action – Breakout or rejection will be clear there.
Use CDV & Volume Profile – Don’t trade blindly, follow the data.
Let the Market Show the Way – We react, not predict.
“Patience + Smart Entries = Winning Trades—watch the chart, trade the plan!” 📉
A tiny part of my runners:
🎯 ZENUSDT.P: Patience & Profitability | %230 Reaction from the Sniper Entry
🐶 DOGEUSDT.P: Next Move
🎨 RENDERUSDT.P: Opportunity of the Month
💎 ETHUSDT.P: Where to Retrace
🟢 BNBUSDT.P: Potential Surge
📊 BTC Dominance: Reaction Zone
🌊 WAVESUSDT.P: Demand Zone Potential
🟣 UNIUSDT.P: Long-Term Trade
🔵 XRPUSDT.P: Entry Zones
🔗 LINKUSDT.P: Follow The River
📈 BTCUSDT.P: Two Key Demand Zones
🟩 POLUSDT: Bullish Momentum
🌟 PENDLEUSDT.P: Where Opportunity Meets Precision
🔥 BTCUSDT.P: Liquidation of Highly Leveraged Longs
🌊 SOLUSDT.P: SOL's Dip - Your Opportunity
🐸 1000PEPEUSDT.P: Prime Bounce Zone Unlocked
🚀 ETHUSDT.P: Set to Explode - Don't Miss This Game Changer
🤖 IQUSDT: Smart Plan
⚡️ PONDUSDT: A Trade Not Taken Is Better Than a Losing One
💼 STMXUSDT: 2 Buying Areas
🐢 TURBOUSDT: Buy Zones and Buyer Presence
🌍 ICPUSDT.P: Massive Upside Potential | Check the Trade Update For Seeing Results
🟠 IDEXUSDT: Spot Buy Area | %26 Profit if You Trade with MSB
📌 USUALUSDT: Buyers Are Active + %70 Profit in Total
🌟 FORTHUSDT: Sniper Entry +%26 Reaction
🐳 QKCUSDT: Sniper Entry +%57 Reaction
📊 BTC.D: Retest of Key Area Highly Likely
I stopped adding to the list because it's kinda tiring to add 5-10 charts in every move but you can check my profile and see that it goes on..

BTCUSD TECHNICAL ANALYSIS NEXT MOVE POSSIBLE.This BTC/USD chart shows a possible bullish setup based on support and resistance levels:
Support Zone (~82,000): The blue highlighted area represents a key support level where buyers might step in.
Resistance Levels:
83,224 (Red Line): A potential resistance level where price might react.
84,457 (Black Line): A stronger resistance level and the ultimate upside target.
Expected Scenarios (Blue Arrows):
1. Bounce from Support → Break 83,224 → Rally to 84,457.
2. Rejection at 83,224 → Retest Support → Second attempt at a breakout.
This suggests that if BTC holds above support, a bullish move is likely. If it fails, a retest of the support zone could happen.

Take Two on Nvidia Pivot Play. NVDAThe setup stopped out last time with acceptable losses. It is time to try the markets, probability and harmonics once again. This time the indicators below are in alignment also

Short Term Up For Apple. AAPLBetting on a triple drive formation here, while stock price is correcting from the last drop. None of the technical indicators have turned, yet, although they appear to be about to. This is a discretionary idea with increased risk, as there is no signal until an indicator produces one.

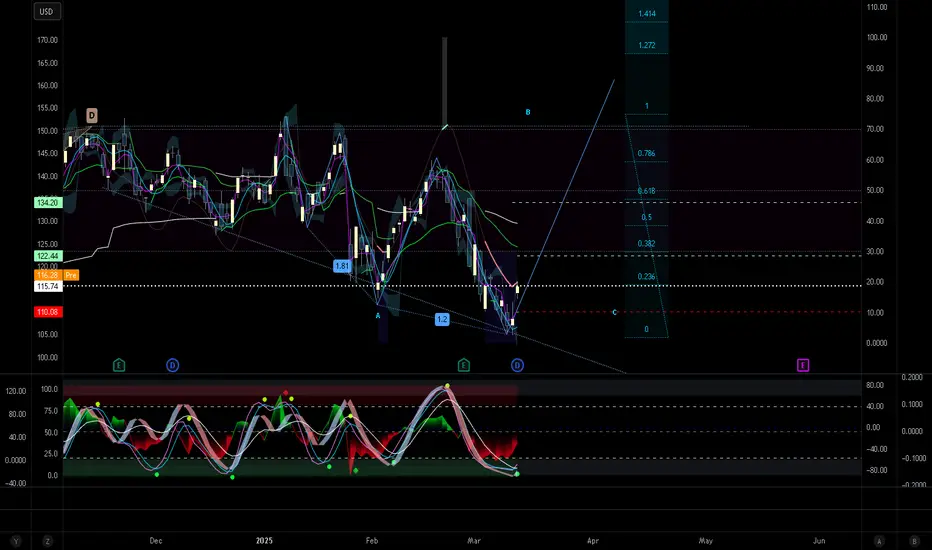
Baidu Heading Up and Up. BIDUTriple Drive/ABCDE B Wave of a zigzag....maybe. This is a bet on a E Wave yet to form. If fractal rules are obeyed, then next move should be a 1.2 of the previous, which aligns in a very nice Fibonacci cluster at 0.786/1.272. Naturally, the indicators below have just turned to bullish as well almost in unison.

Enphase Pivots to Upside. ENPHAn interesting fractal picture here. A very flat AB=CD here with a triple drive inside that is bullish. Now looking to the upside. VZO, vWAP, US crossed, BB%PCT heading to the zero line. Kennedy channeling gives some stationary goals.

winter is comingI don't believe in a world where china and europe are arming themselves and US is bullying everyone for their rare earth minerals is a world where US is disarming themselves. contrarian play. It doesn't matter what they say, military spending is going up.

GBPUSD to PDLI expect GBPUSD to go to previous daily low. I say this because of a swing high that we see being formed on the Daily chart.

ETHUSD about to drop for more than 500 dollars!!Based on my trading algorithms ETHUSD will drop for 500 dollars!

EUR/USD has just broken out of a symmetrical triangle on the 3-h**"EUR/USD 3H – Triangle Break & Next Move"**
hinting at further bullish momentum. I've set a **new stop-loss** around **1.0400** to protect gains. If the pair pushes past **1.0600**, look for a potential move toward **1.0700**. However, a drop back below the stop-loss area could invalidate the bullish scenario. Always trade with proper risk management!
#EURUSD #Forex #SymmetricalTriangle #TechnicalAnalysis #TradingView #ForexTrading #RiskManagement

EUR/USD 4H | Elliott Wave Triangle Formation & Potential Wave 5"This idea explores an Elliott Wave setup for EUR/USD on the 4H timeframe. The pair is forming a contracting triangle, which is likely completing Wave 4 of the impulsive wave sequence. Key levels to watch:
Invalidation level (upside): 1.06776
Invalidation level (downside): 1.03492
If the price holds within the triangle and breaks downward, Wave 5 could target the lower support zone near 1.00169. However, a breakout above 1.06776 could invalidate this bearish scenario.
This setup highlights the importance of patience and discipline, waiting for confirmation before entering trades. Monitor key levels closely and adjust your strategy accordingly.

GBPCHF about to drop for 125 pipsBased on my algorithms, data and statistics, GBPCHF is about to drop for more than 125 pips

Another Drop for Coca-Cola. KOIn view of a downgoing triple drive forming harmonically with extra confidence from Fibonacci confluence or ratio alignments. Momentum certainly gaining. Volatility and stochastic reversal evident. Off the chart Bollinger Band %PCT has flipped to bearish as well.

GBP/USD $$$
GU at the all TF is bullish. all the zones is valid just take LTF CONFIRMATION in it.
FOLLOW FOR MORE DAILY ANALYSIS
