DXY(Dollar INDEX) Support is not yet reached! Analysis!
Hello, Traders!
DXY, The Dollar Index keeps falling
It takes looking at the 1D timeframe to see the next support level 89-88
Till then, we might see some pullbacks, but the first real support is there
So looking at the chart, it seems like the dollar will keep falling
Before it reaches this support, and only then will reverse and go UP
Buy from support 89-88!
Like, comment and subscribe to boost your trading!
See other ideas below too!
Timeframe

Continued long forecast (History and psych level based)So far a my sentiment for this pair has been fairly accurate and I have been basing off my preferred trading strategy incorporating News, fundamentals, and technicals.
The levels of support and resistance I have mapped out above the 1.19990 level become psychological levels that have strong support and resistance rejections/breaches that can be strongly correlated to the pairs history in this zone.
The continued forecast I have mapped out is based off the end of 2017 beginning of 2018 trend that reached a target of 1.25000 which will be my ultimate target. To add to this sentiment, the trend we are seeing at the end of 2020 is accelerated comparatively.
The next retest point is 1.23000 and we will see a pullback with continuation to 1.24000 followed by consolidation and a final push to retest 1.25000. Given the acceleration of this trend based off time period we may see a push through 1.25000 to reach previous highs.
If you have the time back track to 2017 and 2018 to observe the pattern and correlated to my sentiment. I have attached two previous EURUSD one of which was spot on price action.
Thank you for taking the time to check this out please comment with thoughts and ideas.

How to trade a Range / Real case on EUR/AUDGood morning traders! Today we detected a trade opportunity in the EUR / AUD pair and we want to share with you in detail how we perform a multi-timeframe analysis to develop a setup.
🔸The first step is to start on a high timeframe chart in order to see the long-term behavior, whether it is in an uptrend, downtrend, or range.
🔸What we see on the daily chart of this pair is that it has been moving within a range for several months without a clear main trend. Of course, inside this range, there are internal trends of less temporality, which is what we will use later to be able to develop the setup.
🔸Talking about the price situation at this time, we see that it is coming out of a support zone that was tested multiple times, and that each time it faced that zone it generated an upward movement. Because of this, we are now expecting the same behavior.
🔸Decreasing the timeframe to 4H, we are preparing to analyze the short-term behavior.
🔸Following the bounce in the support zone, the price broke to the upside the Descending Trendline, this was a strong bullish sign. The problem with this break is that there was a Resistance zone very close, so we needed this zone to be penetrated to the upside before looking for an opportunity.
🔸This is what happened a few days ago. The price generates a bullish breakout, and not only that, but also begins a corrective process in a throwback to the support zone (previous resistance).
🔸Due to all this confluence of factors, we consider this pair to be a good opportunity.
🔸Using the cloning of the first impulse as a movement objective, it offers us an excellent risk-benefit ratio.

AUDUSD, Perfect play 15 min. time frame A beautiful play on AUDUSD 15 min. time frame. Price falls down to my 27 extension ( TP )

Trade Nov 2017 trend ( EUR 2017 play out and NZD 2018 play out)When pairs make significant moves to reach all time highs I back track the pair to the last time the similar move played out which was this time in 2017 for GBPUSD. I am a big timeframe trader and have read multiple accounts of traders trading based off past moves. These moves and timeframe correlate.
I have also back tracked NZD pairs to the last time we saw NZD make a push like this and it was this time in 2018. Last time EURUSD made it to this zone was this time in 2017.
These pairs are playing out exactly how they played the last time they were in these zones and it’s playing out the same months and nearly the same day.
GBPUSD- 1.42200
NZDUSD- .74000
EURUSD-1.25000


Market Profile na prática - 19/11/20 - Parte 3Nesse vídeo entramos em detalhes de uma operação realizada, bem como seus alvos.

Gold will go up anywayprice still is in long-term uptrend.
so i think its logical to look for buy opportunities in key levels only.
price now is engaged between 1884-1892usd. any close beyond this channel make a big momentum.
the best levels for buy are around 1850 and then 1800usd.

Multiple timeframe analysis for $NVAX --> very bullishMonthly, weekly, and daily charts all point north.

we can sell for a 2.5 reward to risk ratioOANDA:USDCAD
here we have a complete retrenchment of our last swing low. the mid-time time trend is downtrend .and the short-term uptrend has been broken and retested.

NZDJPY - Muti TF Technical Analysis - 6 year trendline & SupportThis is a high probability trade with an almost 6 year trend line that we broke out of this month sitting on a well tested formerly supply zone, now demand. That's it. Simple trade. 😇
The Daily price action appears to be slowing down so should be primed for a buy right at the trend line.
Set your TP wherever you like but I'll probably set the initial TP at 73.5 but have it trailing at 1xATR and ride the incoming trend.
Please follow proper risk management. I use 1.5x Daily ATR which puts my SL at 225pips. Pretty large but as a more volatile pair, this could easily test your resilience and have a large DD before going in your direction. Buy at the DD and don't be the DD 😅.
Happy trading

BTC Dancing In Triangle!Hello Community!
Before we begin please support my idea with a thumbs up and a comment. It'll be greatly appreciated and will motivate me to post a little more!
Lets keep it simple.
When taking a look at BTC/USDT we see it trading in a triangle. Bulls and bears respect these zones until it reaches close to the end where a decision needs to be made. Personally i think it can go either way but i'm leaning more towards the bullish side. Lets watch closely and see exactly how this plays out in the next 24 hrs. Each line is an area of value where you can enter a quick short position or long. remember to use your stops and good luck!
This is not Financial advice.
Safe Trading Calculate Your Risk/Reward & Collect!
Simplicity Win

Market Profile na Prática - 10/11/20 - Dólar futuroA pedidos, explico um pouco como se daria a análise no dólar futuro e utilizando as ferramentas mais populares por aqui como Profitchart.

Market Profile na Prática - 09/11/20 - Parte 1Continuando a série, veremos como a dinâmica de valor se comporta frente à notícias e, assim, trazer mais claridade para onde certo ativo está querendo ir, comparando inclusive com outros ativos.

Strong Evidence of Time Zone ReversalsAs you can see, the initial wave top uptrend high from the march low was reversed at 56 bars. The next movement from the june high to the july low was 32 days (23 bars). The following movement from the july low to the august high was, again, 32 days (22 bars). Both 32 day movements were a part of the redistribution phase of a price correction in XOP's components. The downtrend movement, again, had a minor uptick at 32 days; however, this price correction downtrend then continued further on to 56 bars. At 56 bars, a clear double bottom reversal pattern that conformed to commonly agreed upon percentages appeared. The drop from the 32 uptick down to the initial bottom was approximately 19% which fit between the normal 10-20% drawdown of a double bottom. The second bottom at 56 bars was approximately 2% lower than the initial bottom which fit within the maximum +/- 4% of a double bottom pattern. This pattern signifies a reversal of the downtrend, and was last seen in the month of March.
If we are to take this pattern at face value, since news and market geometry should not change dramatically any time soon, a 101 bar uptrend and consolidation phase began on last Thursday's trading. We, then, should look for a long position for another 21-22 bars (30 more days/November 30th). We could short into the middle of the 22-23 bar or 32 day (16 days/December 16th) consolidation phase, where a small inverse-head and shoulders pattern should appear. Again, we, could look for a long position for the 56 bar uptrend(Plus 16 days or half of the uptick within the consolidation phase), at which point, we could short again for another 32 days. Please notice, I have circled each possible reversal point and color coded them to either gains (green) or losses (red).
I also wanted to point out that there is a time correlation to 45 bars and the completion of the 56 bar trend reversal phases. As you can see, the first difference in bars was 11, the second was 22, the third then should be 33, and presumed completion of this cycle would then be 44. One more time correlation which I have yet to key out is the 57 day time zone from low to low. I have included it within the analysis because somewhere within the following unfolding trading days, I am sure this pattern will also become clear. It appears, so far, that the pattern could be 57 day, 57 days, 22 bars, 22 bars, 22 bars, ....??? Once the next uptrend and consolidation phase is finished, I am sure this time zone correlation will become clear.
Finally, the entire cycle take 360 days. This time frame is important because it is the 2.5 multiple of the universal harmonic 144, or the 30th multiple of 12. The time frame also corresponds to a perfect 2pi circular revolution of the unit circle with a radius of 1; furthermore, it signifies the 2pi period of a wave function. It is my belief that the 2 different time zone correlations described above are different wave patterns that both exist in correlation and interference to one-another within this perfect circle and wave period.

XAUUSD ShortUpon analysing the chart. I believe that this pair has potential to hit a lower area, to around the 1818 price. Looking at the bigger time frame and seeing it's direction, it gives us a better analysis in the lower time frames to predict what will happen next.

ETH / USD (9/23 - 10/23) General Timeline and TrendCreate, Practice, and Learn
This chart is meant to help identify the general trends for ETH during 9/23 - 10/23. In my past charts, I identified that ETH / USD broke out of a long term kangaroo cycle (597 days) at the resistance line of 360.
Conclusion: Since we broke the 597 day kangaroo trend, I believe we are entering a bull cycle.

EURCAD Multiple timeframe analysisGive us a thumbs up if you like our idea. Follow my profile to get new ideas and trade setups everyday
>>>>>>>>>
EURCAD
H1-Bullish trend
H4- 200 EMA resistance and short term bearish correction
Day-Sideways movement
Weekly-Bullish flag is forming
<<<<<<<<<
Its a forecast of the upcoming expected market move-Its not a financial advice

Relative Strength Index Masterclass Part 2Relative Strenght Index Part 2
In the previous masterclass, we saw the two different ways of using the Relative Strength Index as an indicator. In Part 2, we'll look out for two other ways to use RSI along with other indicators.
The two previous ways were:
1. Oversold-Overbought Region
2. 50-Level RSI Midline
Moving forward the two more ways are:
3. 2-Period RSI + Simple Moving Average (SMA)
2-Period RSI:
2-period RSI is the shortest and most volatile RSI signal which can be used
A 1-period RSI cannot be used as it will merely give just two values, either 0 or 100 as a 1-period RSI will consider values from just the last 1 candlestick
2-period RSI will generate trade signals at the local highs and lows of the predominant trend and will lead to a reversal in the market price
Therefore, 2-period RSI Strategy is also known as Mean-Reversion Trading Strategy
The 2-Period RSI will generate a signal using a Threshold of 95-5, with price above 95 in the overbought region while below 5 in the oversold region
200-Simple Moving Average:
200-SMA is a Simple Moving Average of the past 200-candlestick
When price moves above the 200-SMA, the market is moving above average and indicate a bullish trend
When price moves below the 200-SMA, the market is moving below average and indicate a bearish trend
Thereby, 200-SMA giving the predominant trend and 2-Period RSI generating trade signals.
Thus Buy when the price is above 200-SMA and RSI<5 while, sell when the price is below 200-SMA and RSI>95.
4. RSI + MACD
RSI:
The RSI will generate a signal once a predominant trend is generated using MACD
The threshold for RSI will be 70-30, with price above 70 in the overbought region while below in the oversold region
The lookback period for RSI is taken as default (14)
MACD:
MACD is a trend-following momentum indicator
MACD is calculated by subtracting 26-period EMA from 12-period EMA, resulting in MACD line
A nine-day EMA of MACD results in Signal line
When the signal line is above the MACD line indicates a bullish signal as small period EMA is greater than the long period
When the signal line is below the MACD line indicates a bearish signal as small period EMA is lesser than the long period
Thereby, MACD giving the predominant trend and RSI generating trade signals.
Thus Buy when the Signal line is above MACD and RSI<30 while, sell when the signal line is below MACD and RSI>70.
A lot more interesting things can be done using RSI, but we'll move to the next indicator in our next Masterclass. STAY TUNED
----------------------------------------------------------------------------------------
Your questions and comments are most welcome.
If you find the post useful, please like, share, and follow to make sure that you get more information once I publish it.
- Mudrex

Swing tradeWe can see a late sell signal to occur with +D above - D. Positive histogram completed a uniform figure and did not start a significant negative uniform. Both 20 and 50 EMA are heading upward while 200 EMA is preparing for a cross. Expect a bull movement at market open until 12 am US time. We will either see a significant pullback until 3-4 am before the move up or a trend continuation.
Given JPY’s strength I expect the pullback to happen. 3am is a strong pullback/consolidation time.
Check out my previous timeframe trades for a better understanding.
Last weeks USDJPY market open opened with a late buy signal indicating a sell. At 12am the trend remained strong indicating the trend continuation until at least 3am.
AGAIN MY TRADE TIMES ARE BASED OFF US EASTERN

Timeframe swing 650 Pips5 out of 5 timeframe swing trade success 650 Pips.
Histogram and ADX signal sell before a rise. Entered trade at 5pm Thur with indicators confirming initial drop.
Trend continued to 12 am. I closed as all indicators (MACD, ADX, and currency heatwaves) shifted signaling reverse. Entered the swing at 1 am and as expected slight pull back around 3am. Trend remained stronger than pullback allowing me to stay in trade until 12 pm Fri.
Easy 650 pip swing!

Timeframe Thur-Fri swing trade (720 pips)4 out 5 timeframe swing trade success.
Entered trade at 5pm Thursday evening. Sell signal on MACD was false confirmed by + D above -D on ADX. This clarifies a pullback will happen around 12 am (strong pullback occurrence through all pairs)
At 1am all indicators (MACD, ADX, and currency heatwaves) shifted entering the pullback allowing for a sell entry. A strong trend played out allowing me to to stay in the trade until 12pm Friday.
Note: My times are US. 720 Pip swing

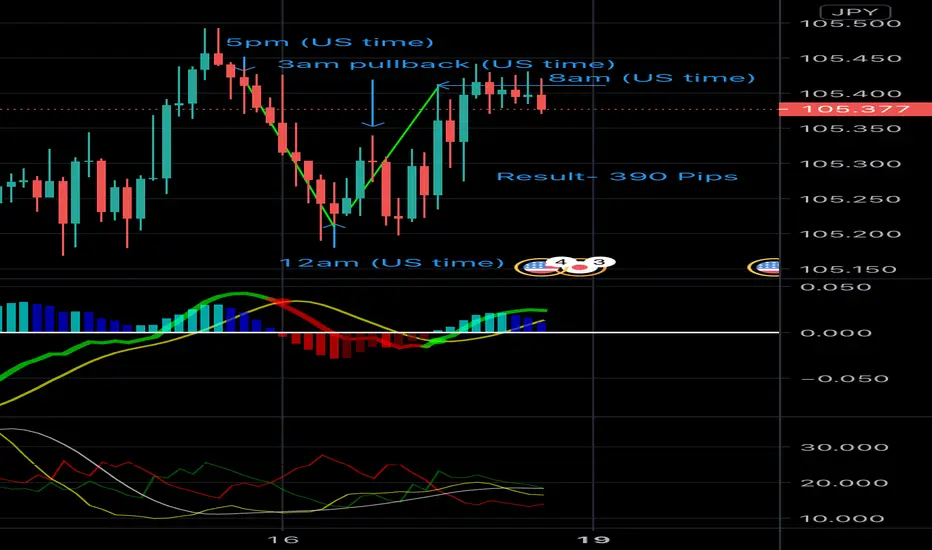
Thur-Fri timeframe swing trade 3 out of 5 timeframe swing trade Thur-fri.
Another successful timeframe swing trade with a small pullback. At the 5pm mark downward checked out. This entry point checks out my MACD/Histogram early indicator strategy.
The trend stayed true until my 12 am mark. All indicators (MACD, ADX, and Currency heat waves) had significant shifts. This gave me conformation to enter the buy. When the 5pm to 12 am swing is confirmed the new trend will play out until at least 8am.
3am shows a pullback. MACD Histogram indicates the pullback will correct to the uptrend hitting the target 8am mark. Personally I closed out at the peak of the 8am bullish candle.
390 Pip timeframe swing trade. It is important to follow the pullback rules by determining the swing trade will reach the timeframe marks with the established trend. You will fail miserably with this strategy if you get excited about the pullbacks and close out your trade. I learned from this mistake.