Bitcoin - Is the top already in?Introduction
This chart analyzes Bitcoin’s cyclical timing. The focus is on time, not price. It examines the number of days between structural moments such as cycle tops, cycle bottoms, and halvings. By comparing these intervals, we can understand rhythm and consistency. This helps determine whether the current cycle top may have already formed in early October.
Cycle Top to Cycle Bottom
The period from cycle top to cycle bottom represents the bear phase after a market peak. In the previous two cycles, this phase lasted about 365 days each. This pattern suggests that the market typically needs a year to recover. After that, a new accumulation phase usually begins. If the pattern holds, it provides a fairly predictable window for correction. It marks the transition from euphoria to rebuilding.
Cycle Bottom to Cycle Top
The phase from cycle bottom to cycle top defines the bull run itself. In the last two cycles, this period lasted 1,065 and 1,066 days. That is just under three years. During this time, Bitcoin rose from deep accumulation to a new all-time high. Based on current data, 1,065 days points to early October. In that month, a new ATH was reached. This makes the current phase consistent with past cycles. It supports the idea that the top may already be in.
Cycle Top to Cycle Top
The full duration from peak to peak measured 1,461 and 1,431 days in previous cycles. This shows a clear recurring rhythm. The market moves in fairly consistent four-year patterns. Comparing this with the current cycle shows a slight extension. If the peak occurred in early October, this cycle is longer than the last. That may suggest a more mature market. Growth is slower but structurally stronger.
Halving to Cycle Top
The time between a halving and the next cycle top is key. Halvings affect both supply and market sentiment. In past cycles, this interval was 518 and 548 days. We are now exactly at day 548 since the last halving. This aligns perfectly with historical timing. It supports the idea that the top was reached in early October. The moment fits the halving-to-top rhythm observed in earlier cycles.
Conclusion
Based on this timing analysis, it is very likely that the cycle top formed in early October. The bottom-to-top duration of 1,065 days and the halving-to-top of 548 days confirm this. Both match previous patterns. The current cycle is slightly longer than earlier ones, suggesting a slower rhythm. If Bitcoin sets a new ATH later, it would mark an extended cycle.
Timing alone does not guarantee future price direction. Macro factors, policy shifts, and liquidity events can all change the rhythm. Use timing cycles as context, not as prediction. Combine them with price structure and on-chain signals. Maintain active risk management, since longer cycles often bring higher volatility and larger deviations from historical averages.
Timing

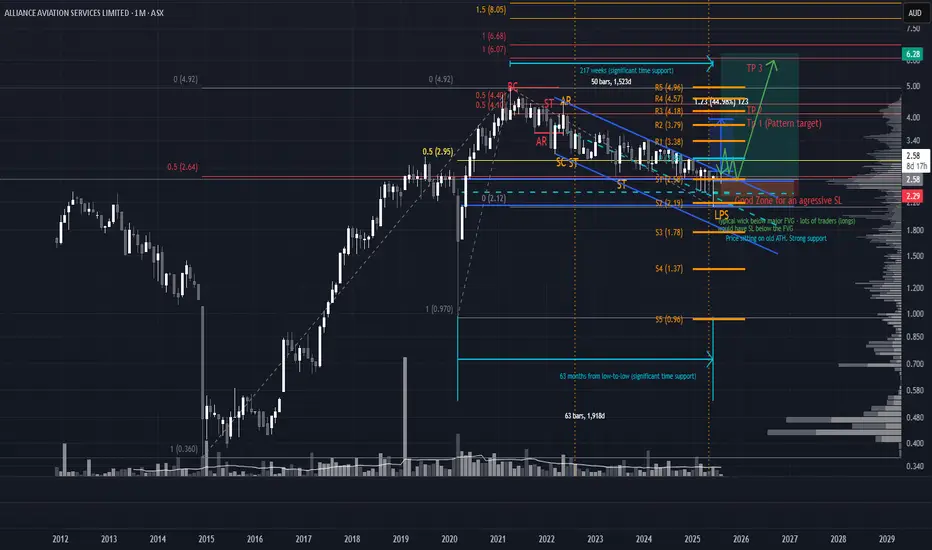
Don’t Sleep on AQZ: Smart Money May Already Be PositionedAQZ — 4-Year Reaccumulation + Bullish Doji = Strategic Long Setup
AQZ is looking primed for a long play. Price has been reaccumulating for ~4 years, and June printed a bullish monthly doji—a classic liquidity sweep. Price pierced the major fair value gap (FVG) from the May 2020 pump candle, tested the yearly S2 pivot, and found support right on the EQ of the range. That’s a trifecta of demand confluence.
Entry Scenarios Based on Risk Profile
Aggressive Entry Enter now with a tighter stop loss around $2.29, which aligns with two EQ zones: the June 2025 demand structure and the channel EQ. This setup suits high conviction traders looking to front-run the breakout.
Conservative Entry Use a wider stop beneath the Last Point of Support (LPS) for more breathing room. This protects against deeper retests while still respecting the bullish structure.
Preferred Entry (Low Risk, High Confluence) Wait for price to break and retest the channel, then consolidate above it. This would also confirm a break of the major 50% resistance projected from the all-time low to all-time high—a powerful signal of trend continuation.
Strategic Overlay
This setup blends long-term structural strength with tactical precision:
4-Year Base = Institutional accumulation
Doji Sweep = Smart money absorption
Multi-level confluence = High-probability AOI
If price rallies from this zone, expect momentum to build quickly. But as always—one step at a time. Let price confirm before scaling in.
*please note, arrows are not time analysis just pathing
Bitcoin: Interconnectedness of Defining CyclesJust a followup analysis on scalable structure from "Natural Patterns & Fractal Geometry" ed idea.
Additional Regularities:
2018 Downtrend Phase Fib Resonation:
Fibonacci ratios are not just mathematical abstractions; they manifest in Bitcoin's market structure due to human behavior and market psychology.
2020 Uptrend Phase Fib Resonation:
Unconventional use of Fibonacci ratios highlights areas where price has shown significant reactions. These levels act as dynamic support and resistance zones, underscoring the fractal and cyclical nature of Bitcoin's price movements.
2021 - Late 2022 Crash Metrics More detailed breakdown of emerging randomness:
The repetitive alignment of market cycles with Fibonacci levels underscores Bitcoin's tendency to oscillate between predictable extremes, offering insights for timing entries and exits.
Distinct cycles are clearly visible, separated by major tops (e.g., ATH in 2013, 2017, and 2021) and bottoms (e.g., the 84.12%, 72.26%, and 77.57% corrections). Each cycle adheres to Fibonacci retracement and extension levels, demonstrating a self-similar structure .
Price expansions align with Fibonacci extensions (e.g., 1.618 and beyond), showing that Bitcoin’s growth phases are not random but rather guided by harmonic principles.
The ascending channels mapped through Fibonacci ratios capture both the bullish and corrective phases, showcasing the market's bounded yet fractal rhythm .
The percentage swings (+2484.44%, +12804.20%, +1692.21%, +600.07%) highlight the explosive nature of Bitcoin during expansion phases, followed by steep corrections. These as well align with Fibonacci proportions, providing a blueprint for market rhythm.

Next Tradable Cycle Turns (Intraday)This chart contains the timings for several turns and accelerations in Bitcoin for intraday setups.
Make sure the price is at a meaningful support or resistance when coincident with a vertical line.
This technique also derives some horizontal lines for support and resistance, but you should use your levels as well.

BTC Intraday Cycle ClustersThese are mathematically calculated cycle clusters based on hourly price and time data.
Cycle clusters can signal potential shifts in price action, including:
Changes in direction
Momentum shifts (acceleration or deceleration)
Breakouts
Gaps
Bold vertical lines indicate periods where more cycles are clustered. Dashed lines reflect clusters with fewer overlapping cycles.
I've also added some charting work—mainly channels—to help visualize and potentially trade the price movement between clusters and between channel lines.
Questions are welcome!

HBAR Hedera BREAKOUT Still in Play? LONG Bulls Are Still Hungry!I'm getting a lot of messages and feedback regarding the heads up I posted earlier in the week with the
🟢 HBAR BIG TRIANGLE BREAKOUT POST 🟢
The BIG QUESTION is... "What Next for HBARUSD?"
&
The ANSWERi is SIMPLE..."We monitor VOLUME and RIDE THE WAVE"
👍Have A GREAT WEEKEND.
&
REMEMBER TO FOLLOW 🟢SeekingPips🟢 to stay AHEAD OF THE PACK.👌

HBAR Hedera BIG Triangle BREAKOUT? HBARUSD Looking to EXPLODE!As we comb through a handful of Cryptos this morning HBAR is another one one SeekingPips RADAR.
ℹ️ A simple triangle formation will inevitably lead to a BREAKOUT.
STATISTICS tells us that there is a HIGHER PROBABILITY of a brekout to the UPSIDE as price will favour the TREND DIRECTION prior to the CONSOLIDATION.
As 2025 has barely begun it's not a bad idea to position yourself from now.
SUPER SECRET 🟢SEEKING-PIPS🟢 LESSON IS...
One of our TRADING 101 lessons it's BUY ABOVE the YEARLY OPEN.
It really is a great filter I have used for many years and one of the key filters I teach new traders.
SHHHH DON'T TELL ANYONE ELSE 😉
✅️I would appreciate your follow a BOOST OF THIS POST.
✅️I will continue to share my 20+ years of TRADING WISDOM as long as I have interaction on my posts.
HAVE AN GREAT DAY❕️

ADAUSD BUY LONG ADA when TIME & PRICE MEETSeekingPips Shows Once Again That TIME trumps PRICE ADAISD

GME - Gamestop Squeeze Imminent: History Repeats ItselfBelow are essentially identical paths I've been tracking from around $20. I think we are completing the cycle for the next large leg up.

Hourly Bitcoin Timing: Spotting Future Pivotal MomentsHey everyone!
I am going to share my timings for the BTCUSD pair until the end of this month!
In the chart, you'll notice vertical lines indicating pivotal moments. These are key times to consider opening a position, complementing it with your own Technical Analysis.
To illustrate, I’ve also included past timings for reference. Check out the three past vertical lines (red ones) on the chart:
8th September: This timing corresponded to the breakout of the descending trend line.
13th September: This timing marked the end of a short consolidation stage, which was followed by a pump.
16th September: This is from today. This recent timing aligned with a potential breakdown of an ascending trend.
Keep an eye on the upcoming timed moments (black and gray vertical lines) and complement it with your basic TA before opening a position.
Note: Black vertical lines are more likely to correspond to future pivotal moments compared to gray ones.
Happy Trading!

There is NO Right Time, Just time | $388 ProfitDoesn't matter who you are we all have the same 24 hours in a day, what you do with it is what dictates how successful you are.
We have to be very concerned with how we make use of the time at our disposal.
That is all.

GBPUSDIn general terms, I can see that the price is in a bearish channel, accumulating a large part of the supply and inducing it to continue selling. I stick with my plan to sell until my psychological point of 1.27772 since in a week that is my breakout of the BOS. Once I get that liquidity point I will be very attentive since it is a greater induction therefore I will take advantage of all that offer and I will join the sharks to buy and take my part. But since the market is present today, it is giving me a beautiful sales opportunity.

Timing the market. IWMWhat we know? Oil is likely bullish in 2nd Half (24'). BTC leads the small caps. TNX usually works as a head wind (and has took a pause). Rate cuts are very bullish for small caps and financials benefit in this environment?
technically; the 20dma works as a driver. 50dma and 200dma just gives you context. You can add MACD to confirm things.
Im speculating that small caps breaks out in mid April.
U can fact check using IWM/SPX.

1:18!KWH's Journal Entry #47
"Timing"
A. Which session is being traded?
—North America! (8AM-11AM)
"Level"
B. Which key level is price trading from?
—Week Low!
"Behavior"
C. What behavior is price exhibiting at the key level?
—Star!
Conditions are met!
Place the position where most optimal!

1:19!KWH's Journal Entry #46
"Timing"
A. Which session is being traded?
—North America! (8AM-11AM)
"Level"
B. Which key level is price trading from?
—Week Low
"Behavior"
C. What behavior is price exhibiting at the key level?
—Star!
Conditions are met!
Place the position where most optimal!

1:18!KWH's Journal Entry #44
"Timing"
A. Which session is being traded?
—North America! (8AM-11AM)
"Level"
B. Which key level is price trading from?
—Equilibrium!
"Behavior"
C. What behavior is price exhibiting at the key level?
—Star!
Conditions are met!
Place the position where most optimal!

1:10!KWH's Journal Entry #44
"Timing"
A. Which session is being traded?
—North America! (8AM-11AM)
"Level"
B. Which key level is price trading from?
—00!
"Behavior"
C. What behavior is price exhibiting at the key level?
—Engulfing!
Conditions are met!
Place the position where most optimal!

1:10!KWH's Journal Entry #43
"Timing"
A. Which session is being traded?
—North America! (8AM-11AM)
"Level"
B. Which key level is price trading from?
—00!
"Behavior"
C. What behavior is price exhibiting at the key level?
—W Pattern! (C)
Conditions are met!
Place the position where most optimal!

1:5!KWH's Journal Entry #42
"Timing"
A. Which session is being traded?
—North America! (8AM-11AM)
"Level"
B. Which key level is price trading from?
—50!
"Behavior"
C. What behavior is price exhibiting at the key level?
—M Pattern! (C)
Conditions are met!
Place the position where most optimal!

SPY PathThis is what SPY will do near and mid term:
- Begin drop somewhere between 11/3 (today) and 11/8 (next week) to 398-405 range [ 402 point target by end of November 2023 ]
- Bounce/relief rally to 434-444 by mid to late December 2023
- Massive drop in 2024 to 360-380 minimum, possibly as low as 290s
Short it, buy it, then short it again. These are very tradeable moves and they'll hit - follow the red path.

SP500: Single Base ProjectionDefining the levels of reversals in terms of fibonacci ratios derived from Convid19 crash. Second alternative colored fib channel is placed in respect to established unity.
Old version contained colored fib channels covering period from 2008 crash.
Whereas in current version, the interconnectedness in fibs are based on metrics of Covid19 volatility ONLY . Derived lines capture the randomness of price action.
Also, downward channels are adjusted to the frequency of shorter composite cycles.

How to Profit from Trend Exhaustion - XAGUSDHow much ... and when? What else is there to know? Enjoy this multi-timeframe tour of the XAGUSD chart to learn how I find MAJOR reversals and targets BEFORE price action reaches them. As always, I strive to produce charts that speak for themselves, and yet this is my video debut here on Tradingview, and I could not be more pleased to narrate this unusual experience. If you enjoy it or, better yet, if you learn from it, then consider this a preview of forthcoming weekday morning livestreams, which I hope you will follow. Until then, be liquid!
