Tsla new highs Price broke below the channel so retail traders are now short. Smart money will push prices to new highs to stop them out providing liquidity to sell into. This is how a top is usually formed in all time frames.
TOP

QQQ channel breakout volume analysisEvery time price breaks below this uptrend channel, the volume is getting lower and lower and today, the volume is almost like nothing. I think this means that smart money has bought as much as they can from the weak hands. Retail traders shorted each time it broke below while smart money has bought from them and most retail traders will have their stop at the highs. Smart money will push prices to new highs forcing retail shorts to buy and retail longs will also buy on the breakout. This will provide the liquidity needed for large traders to sell into. Maybe they will gap prices up on the news to end the uptrend and cause urgency for retail traders to buy at the top.

USDJPY – STRONG SUPPLY REJECTION, RANGE FORMATION & UTA SCENARIOUSDJPY is currently reacting from a clearly defined strong supply zone, where price previously formed a rounded top, signaling distribution and seller dominance. After the rejection, the market moved lower and entered a range, showing indecision between buyers and sellers. The highlighted buyer zone is acting as short-term support, while repeated tests of the mid-level indicate liquidity being built.
At present, price is forming an UTA (Upthrust After Accumulation)-type structure near resistance. If price breaks and holds above this level, continuation toward the upper marked target becomes likely, aligned with a liquidity grab above the range. However, failure or rejection from this zone would confirm seller strength again, opening the path toward the lower target inside the demand zone area.
Overall, this is a reaction-based market: confirmation above resistance favors upside continuation, while rejection favors a bearish move back into demand. Patience and level-based execution remain key in this structure.

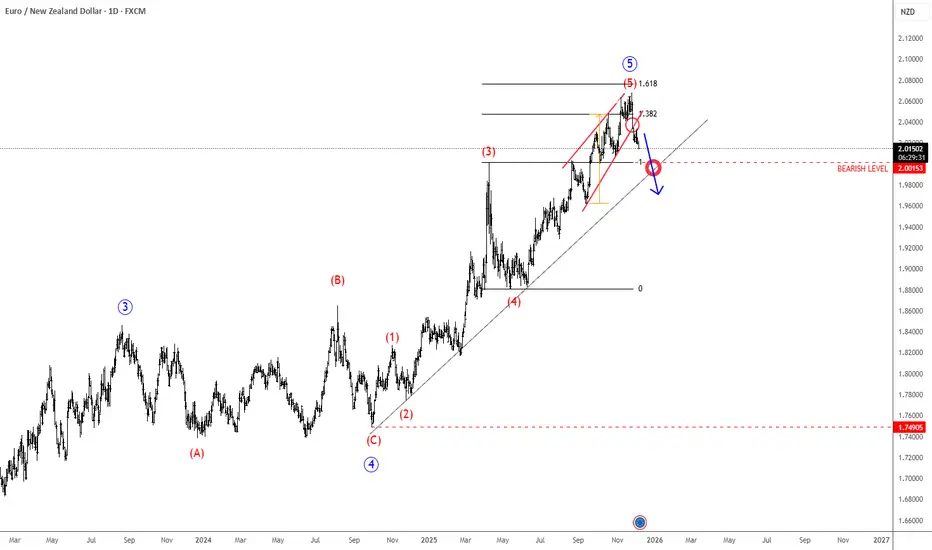
EURNZD May Have ToppedEUR is coming sharply to the upside against NZD, hitting new highs, however, looking at the wave structure, we still see the market is in a fifth wave, but it appears that this wave five has a much more extended structure than initially expected. Still, it looks like the final leg of the impulse up from the 1.7490, with the shape of a wedge now at the top, with potential reversal happening as prices comes down from a wedge, signals more weakness, especially if slips back below 2.00 level.
The Airplane Game of 1981 — And the Crypto Hope That Replaced ItThe Anatomy of a Ponzi Scheme — How Does Bitcoin Compare?
In the summer of 1981, something strange began sweeping across the suburbs of Long Island, New Jersey, and Connecticut. Neighbors invited neighbors to “investment dinners,” where someone would sketch a simple drawing on a napkin: an airplane.
One Pilot.
One Co-Pilot.
Two Crew.
Eight Passengers.
You handed $1,000 directly to the Pilot and took your Passenger seat at the bottom. Your only job was to bring in friends. When eight new Passengers arrived, the Pilot “flew off” with $8,000, the plane split in two, everyone moved up a row, and the process repeated.
For a few cycles, it felt like alchemy. Hairdressers, teachers, firefighters—ordinary people—were suddenly collecting eight times their money in a matter of weeks. Local papers ran breathless human-interest stories. Dinner tables buzzed with the same excited whisper:“It works.”
Then, seemingly overnight, the phones went quiet. Everyone already knew someone who had joined. By 1983, the Suffolk County DA estimated that 85–90% of players lost their entire $1,000.
What appeared to be social networking magic turned out to be a Ponzi Scheme .
How the Airplane Game Actually Worked
The numbers themselves tell the story:
You paid $1,000 to become a Passenger on the bottom row. When eight new passengers joined, the Pilot at the top cashed out $8,000, the plane split into two new planes, and everyone moved up one row.
Your only way to get paid was to recruit enough fresh people so that you eventually reached the Pilot seat — but every round required twice as many new recruits as the last, guaranteeing that almost everyone stayed stuck as a passenger forever while a tiny handful at the very beginning flew off rich.
By the tenth round, the game required 4,096 brand-new players to keep the fantasy alive for people already invested in the scheme. In a region with a couple of million residents, the game was mathematically doomed to crash by round 11 or 12.
Not bad luck.
Not mismanagement.
Mathematical Inevitability.
The Whales Who Flew Again, and Again
One detail from the 1980s rarely made the newspaper headlines: most people who cashed out $8,000 as a Pilot immediately bought back in as a Passenger on one of the new planes — sometimes the same night.
Some flew three, five, even eleven times, collecting $24k, $40k, $88k while everyone else was still waiting for their first payout. They told themselves (and everyone else) they were “helping friends move up” or “keeping the game strong.”
In practice, they were simply the earliest, best-connected whales, recycling their winnings to harvest the next wave of optimism.
When the music finally stopped, the same small circle that had preached “this can go on forever” quietly walked away rich, while the late passengers discovered their seats were now worthless.
Bitcoin is NOT the Airplane Game — But the Music Rhymes
Bitcoin is not a classic pyramid or Ponzi scheme. There’s no Pilot at the top, no recruiter bonuses, no secret organizer skimming profit. You can exit anytime you want.
But when you place an Airplane Game’s flight path beside Bitcoin’s cyclical booms and busts, the emotional cadence is eerily familiar.
Each cycle produces smaller multiples. Each requires more new capital than the last.
The pattern is recognizable:small community → early outsized wins → viral success stories → broader adoption → diminishing returns.
The difference is that Bitcoin stretches the timeline from weeks to years, and swaps social networking and gossip for global media/establishment hype.
Where the Psychology Overlaps
Despite the mechanical differences, the story dynamics rhyme almost perfectly:
AIRPLANE Game 1981:
"My sister-in-law just made $8,000 in three weeks!"
"Just find 8 more passengers and you're golden!"
"It all collapses when no new recruits can be found."
BITCOIN 2025:
"A kid I work with bought Bitcoin at 3k and he just retired a multi-millionaire!"
"Just HODL, dude, the next trillion is incoming—it's a winning lottery ticket, guaranteed!"
"The rocket launch stalls and crashes when there are not enough new marginal buyers."
Early winners as the marketing and finance engine
The encouragement given to newcomers
The implied promise1981: “This can’t stop—everyone wants in.”
2025: “There are billions who still don’t own any Bitcoin.”
The fragility
When new inflows slow, gains slow, and the price softens. The Airplane Game needed eight new Passengers.
Bitcoin requires a constant pool of new optimistic buyers bringing hundreds of billions in new investment capital to the game.
The emotional script stays the same even if the technology changes.
And Yet, the Differences Matter
Bitcoin has:
no central coordinator to arrest,
a hard supply cap rather than infinite issuance,
open-source transparency,
legitimate use cases in a culture of exotic financial engineering,
and a philosophical origin story unmatched in modern finance.
These distinctions are real. They’re worth acknowledging.
But they don’t override a simpler observation:price movements still depend overwhelmingly on new waves of believers arriving to absorb the hopes of earlier ones.
Whether that system is fair or sustainable depends on who you ask.
The Human Cost of the Story
I’m not worried about the hedge fund that bought at $100,000 and sells at $70,000. Losses are part of their business model, write-offs.
I’m worried about the 23-year-old barista who took out a personal loan in November 2025 to buy in because an influencer said $100,000 was “the new floor.”
I’m worried about the divorced father who sold his paid-off house to “buy the dip” at $101,000 after being assured that Bitcoin was “the apex property of the human race.”
I’m worried about the teenager scrolling through home-ownership stats, wage stats, fertility stats—and deciding the only remaining path to the middle class is to gamble everything on a digital asset hitting a million dollars as he sleeps some day in the distant future.
These are the passengers who were handed the last few seats on an airplane that has already circled the globe several times.
They deserve better than a lottery ticket with a compelling philosophical backstory.
From Rebellion to Ritual
Bitcoin began as a beautiful act of rebellion—an elegant escape hatch from a financial system riddled with moral hazard. For a while, it truly was something different.
But somewhere along the way, it stopped behaving like a protest movement and started acting like another speculative ritual. It speaks the language of freedom but trades like a sputtering momentum engine. It promises empowerment but delivers volatility and diminishing returns, which lands hardest on those with the least to spare.
None of this requires malice.Some systems continue simply because narratives are profitable.
Closing Thoughts
The Airplane Game whispered to ordinary people in 1981: “You don’t have to be smart—just play the game.”
Bitcoin whispers something almost identical today, only in higher resolution.
Maybe the most compassionate thing we can do for the next young person about to YOLO their rent money is simple: sit them down, open the old Airplane flight path, tell them the story, and ask, gently:
“Does any of this feel familiar?”
Because if the music stops again, it won’t be the whales or the establishment who get stranded.
It will be the passengers who were told they might someday be pilots.
-------------------------------------------------------------------------------------------------------------
The Current Freefall & Turbulence
Technically speaking, for passengers concerned that the oxygen masks are about to drop from overhead compartments, it appears as though Bitcoin is attempting to mitigate its recent nosedive.
My chart work suggests it’s wise to expect more turbulence and one or two more marginal new lows into the 79,495 - 71,588 target window before a more secure resumption of lift occurs.
Whether the forthcoming lift-off will take Bitcoin back to new all-time highs, as Henrik Zeberg suggests, is quite another matter.
Giving Henrik the benefit of the doubt, I am labeling the current decline as a 4th wave basing process at the primary degree.
This Elliott Wave analysis is the most charitable interpretation for Bitcoin Bulls.
In contrast, if the anticipated Zeberg rally fails, the crest at 126,272 might be in place for a very long time.

Silver - Warning #1 IssuedSilver has seen uninterrupted gains for a period of over 1.5 years. It's going to just keep going up forever right? Not necessarily...
Our systems at Bullfinder-official have identified potential risk in MCX:SILVER1! ,
issuing Warning #1.
Silver has been moving aggressively to the upside for some time now, hitting +166% since Feb of 2024, with momentum deemed as Bullish since March of 2024.
Although this may not be the exact top of this run, we would like to make note that current regions present greater levels of risk and may warrant greater caution.
We're inspired to bring you the latest developments across worldwide markets, helping you look in the right place, at the right time.
Thank you for reading! Stay tuned for further updates, and we look forward to being of service along your trading & investing journey...
Disclaimer: Please note all information contained within this post and all other Bullfinder-official Tradingview content is strictly for informational purposes only and is not intended to be investment advice. Please DYOR & Consult your licensed financial advisors before acting on any information contained within this post, or any other Bullfinder-official TV content.

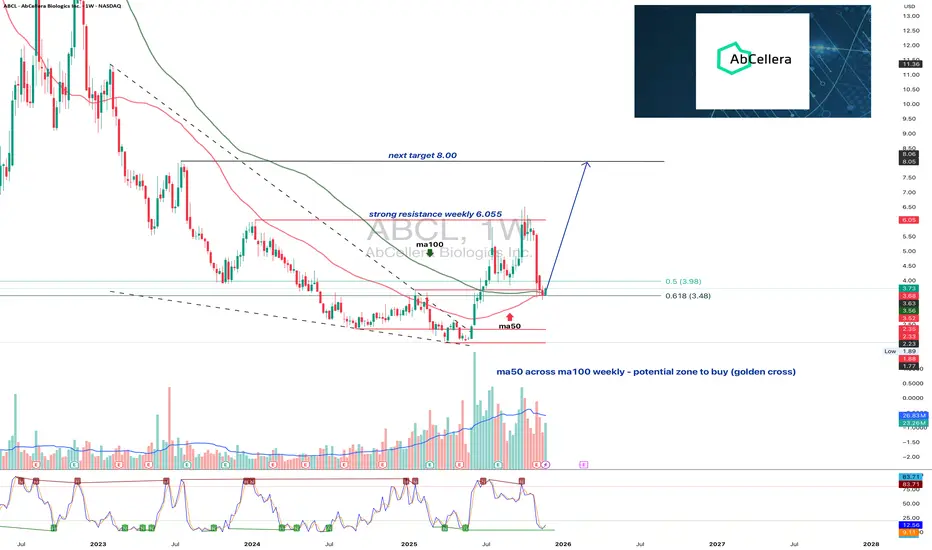
ABCL1W: turning around or just another biotech placeboABCL returns to key weekly support and prepares for the next move
ABCL has tested the strong weekly support zone between 3.48 and 3.98. This area combines Fibonacci retracement levels, a previous breakout retest and an important signal with ma50 crossing above ma100. Such a combination often forms a reliable accumulation zone. Buyers reacted immediately from this region which confirms active demand. The nearest key resistance is located near 6.05. A confident close above this level opens the path toward the next target at 8.00.
AbCellera operates in the biotechnology sector and develops advanced antibody discovery platforms for pharmaceutical partners. Revenue remains uneven due to milestone based payments. However the company maintains a strong balance sheet, significant cash reserves and a growing number of active programs. Improving sentiment in the biotech sector enhances the fundamental backdrop.
As long as price remains above the 3.48 to 3.98 area, the structure retains the signs of a forming medium term base. If this zone is lost, the market may shift into wide consolidation. The present reaction suggests that buyers are defending the level with confidence.
Support levels often speak louder than headlines. The chart usually warns long before the news arrives.
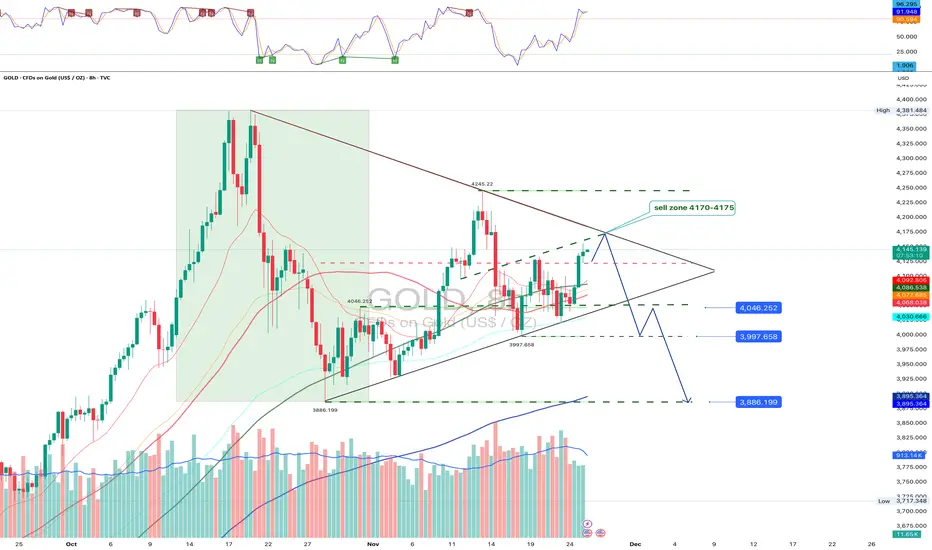
GOLD approaches a critical inflection inside the triangleGold is compressing inside a large triangle on the four hour chart and has returned to the twenty four hundred seventy area which acts as the main sell zone at four thousand one hundred seventy to four thousand one hundred seventy five. The market still fails to break above this region and preserves a sequence of lower highs. A breakdown through the triangle support may open the path toward four thousand forty six three thousand nine hundred ninety seven and three thousand eight hundred eighty six where strong liquidity and the two hundred period moving average converge.
The fundamental picture as of November twenty fifth remains mixed. United States inflation is cooling more slowly than expected which keeps treasury yields elevated and limits the attractiveness of gold as a defensive asset. Market expectations for a Federal Reserve rate cut in the first half of next year persist which supports the metal during pullbacks. Demand from Asian jewelry markets stays muted which adds pressure when yields rise.
Price is approaching a decision point. A rejection from the sell zone may send the market toward four thousand forty six three thousand nine hundred ninety seven and three thousand eight hundred eighty six. A confirmed move above four thousand one hundred seventy five will invalidate the bearish scenario and allow a possible breakout to the upside although the market still looks weaker than the seller for now.
Gold is precious without doubt but inside a triangle nothing shines too confidently until the market shows its choice.
BTC Wyckoff (pt. III), Pi Cycle Top, 350 SMA, and SPY Is A SELL!Trading Fam,
Was this the top? Where is Bitcoin going? Where are stocks going? Will the selling continue? How long? Can we find some targets? Where should we look to start DCA'ing back in? These are hard questions. Let's take a look at what my charts are showing us.
✌️Stew

Megaphone Broadening Top Likely on SPXOver the last few months, the market has been increasingly difficult to trade as it searches for direction. Stop losses were triggered for longs on Oct 10, and shorts were equally liquidated on the run up beginning Oct 27th. What has formed is a broadening top, confirmed by two points of touch on each side of the pattern.
Broadening patterns can go in both directions, but supporting information suggests this is the end of the bull market:
On the weekly chart, there is a MACD cross.
There is a clearly defined 5 wave structure from the October 2022 bottom. It is a textbook example of Elliot Wave Theory.
Multiple analysts have shown that stock valuations are near historical extremes. It is highly likely that the market is in an AI bubble.
How am I trading this? I have sold all long positions. I am swinging puts that I will close out at the bottom of the megaphone. Once a breakout occurs, a pullback is highly likely to follow, even going so far as to return inside the pattern (60% of the time). If a pullback does occur, I'll load up on long dated puts to profit off a potential bear market.

EURUSD 1D: bearish bias remains - trend break is confirmedEURUSD confirmed a break of the major daily trendline and failed to reclaim 1.1600. Buyers lost structure, every bullish bounce is absorbed. Market shows a clean shift to downside momentum.
Expect a corrective pullback into 1.1600–1.1700 (Fibo 0.382–0.5). This area remains the primary supply zone and ideal entry for continuation shorts.
Targets:
• 1.1407 — first liquidity zone
• 1.1389 — bearish continuation trigger
• 1.1150 — major demand zone and final target
Expectations vs reality: buyers hope for reversal, price structure signals continuation down. No guessing - trade what market prints.

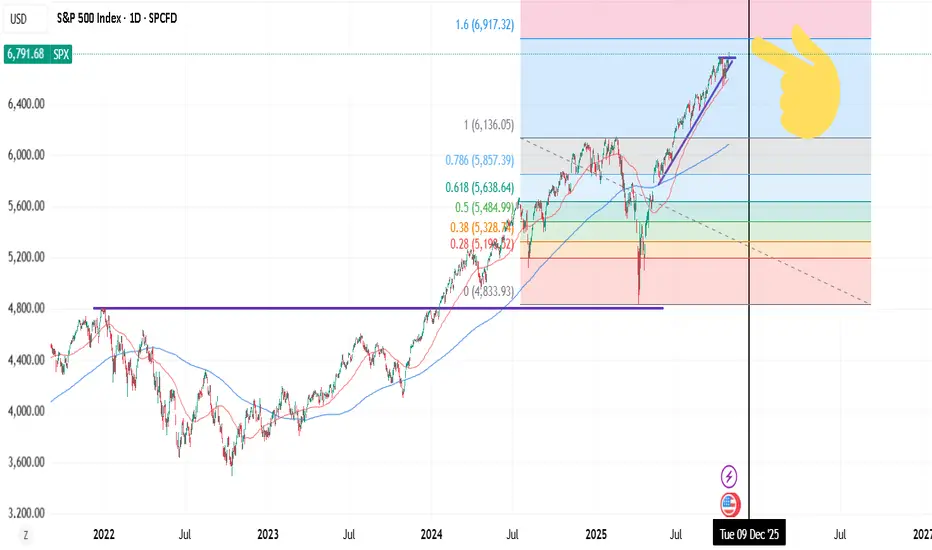
1.6 FIB Ceiling - Stock market correction soon in NOV/DEC.You can apply 1.6 FIB to FAANG or QQQ for high probability ceilings. VIX "structure" (pattern) or setup also indicates it. Stocks forming a sharp "wedge drop", extension from 50dma.
Bullish near term (probably?), correction in NOV/DEC.
I wonder if the first 5 (monthly) trading days in NOV are not volatile AF. 😂
DXY relative perf. to predict market tops.Using intermarket analysis. During expensive markets, demand for US dollar grows - and often it correlates with stock market tops. Step further - we can use intermarket analysis of DXY/SPX. Look for trend break out and Higher Lows in the structure. ✅

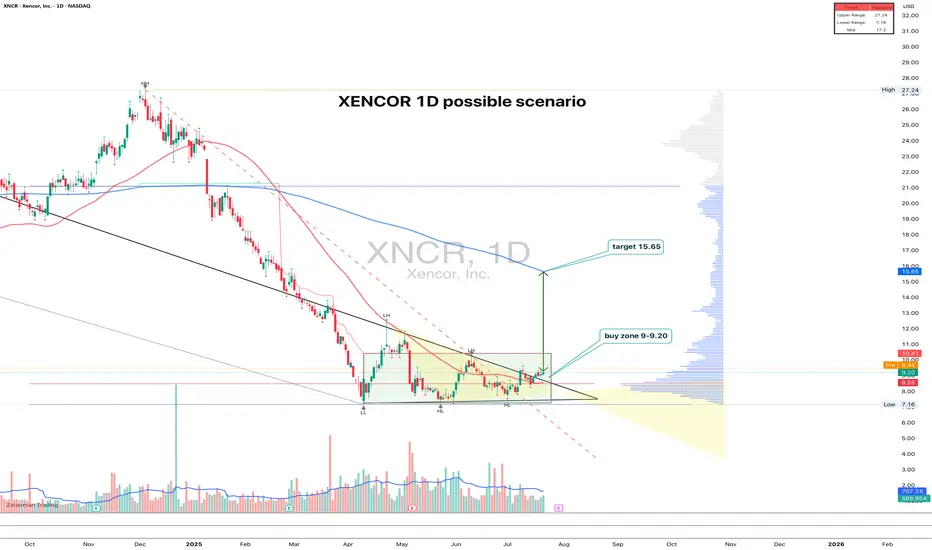
XNCR 1D time to growth?XNCR: the uptrend hasn't started yet - but someone's quietly accumulating
XNCR spent nearly 4 months building a base and finally broke out of consolidation with a clear upward move. The pattern looks like a range with a narrowing triangle at the bottom — the breakout came with rising volume. Entry makes sense in the 9.00–9.20 zone on a retest. Volume profile and Fib levels confirm the importance of this area, plus there’s a clean support shelf at 9.00. The target is 15.65, which aligns with the height of the structure. The 200-day MA is still above price, but a push beyond 11.00 could open the door to acceleration.
Fundamentally, Xencor is a biotech company focused on monoclonal antibodies. After a tough 2023–2024 and cost reductions, the market is beginning to price in signs of recovery. Key partnerships remain intact, the pipeline is alive, and recent data for XmAb7195 was well received at industry events. Valuation remains low, and biotech ETF flows are slowly picking up.
Still a relatively low-volume name, but the structure is clean, the setup is readable, and fundamentals are turning. With a tight stop below 8.50, the risk-reward looks solid.
AUDCHF 1D - wedge falls, price risesOn the daily chart AUDCHF shows a classic falling wedge, already broken to the upside with a retest of the 0.5250 entry zone. Price is consolidating above this level, giving bulls a chance to build momentum. The nearest targets are 0.5295, followed by 0.5374 and 0.5448. Moving averages are flattening, while RSI, recovering from seller pressure, supports a potential upward trend.
Fundamentally , the pair reflects the tug-of-war between risk appetite and safe-haven demand. The Aussie gets moderate support from commodity strength, while the franc remains a defensive play. If global risk appetite stays firm, capital is more likely to flow out of CHF into higher-yielding currencies like AUD.
Tactical plan: consider longs around 0.5250, with targets at 0.5295, 0.5374, and 0.5448. If bulls hold above the breakout zone, the structure may turn into a solid bullish leg.
The only question is: will the franc stay defensive while the Aussie fires up the barbecue?

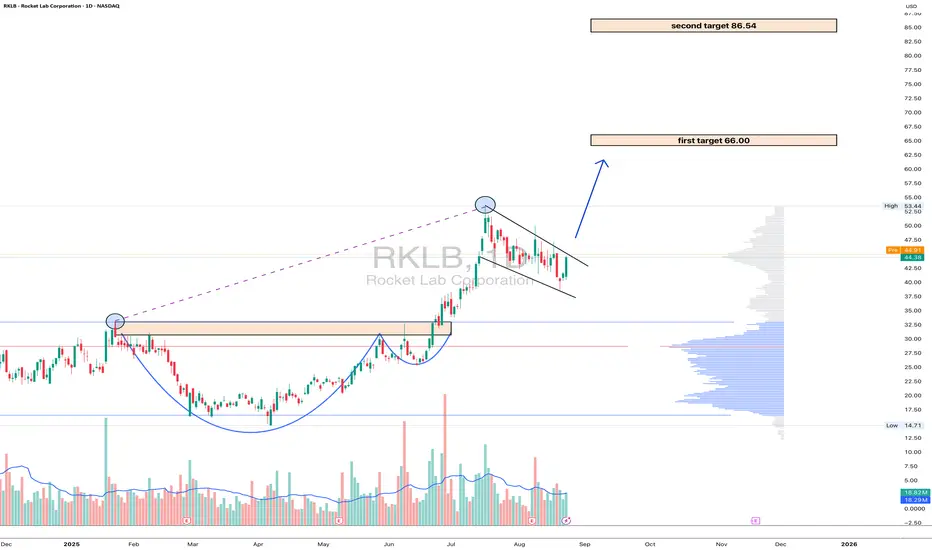
RKLB: the rocket is fueled and ready for orbitOn the daily chart of Rocket Lab (RKLB) , the price is trading at $44.38 after a confident breakout above key consolidation zones. Technically , the break of the $40 level confirmed the strength of the bulls and solidified the upward structure. The next target is $66 - a strong resistance aligned with the Fibo extension and if momentum holds, the market could extend toward $86.54, where long-term levels converge. EMA indicators remain below the price, reinforcing the bullish outlook.
Fundamentally , Rocket Lab stands as a leader in the small-launch vehicle sector, strengthened by contracts with NASA and consistent commercial demand. Amid growing interest in the aerospace industry and rising competition with SpaceX, the company benefits from diversified revenue streams and steady launch schedules. On the geopolitical side, increased defense programs in the U.S. and allied nations provide additional long-term support.
Tactically , the zone above $40 now acts as a support: as long as price holds above it, the bullish scenario remains intact. Targets are set at $66 and $86.54. Short-term corrections are possible if the market overheats, but the broader structure points upward, with institutional flows suggesting accumulation.
If this scenario plays out, Rocket Lab won’t just launch satellites - it’ll launch portfolios into orbit.
BABA: triangle with tensionOn the weekly chart, BABA has already formed a golden cross - price is above both MA50 and MA200, confirming a bullish trend shift. The stock is now approaching the upper edge of the symmetrical triangle and the key resistance at $122, which also aligns with the 0.5 Fibonacci level.
The numbers inside the triangle represent the contraction phases, not Elliott waves. This is a classical consolidation before a potential breakout. If the $122 level is broken and retested, upside targets are $128 (0.618), $137 (0.786), and eventually $148–181 (1.0–1.618 extension).
Volume is rising, MACD is flipping bullish, and RSI is climbing out of oversold territory — all signs point to growing bullish momentum.
Fundamentally, Alibaba benefits from China's economic rebound, possible regulatory relief, and ongoing share buybacks. With Chinese tech rotating back into favor, BABA could lead the rally.
So if you're still waiting for a signal - it's already here. The golden cross is done, price is flying above moving averages, and all that’s left is a clean breakout. Watch $122 — that’s the launchpad.

EURUSD – Bears Still in Control!EURUSD has been overall bearish, trading within a clear descending channel. After rejecting the 1.1950s, price broke structure and shifted momentum to the downside.
At the moment, price is retesting a strong structure zone that aligns with the upper red trendline of the channel. This area acts as a confluence resistance.
As long as EURUSD trades below this zone, the bears remain in control. I’ll be looking for short opportunities from here with the next bearish impulse in mind.
If this structure is broken upward, only then would the short-term bias start to shift. Until then, the path of least resistance remains down.
Do you think EURUSD will respect this resistance, or could we see a breakout to reverse the trend? 🤔
⚠️ Disclaimer: This is not financial advice. Always do your own research and manage risk properly.
📚 Stick to your trading plan regarding entries, risk, and management.
Good luck! 🍀
All Strategies Are Good; If Managed Properly!
~Richard Nasr.

#GOLD #NEW_forcast #XAUUSD#XAUUSD pulled back hitting the 3790 resistance but continues to respect the upward trend line and channel structure.

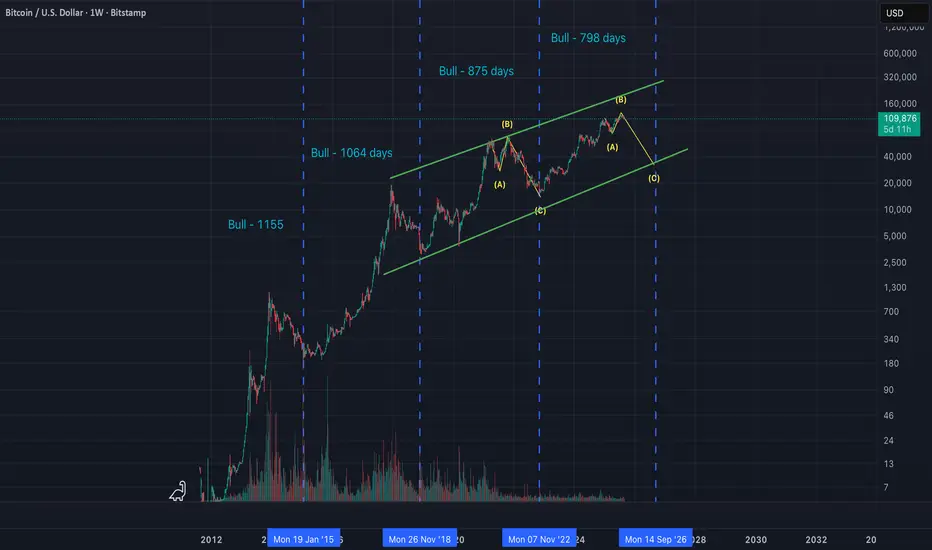
BTCUSDT- 250924 - LONG - Bitstamp - Cycle Top - 1WBTCUSDT- 250924 - LONG - Bitstamp - Cycle Top - 1W
Market Cycle Top: 134k
Look to take profits around 134k

VTI 1D: breakout on the daily within a long-term weekly uptrend On the daily chart, VTI (Vanguard Total Stock Market ETF) has broken through the key $303.5 resistance level with strong volume. This breakout occurs within a larger weekly uptrend channel, highlighting a continuation of the long-term bullish structure.
Volume profile shows a clear path ahead: $321.7 (1.272 Fibo) and $345 (1.618 Fibo). The golden cross (MA50 crossing MA200 from below) further supports the bullish case.
Fundamentally, VTI represents the entire U.S. equity market - large to small caps - and benefits from economic resilience, declining inflation, and passive inflows. It’s a logical macro play for trend continuation.
Tactical plan:
— Entry by market or after retest $303.5
— TP1: $321.7
— TP2: $345
— Invalidation below $300
The whole market breaking out? That’s not noise — it’s the signal.

I know its not what yall wanna hear but we have topped i thinktake a pic and remember u heard it here first. last crash it went to the .786 is how im basing my target. simple yet powerful

I hate to say it, but BTC is done - !Cycle ended!I've plotted the time in which each bull cycle takes to complete. Each run is getting shorter, not longer.. So looking at the previous run, we can see that we saw an expanded ABC to correct - one more little peak at at ATNH but then down into the inevitable correction. I think exactly the same thing is playing out here. We've seen so much brevado, but almost no new liquidity - there may well be a rate cut or two coming in September but I feel it's already priced in. When Powell inferred there would be cuts a few weeks ago, the market jumped but then dumped. Buy the rumour, sell the news. So - I'm out, cashed in my chips. Off to buy a new car.