TOTAL market cap to hit all time high! 🚀 Why I believe TOTAL MARKET CAP is bottoming & gearing up for a run to new ATHs 🟢📈
After reviewing Elliott Wave counts + classical price action, the structure looks extremely constructive. Here’s why 👇
🔍 Key Reasons I'm Expecting a Major Rally:
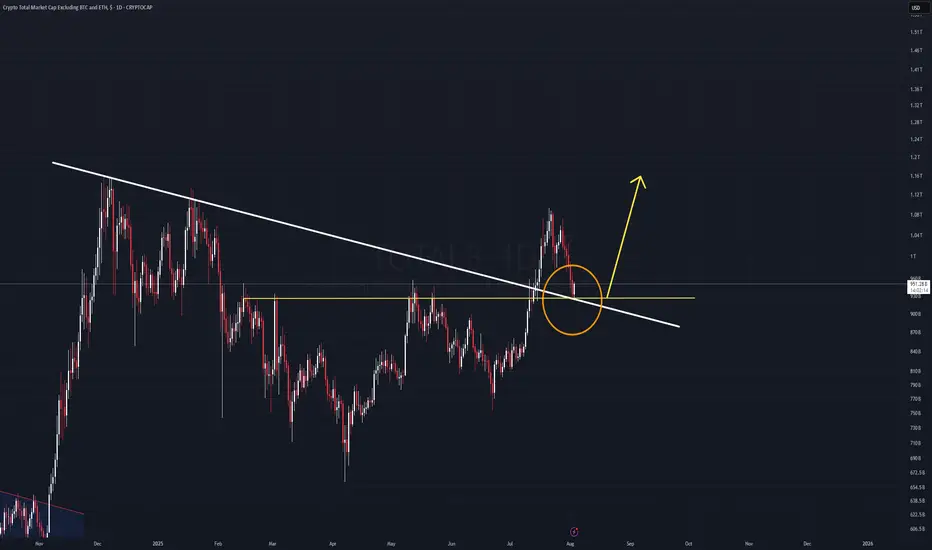
Wave 4 appears complete 🧩
Price just tapped the long-term trendline exactly where Wave 4 should typically end — shallow, corrective, and sentiment-driven.
Clean ABC correction ✔️
The drop has formed a textbook A-B-C zigzag, with Wave C terminating right on structural support.
Approaching major long-term trendline 📉➡️📈
Total market cap is retesting a multi-year ascending trendline that has held throughout the entire macro cycle.
A bounce here would be structurally consistent with the start of a Wave 5 rally.
Wave 5 structurally due ✨
Elliott Wave theory expects a strong, impulsive Wave 5 after a clean Wave 4 retracement. These are typically high-momentum rallies.
Bullish confluence across timeframes ⏳
Daily + weekly oversold metrics line up directly at major structural support.
🔥 If this read holds, TOTAL MARKET CAP could be preparing for a rally straight into new all-time highs.
Total

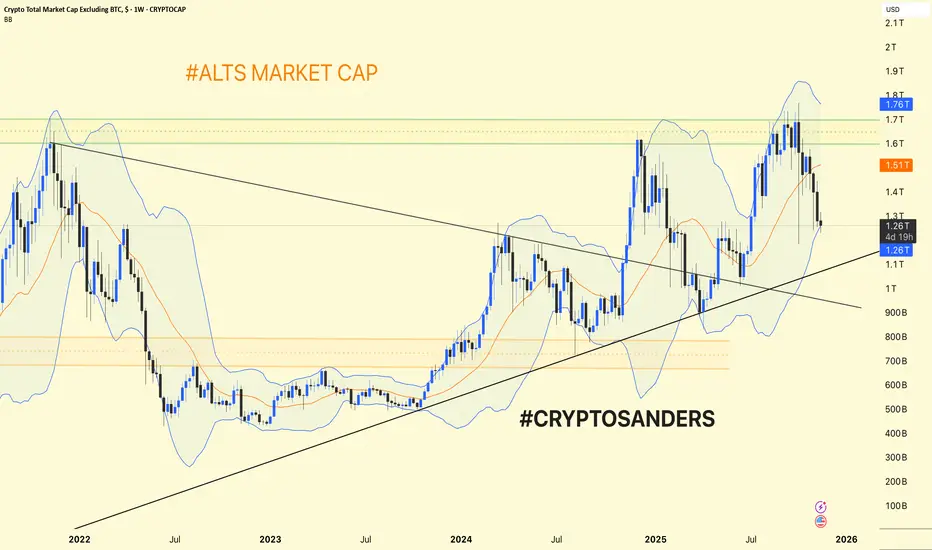
Alts Market Cap (#ALTS) Weekly Chart Update & Analysis. Alts Market Cap (#ALTS) Weekly Chart Update & Analysis
Trend Structure: The altcoin market cap (total crypto market cap excluding BTC) is trading within a broad uptrend channel after a major breakout in early 2024.
Support is currently found near $1.25T (recent swing low and channel support).
Resistance remains around $1.51T (orange line) and $1.76T (major horizontal/upper Bollinger Band zone).
Bollinger Bands: The chart uses weekly Bollinger Bands—price has pulled back from the upper band ($1.76T) and is now holding the midline ($1.26T) as short-term support.
A successful hold above $1.25T keeps the uptrend intact and sets the stage for a move back to $1.51–$1.76T.
A breakdown could lead to a deeper dip toward the long-term rising trendline (currently around $1T).
Alts are consolidating at higher lows inside an uptrend. Holding above the $1.25T area signals strength; a break above $1.51T confirms fresh upside momentum, while losing $1.25T would signal caution for further corrections.
DYOR | NFA
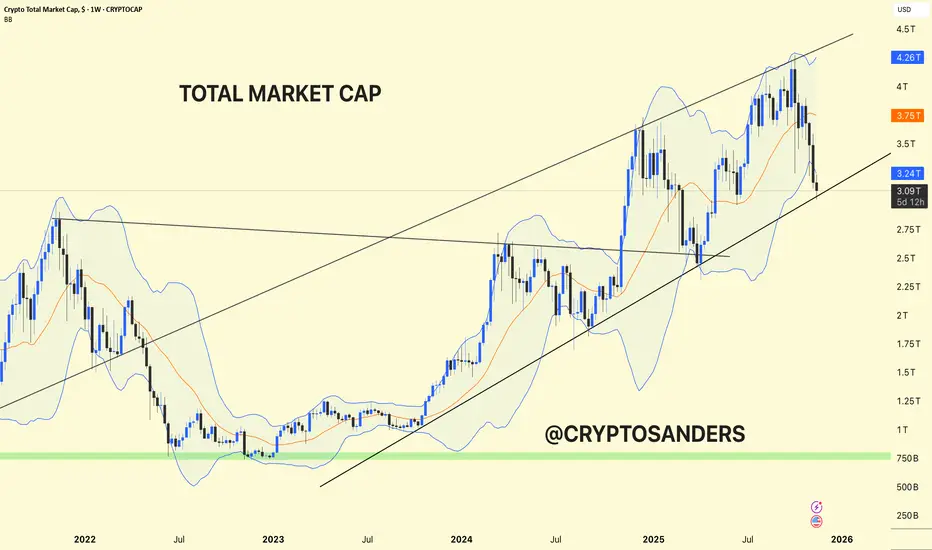
Crypto Total Market Cap. Crypto Total Market Cap – Weekly Chart Analysis & Full Update
The entire crypto market cap is trading within a large ascending channel, keeping the long-term uptrend intact.
Recent Action: After making new highs above $4 trillion, the market has corrected sharply, pulling back to the channel's lower support around $3 trillion USD. This area is a historic pivot and should act as strong support if bulls remain in control.
Upper channel resistance is near $4.4T.
Major horizontal support is well below, near $800B (green zone), but the current structure keeps the market safely above that.
A sustained break below the channel could lead to deeper retracement, while a bullish hold here sets up for another rally.
Holding this channel support can produce a recovery phase, targeting previous highs and new all-time highs.
Losing this support could trigger broader risk-off sentiment and test much lower ranges.
The crypto market is at a critical inflection—channel support is being tested after a steep correction. Staying above $3T maintains the bullish structure. Watch for a decisive bounce or breakdown in the coming weeks.
DYOR | NFA
Crypto Cycle: The Arrogance and The Irony — A Must ReadThe Cycle That Changed Everything
This cycle — which really started in October 2023 — broke every pattern from previous crypto bull runs.
Crypto was created as a rebellion:
Freedom from banks.
An anti-system technology.
Privacy.
Self-sovereignty.
A way for normal people to create wealth without permission.
And yet… somehow the exact people crypto was trying to escape have taken control of it.
Retail investors used to love the idea of owning their finances. No more banks telling them what to do. No more gatekeepers.
Until they arrived.
1 — The Arrogance
The rich run the world — that’s nothing new.
But crypto annoyed them. A lot.
Because crypto allowed ordinary people to do what Wall Street hates most:
Make money without giving the rich a cut.
So what did institutions do?
Simple:
“If you can’t kill it… own it.”
They stopped fighting crypto, took over the market, bought the exchanges, injected billions, partnered with the stablecoin printers, and unleashed industrial-scale manipulation.
The old days of making x10 or x100 on leverage?
Gone.
Retail got liquidated again… and again… and again.
Bitcoin pumped 3 times by billionaires (just look at the three green boxes on the chart).
Retail got excited — then destroyed.
Rinse and repeat.
Eventually, retail gave up.
They moved into gold, silver, or even plain USD — just to stop losing money.
Meanwhile institutions kept pumping Bitcoin and Ethereum artificially, hoping to lure back fresh meat…
but nobody came.
2 — The Irony
Then came October 11, 2025 — the day the curtain fell.
In a dry, illiquid market, Binance did their usual liquidation-hunting game, backed by newly-printed billions from Tether:
2 billion minted one day, 2 billion the next.
They pushed Bitcoin to $126,000.
Then the crash hit.
They chased longs so hard that, in a market with no liquidity, the entire altcoin market collapsed.
Some coins literally went to zero.
Binance had to halt trading.
The liquidation chain couldn’t be stopped.
Some market makers lost everything.
And now they’re furious.
Binance got exposed.
The pump-and-dump machine is broken.
And if they continue, they risk criminal investigations and lawsuits from every direction.
Suddenly BlackRock, Saylor, and friends had a problem:
Their favorite manipulation partner was knocked out.
And that’s when reality hit:
Institutions had pushed Bitcoin so high — without retail — that they found themselves holding billions in assets…
…with nobody left to buy their bags.
Old-time Bitcoin holders realized BTC was compromised and began to sell.
Bitcoin maxis rekt the institutions.
The billionaires who bought at $120k got destroyed by the exact people they planned to destroy.
Karma doesn’t miss.
Even Eric Trump started selling — too late.
Bitcoin fell under $89k, and there were no buyers left.
3 — The Lesson
Institutions need to understand one thing:
Crypto is not for institutions.
The tech? Sure.
The coins? No.
Crypto without retail is like a vampire trying to drink its own blood.
Pointless and self-destructive.
And retail won’t return for “fractional Trump coin” or corporate-approved BTC.
Retail wants:
x10, x100, x1000.
That means one thing:
ALTSEASON.
If institutions want liquidity to exit, they must engineer an altseason and share some profits.
Because without retail, they’re stuck in their expensive echo chamber holding overpriced bags that nobody wants.
And if they do create an altseason?
Retail will dump on them harder than ever — watching TradingView and influencers, selling every rally right back into the institutions’ faces.
Wall Street, stick to Wall Street.
Leave crypto to the crypto degenerates.
It’s a wild jungle, and you were never prepared.
#CryptoCycle #BitcoinCrash #AltseasonWhen #CryptoHumor #MarketManipulation #InstitutionsRekt #BinanceDrama #RetailVsWhales #CryptoReality #KarmaInCrypto #CryptoStory #PattayaCryptoDegens

Total Crypto Marketcap --- PLan Your Exit#TOTAL Crypto has already doubled from it's bear bottom, to it's most recent high.
We are almost in 2024, well into crypto summer now
time is really running out to prepare your portfolio for the inevitable Bull market euphoria phase.
I bring this chart up just to remind everyone, that this cycle has potential to be one of the worst in terms of multiple expansions we have seen so far.
We have gone from exploding 340X in one cycle.. to 33X the last cycle.
I expect this time round it will be a single digit multiplier.
We have to hope and pray we do indeed break the previous ATH , and we don't double top at 3 trillion.. of which there is no guarantee!
My realistic target is around 5 Trillion Dollars, which may sound pessimistic at only 3.5X from here ... but that means your Altcoins adding at least a Trillion dollars of value from here!
Optimistically i'm looking at around 7 trillion dollars, no mean feat!
BTC.d at 30% would equal BTC 2.1 Trillion or $110k per coin.

"Truth or Dare?"The parameter known as "Total" (All total market cap), shows a clear signal right now.
Before explain the techniacl details, I'll explain why should this move work:
Fundemental Details:
- FED has cut the interest rates for second time this year and most likely do it again before the year ends in December which is the most bullish macro signal for crypto to rise.
- US and China are trying to getting alone but behind the scenes the deal about tarrfis has already made long ago. They're just acting like they actually can carry on their political therats to each other to gain more political power. Trump is doing whatever he has done before when he got the crown. When all the nonsense ends, there won't be any problem left to think about tarrifs.
- US also threathens Venesuale but I don't think that matter will last long. Nevertheless, the matter still casuing heat on globe and that causes uncertinty.
- BOJ is another matter to keep in mind at the moment. The reason is, they announced that Japan may need to raise their interest rates in the next meeting which would be devastating for both crypto and all the markets on the globe. Crypto on the other hand, is facing this effect way sooner even before it happens, even if it won't happens. As you can guess, crypto markets are fragile. Every little tension means crises. That's one of the major reasons why it's actually losing value since last month.
- Let's get back to FED. Yes, FED is cutting the rates for the second time and expected to cut again in December despite the words from Powell BUT, we already knew that. Right?
As I mention about it on top, Crypto is fragile, but also very fast. When other markets are proccesing the reasons and possible outcomes of the news, crypto usually has already given the results of the possible news. Even if it's fake, unknown or unworthy to care about.
Crypto is fast. That's why it already gave every opportuinty to invest and now, the investor are taking profit from the very bullish news you just read.
"Sell the news" effect is just faster in crypto. Therefore, crypto has already gained the value it needed to gain. When you read the news or anything about crypto, remember one thing: it's already in the price. Bearish, or bullish. Won't matter.
Now let's get back to the part you like:
Technical details:
There are two possible senarios:
I'm not going to draw all the calculations on the chart so you won't confuse.
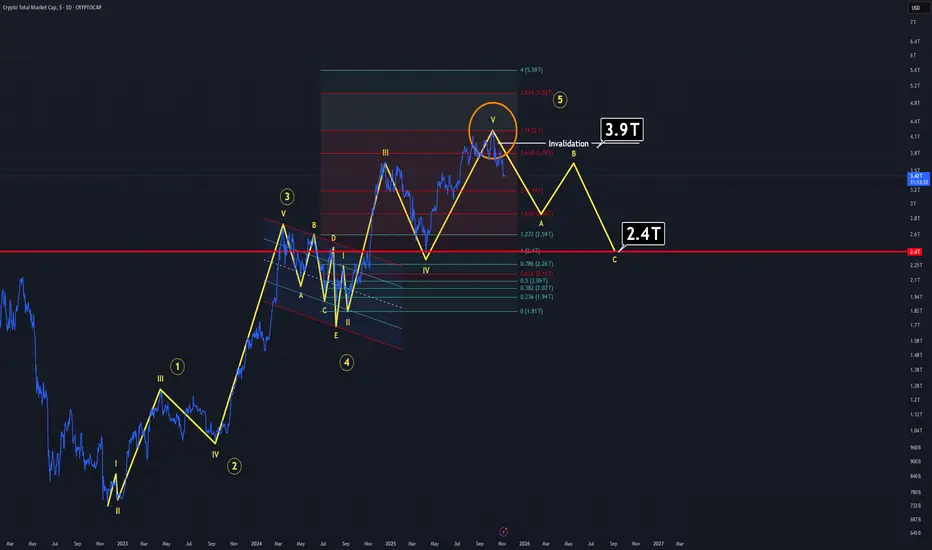
Senario one, The one you see in the main chart:
Total or Bitcoin, won't matter right now because they both going through same way.
At the moment, we might be witnessing an A-B-C corrective pattern on Total.
If you calculate enough, you'll reach the result that a perfect 5 waved uprising move has already happend and there is a possiblity that we might be in a corrective wave. Which, would result for TOTAL to drop at least 2.4 B levels. For Bitcoin, this level means it should drop down through around 80-85K.
Senario Two (Hopefully):
If the chart you see is a bear trap and the main bullish cycle is still on, it means we are at wave 4. Which means, Bitcoin still may dive under 100K but it won't last and we see even bigger all time highs in the coming month. Yes, in the coming month.
In order to this senario work, FED must give clear signals about rate cuts in December, resessiong must end immidiatly, US and China must behave well enough to lower tension around the globe.
If all the conditions met but price is still going side ways, it means get ready to see a "skyrocket candle".
Thanks for reading.
The Pink Elephant in Bitcoin That Everyone IgnoresYes, my friends. The game is over, and sadly, it seems like only I have to point this out to you because no one else is talking about it. Let's jump straight into the total liquidity in crypto.
As you can see, it's broken its weekly support. Look, I don't want to say our HWC—or weekly—trend has turned bearish, but I can tell you that if the daily candle closes like this, we're heading into corrections and a whole lot of pain.
Let's circle back to Bitcoin. Starting with the monthly candle
there are 26 days left, so we can't judge it fully yet, but right now, it's looking very bearish: small upper and lower shadows with a full, powerful bearish body. Combine that with the previous four indecisive candles... it's like we've got a car where all the seats are full except the driver's, and suddenly some random seller jumps behind the wheel. Okay, it's done—let's prepare for the drop. But this doesn't mean the HWC has changed ; we're still in an uptrend, and we'd need to break higher highs and lower lows to confirm that. But damn, of course we'll short in its secondary trend... why not?
Moving to the weekly timeframe
as you can see, each wave is proving weaker than the last: the first wave had 180% growth, the second 100%, and the latest one just 50%.
Now, on the daily
it's breaking that key 105k support. Around 100k, we've got another super important support level. If we lose that, the next ones are 98k and 95k. So, open your short positions on the break of 100k—keep in mind, the volatility around there will be intense.
For longs, we've got two scenarios.
1: A reaction at 101k, faking out the 104k break with a reversal pattern, then going long on the break of its resistance (which could be around 108k). Scenario 2: Going long after forming higher highs and lows on the 4H timeframe. Personally, I prefer to hold onto my long bias because, as I mentioned before , Bitcoin's uptrend legs have gone parabolic in this phase. That means if you don't jump in on the first leg, finding a stop loss on the later ones gets tough, you end up with lower R/R, plus a lower win rate—which leads to more losing streaks, more frustration, brewing the worst coffee of your life, and banging your head against everything else :)) So... that's it. Get outta here.

TOTAL 3 Analysis (1D)First of all, I'd suggest you to examine previous Total 2 analysis :
The idea is simple just like the previous analysis. There is a mitigated demand zone below the current price and it's not going to be helpfull if price wants to seek support for a new upwards momentum.
If the Total 3 market to go upwards, it will need to form a higher high, which is not going to be easy.
Currently, Total 3 is in wave C and as long as the green area that highlighted on the chart holds,
this parameter is more likely to drop.
Thanks for reading.

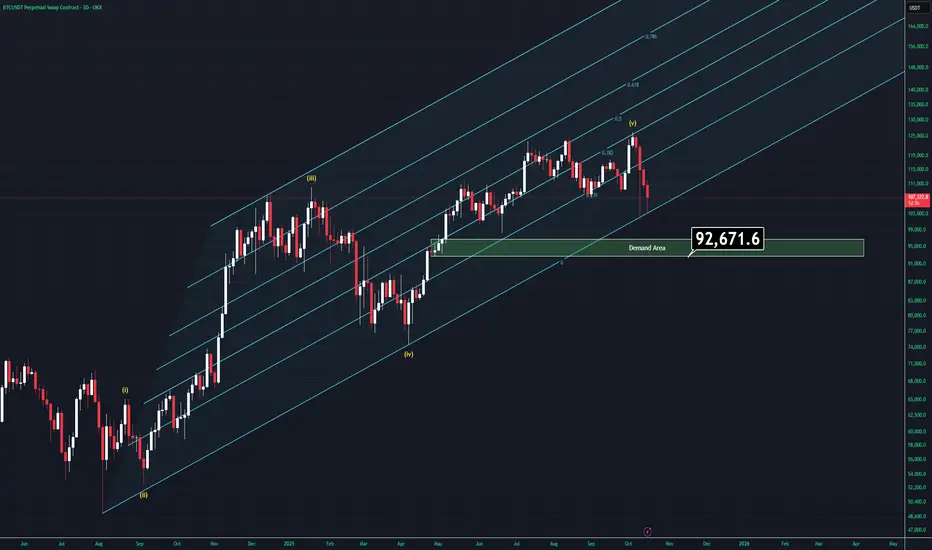
Moment of Fate - BTC Analysis (3D)There are many reasons to go up but also going down is starting to look way more charming than ever right now.
Let's examine what we have;
-FED is about to cut rates for a second time but we'll most likely to see another rate cut in december which is bullish af.
-All companies are keeping buying Bitcoin more and more which is kinda good but might be a problem for decentrlation of Bitcoin.
-US is more likely to bring more regulations about stablecoins which will effect positivly Bitcoin.
On the other hand;
-China and US are still faceing a trade war even if they state othervise.
-ETF's are not buying Bitcoin as much as they did last year.
-US and Venezuela might have a conflit very soon.
-Israel-Hamas and Russo-Ukraine wars hasn't actually over yet.
-Gold is going on god mode.
-DXY is trying to recover in weekly timeframe but is less likely due to rate cuts.
-Elliot wave theory tells us that we might actually be in the A-B-C correction cycle.
-Volume is decreasing, which is bad and supports the Elliot waves.
- Trendline support is about to be lost (Tried to break it twice in a week).
-There is a CME gap left around $92K
Well, all we have to do is, combining the factors.
If BTC breaks below the supportive trendline we will most likely drop through demand zone which is highlited in the chart. If US and China makes peace (less likely), Bitcoin actually has real reasons to try a new all time high.
The main point is simple: Wait for one of two things to happen:
Either the trendline will be broken and we'll see below the $100K, which will give us new opportuinites.
Or, Bitcoin recovers $118400 and the entire bearish senario would be invalidated and Bitcoin goes like crayz again.
Thank you for reading.
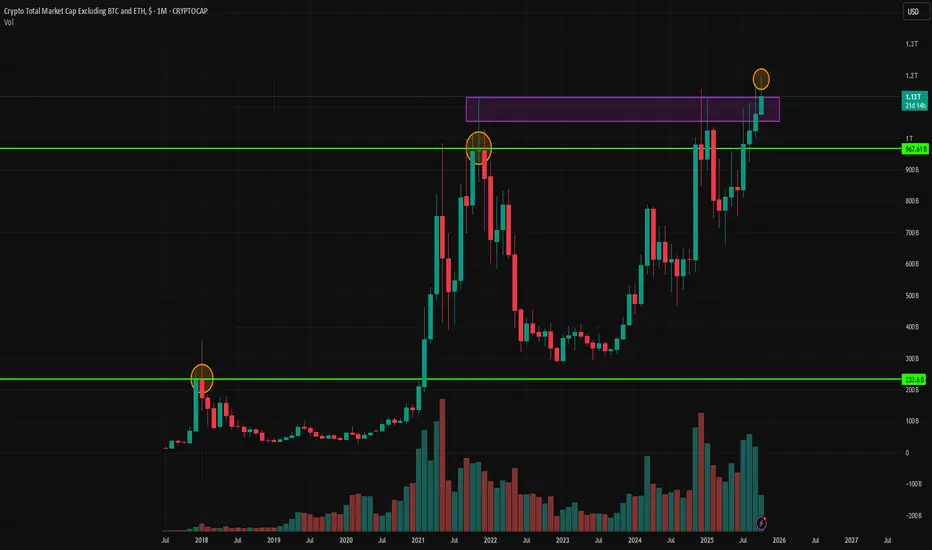
$OTHERS possible scenariosIt’s decision time for CRYPTOCAP:OTHERS , arguably the most accurate index to gauge the true altcoin market.
We’re now testing the $220 billion level, a critical support zone.
From here, two paths emerge:
either we bounce and start a meaningful trend reversal,
or we break down and revisit the wick from October 10, 2025.
Either way, altcoins may have to bleed a bit more before finding stability.
A massive head-and-shoulders pattern is clearly taking shape — and its theoretical target is near zero (no joke).
If this setup isn’t invalidated soon, we could be heading toward a major correction.
Let’s hope the $220B neckline holds strong.
If it fails, we might be watching the crypto equivalent of the dot-com crash — a potential black swan in the making.
Interestingly, the previous cycle also formed a similar head-and-shoulders pattern pointing to zero.
In reality, the downtrend bottomed out around $82 billion, not zero — so let’s hope history rhymes rather than repeats.
This time, the bad scenario suggests a bottom near $160 billion, which could mark the final stage of the altcoin bear market.
DYOR
#Altcoins #CryptoMarket #OTHERS #CryptoAnalysis #Bitcoin #Ethereum #CryptoCrash #HeadAndShoulders #MarketAnalysis #CryptoTrading #AltcoinSeason #TechnicalAnalysis #CryptoInvesting #BearMarket #CryptoNews #BTC #ETH #CryptoCycles #TradingView #MarketUpdate

$TOTAL Crypto Market Cap Fights Back w/ Weekly CloseCrypto CRYPTOCAP:TOTAL Market Cap looking similar to CRYPTOCAP:BTC
Thankfully did not close outside of the Danger Zone.
It's absolutely imperative that Bulls reclaim the 20WMA this week and close above the .236 Fib
Losing the 20WMA has signaled more downside / sideways chop historically.
Hopefully this is just a fake-out, otherwise the 50% Gann will be retested alongside the 50WMA.

TOTAL 3 Analysis (1D)The TOTAL3 chart is currently retesting a key diagonal trendline that was broken previously. This is a classic bullish retest scenario.
If the current daily candle closes green, and is followed by a strong impulsive candle without invalidation, it could signal the start of a new leg upward, right from this zone.
The $900B market cap level remains the key support.
As long as TOTAL3 holds above this threshold, the bullish bias remains intact.
This structure could lead to momentum across the altcoin market.
Total , still early As you see we are still playing on ATH on total chart which is only up because of bitcoin , they cycle either not started or it’s dead otherwise it should start to climb soon .

BTC Cycle Review: know when to hold 'em & when to fold 'emReviewing the time around the halving that produces profitable trending signals.
From the chart 1 yr and 2 months before the halving and 1 year 5 months after the halving produces profitable signals
consider pre halving to be spring
consider post halving to be summer
consider the red X between the two to be winter and unprofitable to take signals.
Posting this up as reference into the next cycle. interested to see how this plays out.

TOTAL REALTIME — Where Are We on the Mountain?🌐 TOTAL REALTIME — Where Are We on the Mountain?
The total crypto market cap now stands around $3.7 trillion.
The question is simple but vital:
Are we still at the base, in the mid-body, or already near the summit of this bull mountain?
Let’s decode it through structure and flow.
🧭 1. Wave Alignment (M & W Overlap)
Both Monthly and Weekly waves started together —
October 1st, 2023 → October 16th, 2025.
That means the market’s capital cycle has now run a full 2-year wave — money has circulated through accumulation, expansion, and distribution zones.
💹 2. From Base to Peak
Wave Base: $1.06T
Current Peak: $4.25T
→ Total market cap expanded by +3.19 trillion USD,
a 3× growth from the starting foundation.
⏳ 3. The Journey of the Weekly Waves
Wave 1 (Oct 1, 2023): Started from $1.06T → Peaked at $2.73T → Weekly correction.
Wave 2 (Sept 16, 2024): New leg from $1.9T → Peaked at $3.76T → Weekly correction.
Wave 3 (Apr 28, 2025): New base near $2.5T → Peaked at $4.25T → Now slowly cooling off.
At this stage, TOTAL is sitting right at the ATH zone of both Weekly and Monthly structures — a confluence that often precedes a shift in momentum.
🔍 4. What the Data Says
Time perspective: TOTAL is sitting in the plateau zone — the flat highlands of the Monthly peak.
System signal: The data framework now signals a confirmed top on Monthly.
Prepare for the slope phase — where global crypto liquidity begins to descend gradually.
🧠 Summary
After 2 years of vertical expansion and +3.19T inflow,
TOTAL REALTIME has reached the highlands of its macro mountain.
We’re no longer climbing — we’re walking the ridge before the slope begins.
Strategy shifts here: protect profits, manage exposure, and wait for the next base to form.

BIGGEST Crypto Liquidation TO DATE - Market CorrectsToday and yesterday over the past few hours, $19 billion dollars was wiped out in crypto. This is historic. And also a lesson in risk management, an eerie reminder of how risky speculation can be.
The market was over leveraged , and this is the result.
How can we monitor/ safeguard against this going ahead and be prepared for such an event in the future?
1) Always use a stop loss
2) Watch Bid/Ask spread and volatility
3) Use proper risk management
On the 10th of October, POTUS Donald Trump Tweeted about a new set of trade measures that include 100% tariff on certain Chinese exports, and new stricter export controls. The market immediately reacted; stocks and commodities dropped and crypto fell into chaos. What made this worse is that several exchanges were down, resulting in investors being unable to close or update their positions.
It seems like a fitting "reason" and also not, oddly. What we need to note here, is that the market was over leveraged. This is a self-correcting event that presents truer market reflections and better prices for investors - a blessing for those who were not affected/invested.
As an extra measure if you trade S&P500, you could watch the VIX - and set an indicator to any daily change greater than 15%-20%. This way, you'll be notified if there's action in the stock market.
You can also take a look at this idea on Risk vs Reward:
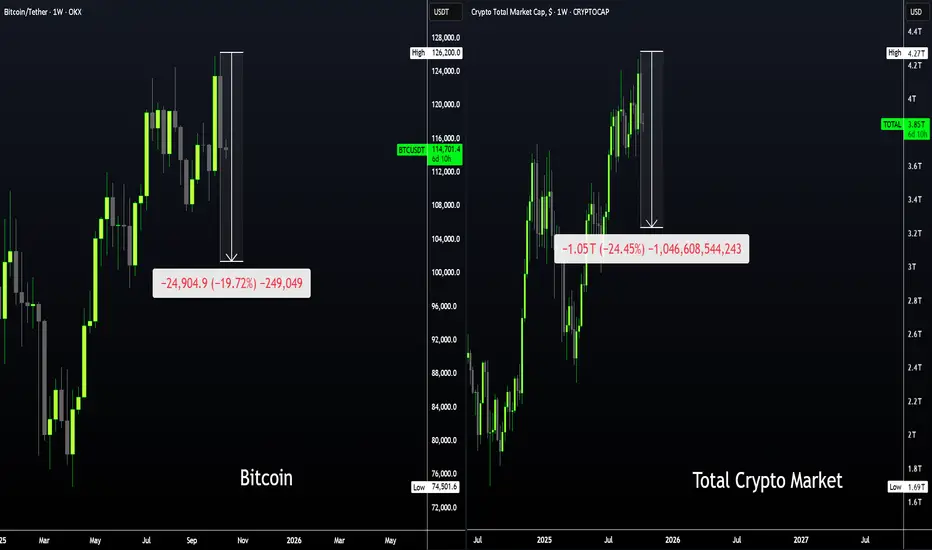
$TOTAL Crypto Market Cap Incredible Weekly Close!The Crypto CRYPTOCAP:TOTAL Market Cap showed incredible resilience after nuking ~25% this week.
Closed the Week just below the WEMA9 at $3.86T, but above the .236 Fib and stayed cleared of the DANGER ZONE ⚠️
Notice that wick all the way down to the 50WMA where it bounced literally right off the trendline breakout I drew back in July.
Those MMs are really respecting my TA these days huh 🤓
This dump covered the 50% Gann level retrace, which give me confluence that the hardest part of behind us.
Bears weren't even able to form a Bearish Engulfing candle.
Next up Bulls need to reclaim the 9WEMA as mentioned in the previous post.

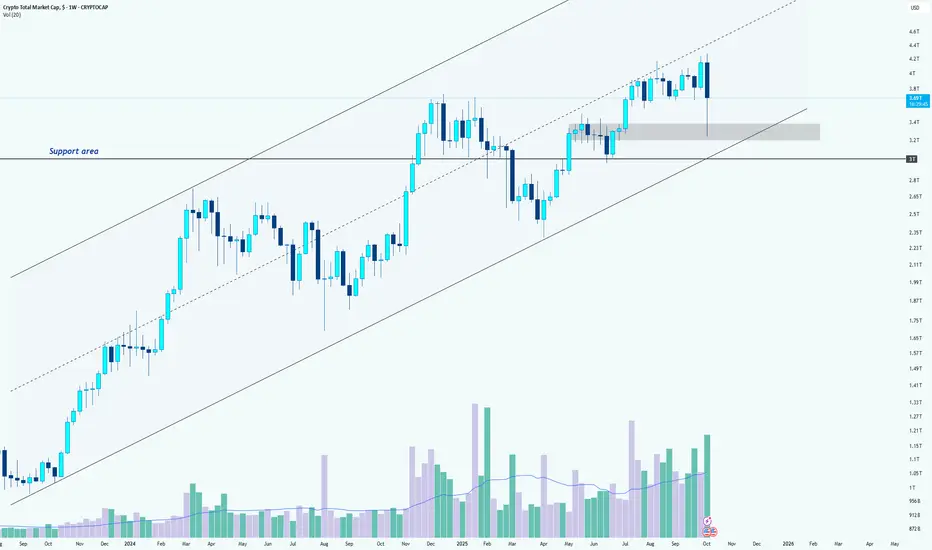
Crypto Total Market Cap AnalysisHi Team!
The crypto market continues to show impressive strength, maintaining its position inside the long-term ascending channel. Despite the recent correction, the overall structure remains bullish as long as the lower boundary of this channel holds.
After facing resistance near the upper line of the channel, the total market cap experienced a healthy pullback, which brought it close to the mid-zone of the structure. Buyers stepped in strongly from that area, suggesting that market participants still see dips as opportunities rather than warning signs.
The key support zone lies between 3.1T and 2.84T USD, a region that has acted as both a breakout base and a demand area in the past. As long as this zone remains intact, the broader bullish momentum is likely to continue, keeping the medium- to long-term outlook positive.
If price action stays within the rising channel and the 2.84T support area holds, the total crypto market cap could soon retest the upper trendline, potentially pushing toward new highs.
However, a confirmed breakdown below 2.84T would signal a shift in structure, opening the door to a deeper correction phase.
$TOTAL Market cap looking bullish The Cup & Handle formation breakout in November 2024 initiated an upward wave following a successful retest in April 2025.
In July, the demand zone at the November 2024 ATH level broke upward and is currently being retested.
At the same time, the SMA20, which broke in November 2023, is still strongly defended, confirming the structural strength of the market.
After the retest, a transition to a new parabolic phase for the market will become inevitable.
Bitcoin \ Ethereum \ Altcoins

TOTAL3 · Breakout or Fakeout · Where’s the Money Going Next?Everyone keeps saying “altseason is here,” but when you actually look at CRYPTOCAP:TOTAL3 , it doesn’t feel like that at all.
Back in 2018, CRYPTOCAP:TOTAL3 - the total market cap excluding Bitcoin and Ethereum, is in price discovery with no resistance above.
But let’s be real, this breakout feels different this time. Volume isn’t surging like it did in 2021, and the candles show hesitation. That means capital is flowing, but it’s not flowing aggressively. Smart money’s rotating, not chasing.
Altcoins as a whole aren’t exploding too, only a few names like CRYPTOCAP:BNB or BINANCE:SOLUSDT ecosystem tokens are showing strength. The rest are flat or fading.
Meanwhile, CRYPTOCAP:TOTAL TOTAL1, the full crypto market cap, keeps pushing higher, driven mainly by Bitcoin. It measn most of the new liquidity is still being absorbed by BTC rather than spreading across the broader altcoin market.
If TOTAL3 holds above $1.14T for a few more weeks, it’ll confirm the breakout and probably push toward $1.5T in Q4, but trust me "NO MORE ALTCOIN SEASON"
So yeah, we got the breakout everyone wanted, but not the fireworks yet.
Best,
The Crypto Fire
TOTAL 3 UPDATE !!The TOTAL3 chart is showing some cautionary signs but has not yet broken the key trendline. The price is testing this support level, and a breakout below the trendline will be crucial for determining the next move. Currently, the price is holding above the trendline, but if we see a close below this level, it would signal further weakness in the altcoin market.
Key Levels to Watch:
> The trendline is still intact, but a 4-hour candle close below this could trigger downside pressure.
> The first major support sits around $1.09T. If the price reaches this level and reacts positively, we could see a bounce.
> The next potential support zone is at $1.07T, where more significant buying might come into play.
For now, we remain cautious and need confirmation through price action for any further moves down.
#Altcoins #CryptoTrading

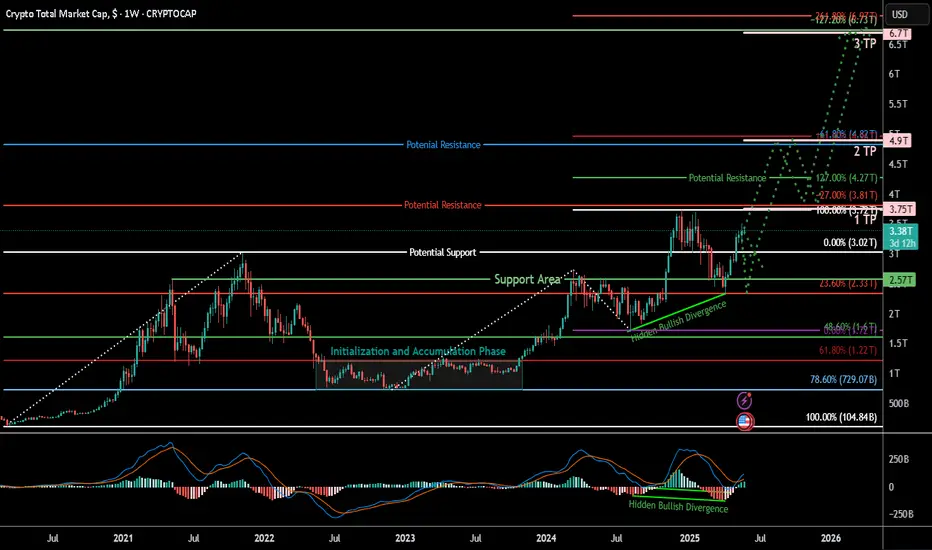
TOTAL Crypto Market Cap: Structural Breakout Aligns with Macros## 📊 TOTAL – Crypto Market Cap Ready for Expansion Phase?
---
### 🧵 **Summary**
The crypto market is showing signs of strong macro strength, with TOTAL reclaiming major support levels and forming a structurally bullish setup. Our multi-Fibonacci confluences and hidden bullish divergence point toward the possibility of a sustained breakout and new expansion leg toward \$4.9T and beyond.
This bullish view is further supported by powerful macro fundamentals expected over the next 8–10 months, including:
* Central bank rate cuts and liquidity expansion
* U.S. and EU regulatory clarity (stablecoins, ETFs, MiCA)
* Strong institutional adoption and geopolitical shifts
* Ethereum scaling upgrades and Bitcoin halving cycle effects
Together, these narratives form a compelling foundation for a broad-based market cap expansion.
---
### 📈 **Chart Context**
This is a **weekly chart of the TOTAL crypto market cap**, providing a bird’s-eye view of market cycles, macro structure, and capital flow across the entire ecosystem.
---
### 🧠 **Key Technical Observations**
* **Reclaim of \$3.02T level** (key support/fib level) signals macro bullish momentum.
* Market is forming **higher lows and bullish continuation structures**.
* **Support zones:** \$3.02T (reclaimed), \$2.57T (key pivot),
* **Resistance/TP zones:**
* **TP1 – \$3.75T** (100% trend-based fib + -27% retracement expansion)
* **TP2 – \$4.9T** (161.8% trend-based fib + -61.8% retracement expansion)
* **TP3 – \$6.9T** (261.8% fib extension target)
---
### 🧶 **Fibonacci Confluences and TP Logic**
We’ve employed both **standard Fibonacci retracement** and **trend-based extension** tools to build our target structure. The **1TP and 2TP zones** are defined by confluences between:
* **Retracement expansion levels** of **-27% and -61.8%**
* **Trend-based extension levels** of **100% and 161.8%**
If price reaches 2TP (~~\$4.9T) and **retraces toward the parallel legs** (100%–127%), this would confirm structural symmetry and open the door for a final push toward \*\*TP3 (~~\$6.9T)\*\* — the 261.8% extension.
---
### 🔍 **Indicators**
* **MACD Crossover** and rising histogram bars
* **Hidden Bullish Divergence** between MACD and price – a classic continuation signal
* Weekly trendline breakout from accumulation zone
---
### 🧠 **Fundamental Context**
While not directly charted, key macro catalysts like ETF approvals, global liquidity cycles, monetary easing, and increasing institutional interest will likely play a role in the next phase of expansion. This chart captures the structural readiness for that narrative.
## 📊 Fundamental Context (Extended Outlook: Mid-2025 to Early 2026)
Below is a detailed breakdown of upcoming macroeconomic, geopolitical, and crypto-specific developments sourced from:
* Bitwise Asset Management
* Fidelity Digital Assets
* ARK Invest
* CoinDesk, Reuters, Axios, WSJ
* CapitalWars, Cointelegraph, Coinpedia
* European Commission (MiCA regulations)
* U.S. Congressional records and SEC announcements
These events are chronologically aligned to support a structured macro bullish thesis for TOTAL market cap.
Bullish Crypto Catalysts (June 2025 – Feb 2026)
Summer 2025 (Jun–Aug): Monetary Easing and Regulatory Breakthroughs
Central Bank Policy Pivot: By mid-2025, major central banks are shifting toward easier policy. Market expectations indicate the U.S. Federal Reserve will stop tightening and begin cutting interest rates in 2025, with forecasts of up to three rate cuts by end-2025
bitwiseinvestments.eu
. Declining inflation and rising unemployment are pushing the Fed in this direction
bitwiseinvestments.eu
bitwiseinvestments.eu
. Easier monetary policy increases global liquidity and risk appetite, historically providing a tailwind for Bitcoin and crypto prices
bitwiseinvestments.eu
. In fact, global money supply is near record highs, a condition that in past cycles preceded major Bitcoin rallies
bitwiseinvestments.eu
. Should economic volatility worsen, the Fed has even signaled readiness to deploy fresh stimulus, which would inject more liquidity – “another tailwind for Bitcoin price growth”
nasdaq.com
.
Liquidity and Inflation Trends: With inflation trending down from earlier peaks, central banks like the Fed and European Central Bank are under less pressure to tighten. This opens the door for potential liquidity injections or QE if growth falters. Analysts note a strong correlation (often >84%) between expanding global M2 money supply and Bitcoin’s price rise
nasdaq.com
. There is typically a ~2-month lag for liquidity increases to flow into speculative assets like crypto
nasdaq.com
nasdaq.com
. The monetary easing expected in mid-2025 could therefore boost crypto markets by late summer, as new liquidity finds its way into higher-yielding investments. One projection even models Bitcoin retesting all-time highs (~$108K by June 2025) if global liquidity continues upward
nasdaq.com
– underscoring how “accelerated expansion of global liquidity” often aligns with crypto bull runs
nasdaq.com
.
U.S. Stablecoin Legislation: A landmark regulatory catalyst is anticipated in summer 2025: the first comprehensive U.S. crypto law, focused on stablecoins. The Senate has advanced the Guiding and Establishing National Innovation for U.S. Stablecoins (GENIUS) Act to a final vote
coindesk.com
. Passage of this bill (expected by mid-2025) would create a federal framework for stablecoin issuers, resolving a major regulatory gray area
coindesk.com
. Analysts call this “one of the most important regulatory developments in the history of crypto” – potentially even bigger than the approval of spot Bitcoin ETFs in impact
coindesk.com
. By enforcing prudential standards on stablecoin reserves and permitting licensed issuance, the law would legitimize stablecoins as a core part of the financial system. Bitwise predicts that clear rules could trigger a “multi-year crypto bull market,” with stablecoin market cap exploding from ~$245B to $2.5 trillion as mainstream adoption accelerates
coindesk.com
coindesk.com
. A U.S. law would also likely set a global precedent, encouraging other regions to integrate crypto-dollar tokens into commerce. Bottom line: expected stablecoin regulation in summer 2025 is a bullish game-changer, improving market integrity and unlocking new liquidity for crypto markets
coindesk.com
.
Regulatory Clarity in Europe: Meanwhile, Europe’s comprehensive MiCA regulations have fully taken effect as of late 2024, so by summer 2025 the EU has a unified crypto framework. This gives legal clarity to issuers, exchanges, and custodians across the 27-nation bloc
pymnts.com
skadden.com
. The harmonized rules (covering everything from stablecoin reserves to exchange licensing) are expected to expand Europe’s crypto market size by 15–20% in the coming years
dailyhodl.com
. With MiCA in force, firms can confidently launch crypto products EU-wide, and institutional investors have more protection. U.K. regulators are on a similar path – e.g. recognizing stablecoins as payment instruments – further globalizing the pro-crypto regulatory trend. By mid-2025, this regulatory thaw in major economies is improving investor sentiment. Goldman Sachs recently noted that 91% of crypto firms are gearing up for MiCA compliance – a sign that industry is preparing to scale under clearer rules
merklescience.com
merklescience.com
. Overall, the summer of 2025 marks a turning point: governments are embracing sensible crypto rules (rather than harsh crackdowns), reducing uncertainty and inviting institutional capital off the sidelines.
Initial ETF Impact: The first wave of U.S. spot crypto ETFs – approved in late 2023 and January 2024 – will have been trading for over a year by mid-2025
investopedia.com
. Their success is already far exceeding expectations: BlackRock’s iShares Bitcoin Trust amassed a record $52 billion AUM in its first year (the biggest ETF launch in history)
coindesk.com
, and other Bitcoin funds from Fidelity, ARK, and Bitwise quickly joined the top 20 U.S. ETF launches of all time
coindesk.com
. These products have unleashed pent-up retail and institutional demand by offering a regulated, convenient vehicle for crypto exposure
coindesk.com
. By summer 2025, ETF inflows are still robust, and many Wall Street analysts expect a second wave of approvals. Indeed, 2025 is being called “the Year of Crypto ETFs”
coindesk.com
. Observers predict dozens of new funds – including spot Ether, Solana, and XRP ETFs – could win approval under revamped SEC leadership in the post-2024 election environment
coindesk.com
. If so, late 2025 could see a broad menu of crypto ETF offerings, widening investor access to the asset class. This steady drumbeat of ETF launches and inflows adds a structural source of buy-pressure under crypto markets throughout 2025. (Notably, Bloomberg data showed over $1.7B poured into spot crypto ETFs in just the first week of 2025, on top of 2024’s flows
etf.com
.) In short, the ETF effect – “shocking the industry to its core” in year one
coindesk.com
– is set to grow even stronger in 2025, channeling more traditional capital into crypto.
U.S. Political Shift (Post-Election): The outcome of the Nov 2024 U.S. elections is a crucial backdrop by mid-2025. A new administration under President Donald Trump took office in January 2025 and immediately signaled a markedly pro-crypto policy stance. Within his first 100 days, Trump’s appointments to key financial agencies (SEC, CFTC, OCC) effectuated a “180° pivot” in crypto regulation from the prior administration
cnbc.com
. Industry observers describe a sharp policy reversal – where previously the sector faced hostility, now it’s courted as an engine of innovation. President Trump has publicly vowed to be “the first crypto-president,” hosting crypto industry leaders at the White House and promising to boost digital asset adoption
reuters.com
. He even floated creating a strategic Bitcoin reserve for the United States
reuters.com
– a striking show of support for Bitcoin’s role as a reserve asset (though it remains to be seen if this materializes). More tangibly, regulatory agencies have begun rolling back onerous rules. For example, the SEC under new leadership scrapped a prior accounting guideline that made bank crypto custody prohibitively expensive
reuters.com
. And the Office of the Comptroller of the Currency (OCC) has “paved the way” for banks to engage in crypto activities like custody and stablecoin issuance
reuters.com
. These changes in Washington brighten the outlook for crypto markets: with regulatory uncertainty fading, U.S. institutions feel more confident to participate. In essence, by mid-2025 the world’s largest capital market (the U.S.) is shifting from impeding crypto to embracing it, a narrative change that cannot be overstated in its bullish significance
coindesk.com
reuters.com
.
Geopolitical Easing and BRICS Actions: Global macro conditions in summer 2025 may also improve due to geopolitical developments. If major conflicts (like the Russia-Ukraine war) de-escalate or move toward resolution by late 2024 or 2025, it would remove a key source of risk-off sentiment. Lower geopolitical risk and easing of war-driven commodity shocks would help cool inflation (especially energy prices) and bolster global growth – factors that support risk asset rallies (crypto included). On another front, the BRICS nations (Brazil, Russia, India, China, South Africa + new members) are continuing their de-dollarization agenda in 2025. At the BRICS summit in October 2024, they discussed creating a new gold-backed reserve currency (“the Unit”) as an alternative to the U.S. dollar
investingnews.com
. They also announced a BRICS blockchain-based payment network (“BRICS Bridge”) to connect their financial systems via CBDCs, bypassing Western networks
investingnews.com
. Going into 2025, these initiatives are expected to progress (with Russia currently chairing BRICS). While a full-fledged BRICS currency may be years away (and faces hurdles
moderndiplomacy.eu
), the bloc’s move to settle more trade in non-USD currencies is already underway (by 2023, roughly 20% of oil trades were in other currencies)
investingnews.com
. Implication: A shift toward a more multi-polar currency world could weaken U.S. dollar dominance over time
investingnews.com
. For crypto, this trend is intriguing – as nations seek dollar alternatives, Bitcoin’s appeal as a neutral, supranational asset may rise. In sanctioned or economically volatile countries, both elites and the public might accelerate adoption of crypto for cross-border value storage. For example, U.S. sanctions on Russia and China have already catalyzed talk of reserve diversification
investingnews.com
. Fidelity analysts note that “rising inflation, currency debasement and fiscal deficits” globally are making Bitcoin strategically attractive for even nation-states and central banks
coindesk.com
coindesk.com
. Summing up: a backdrop of improving geopolitical stability (if realized) plus a weakening dollar regime provides a bullish macro and narrative case for borderless cryptocurrencies as we enter the second half of 2025.
Fall 2025 (Sep–Nov): Institutional Inflows, Adoption & Tech Upgrades
Surging Institutional Adoption: By autumn 2025, the cumulative effect of regulatory clarity and market maturation is a wave of institutional adoption unlike any prior cycle. In traditional finance, major U.S. banks and brokers are cautiously but steadily entering the crypto arena. Reuters reports that Wall Street banks are now receiving “green lights” from regulators to expand into crypto services, after years of hesitance
reuters.com
reuters.com
. Many top banks have been internally testing crypto trading and custody via pilot programs
reuters.com
. As one example, Charles Schwab’s CEO said in May 2025 that regulator signals are “flashing pretty green” for large firms, and confirmed Schwab plans to offer spot crypto trading to clients within a year
reuters.com
. Banks like BNY Mellon, State Street, and Citigroup – which collectively manage trillions – are expected to roll out crypto custody solutions by 2025, often via partnerships with crypto-native custodians
dlnews.com
. The OCC has explicitly authorized banks to handle crypto custody and stablecoins (under proper safeguards), removing a key barrier
reuters.com
. And the SEC’s friendlier stance under new leadership means banks no longer face punitive capital charges for holding digital assets
reuters.com
. The net effect is that by late 2025, institutional-grade crypto infrastructure is falling into place. More pension funds, endowments, and asset managers can allocate to crypto through familiar channels (regulated custodians, ETFs, prime brokers). Even conservative banking giants are warming up: Bank of America’s CEO stated the bank “will embrace cryptocurrencies for payments if regulations permit” and hinted at possibly launching a BOA stablecoin for settlement
reuters.com
. Likewise, Fidelity and BlackRock’s crypto units are expanding offerings after seeing outsized demand. This institutional legitimization dramatically expands the pool of potential investors in crypto markets, supporting a higher total market capitalization.
Crypto ETF Expansion: In Q4 2025, the roster of crypto-based ETFs and funds is likely to broaden further. As noted, analysts foresee 50+ crypto ETFs by end of 2025 under the pro-industry U.S. regulatory regime
coindesk.com
. By fall, we may see Ethereum spot ETFs (building on the successful Bitcoin products) and even funds for large-cap altcoins. For instance, Nate Geraci of The ETF Store predicts spot Solana and XRP ETFs are on the horizon in the U.S.
coindesk.com
. Internationally, Canada and Europe already have multiple crypto ETPs – their continued growth adds to global inflows. With a year of performance history by late ’25, crypto ETFs will likely start seeing allocations from more conservative institutions (insurance firms, corporate treasuries, etc.) that needed to observe initially. Fidelity’s strategists noted that in 2024 much of the ETF buying came from retail and independent advisors, but 2025 could bring uptake from hedge funds, RIAs, and pensions as comfort grows
coindesk.com
coindesk.com
. In summary, fall 2025 should witness accelerating capital inflows via investment vehicles, as crypto solidifies its place in mainstream portfolios. This sustained demand – “2025’s flows will easily surpass 2024’s” according to one strategist
coindesk.com
– provides a steady bid under crypto asset prices, reinforcing a bullish trend.
Nation-State and Sovereign Adoption: A notable development to watch in late 2025 is the entry of nation-states and public institutions into Bitcoin. Fidelity Digital Assets published a report calling 2025 a potential “game changer in terms of bitcoin adoption”, predicting that more nation-states, central banks, sovereign wealth funds, and treasuries will buy BTC as a strategic reserve asset
coindesk.com
. The rationale is that with rising inflation and heavy debt loads, governments face currency debasement and financial instability, making Bitcoin an attractive hedge
coindesk.com
. By Q4 2025, we could see early signs of this trend. For example, there are rumors that Russia and Brazil have explored holding Bitcoin reserves
fortune.com
, and Middle Eastern sovereign funds flush with petrodollars might quietly accumulate crypto as diversification. In the U.S., President Trump and crypto-friendly lawmakers like Senator Cynthia Lummis have openly discussed establishing a U.S. Bitcoin reserve or adding BTC to Treasury holdings
coindesk.com
. Lummis even introduced a “Bitcoin Reserve” bill in 2024, which if enacted would set a precedent for national adoption
coindesk.com
. While such bold moves might not happen overnight, even small allocations by governments or central banks would be symbolically massive. It would validate crypto’s role as “digital gold” and potentially ignite FOMO among other nations (a game theory dynamic Fidelity’s report alludes to). Thus by late 2025, any announcements of central banks buying Bitcoin or countries mining/holding crypto (similar to El Salvador’s earlier example) could spur a bullish frenzy. At minimum, the expectation of this “sovereign bid” provides a narrative supporting the market. As Fidelity’s analysts put it: not owning some Bitcoin may soon be seen as a greater risk for governments than owning it
coindesk.com
. Ethereum & Crypto Tech Upgrades: The latter part of 2025 is also packed with technological catalysts in the crypto sector, which can boost investor optimism. Chief among these is Ethereum’s roadmap milestones. Ethereum core developers plan to deliver major scaling improvements by end-2025 as part of “The Surge” phase
bitrue.com
. This includes fully rolling out sharding – splitting the blockchain into parallel “shards” – combined with widespread Layer-2 rollups, aiming to increase throughput to 100,000+ transactions per second
bitrue.com
. If Ethereum achieves this by Q4 2025, it would vastly lower fees and increase capacity, enabling a new wave of decentralized application growth. For users, that means faster, cheaper transactions; for the market, it means Ethereum becomes more valuable as utilization can skyrocket without bottlenecks. Progress is well underway: an intermediate upgrade (EIP-4844 “proto-danksharding”) was implemented earlier to boost Layer-2 efficiency, and the next major upgrade (code-named Pectra) is slated for Q1 2025 focusing on validator improvements and blob data throughput
fidelitydigitalassets.com
. After that, the final sharding implementation is expected. By late 2025, Ethereum’s evolution – including MEV mitigation (The Scourge) and Verkle trees for lighter nodes (The Verge) – should make the network more scalable, secure, and decentralized
bitrue.com
. These upgrades are bullish for the ecosystem: a more scalable Ethereum can host more DeFi, NFT, and gaming activity, attracting capital and users from traditional tech. Investors may speculate on ETH demand rising with network activity. Beyond Ethereum, other protocols (Solana, Cardano, Layer-2s like Arbitrum, etc.) also have roadmap milestones during this period, potentially improving their value propositions. Overall, the tech backdrop in late 2025 is one of significant improvement, which supports a positive market outlook – the infrastructure will be ready for mainstream scale just as interest returns.
Bitcoin Halving Aftermath: Although the Bitcoin halving took place in April 2024, its bullish impact historically materializes with a lag of 12-18 months. That puts late 2025 into early 2026 right in the window when the post-halving cycle may reach a euphoric phase. By fall 2025, Bitcoin’s supply issuance will have been at half its prior rate for ~18 months, potentially leading to a supply-demand squeeze if demand surges. ARK Invest notes that previous halvings (2012, 2016, 2020) all coincided with the early stages of major bull markets
ark-invest.com
. Indeed, by Q4 2025 we may see this pattern repeating. ARK’s analysts observed in late 2024 that Bitcoin remained roughly on track with its four-year cycle and expressed “optimism about prospects for the next 6–12 months” following the April 2024 halving
ark-invest.com
. That optimism appears well-founded if macro conditions and adoption trends align as discussed. By November 2025, Bitcoin could be approaching or exceeding its previous all-time high ( ~$69K from 2021) – some crypto analysts foresee six-figure prices during this cycle. Importantly, a rising Bitcoin tide tends to lift the entire crypto market cap. Late 2025 could see a broad rally across altcoins, often referred to as “altseason,” as new retail and institutional money, emboldened by Bitcoin’s strength, diversifies into higher-beta crypto assets. The expectation of the halving-driven bull cycle can itself become a self-fulfilling sentiment booster: investors position ahead of it, providing additional buy pressure. In summary, fall 2025 is poised to be the crescendo of the Bitcoin halving cycle, with historical analogues (2013, 2017, 2021) suggesting a powerful uptrend in crypto prices. Reduced BTC supply + peak cycle FOMO + all the fundamental drivers (ETF flows, low rates, tech upgrades) make this timeframe particularly conducive to a bullish market cap expansion.
Winter 2025–26 (Dec–Feb): Peak Momentum and Continued Tailwinds
Bull Market Momentum: Entering winter 2025/26, the crypto market could be in full bull mode. If the above developments play out, total crypto market capitalization may be approaching new highs by late 2025, driven by strong fundamentals and investor FOMO. Historically, the final leg of crypto bull markets sees parabolic gains and surging liquidity inflows. We might witness that in Dec 2025 – Feb 2026: exuberant sentiment, mainstream media coverage of Bitcoin “breaking records,” and increased retail participation. Unlike the 2017 and 2021 peaks, however, this cycle has far greater institutional involvement, which could imply more sustainable capital inflows (and possibly a larger magnitude of inflows). Key macro factors are likely to remain supportive through early 2026: central banks that began easing in 2024-25 may continue to hold rates low or even consider renewed asset purchases if economies are soft. For instance, if a mild U.S. recession hits in late 2025, the Fed and peers could respond with quantitative easing or liquidity facilities, effectively “printing” money that often finds its way into asset markets, including crypto
nasdaq.com
. China’s PBoC could also inject stimulus to boost growth, adding to global liquidity. Such actions would prolong the “risk-on” environment into 2026, delaying any end to the crypto uptrend. Additionally, global equity markets are projected to be strong in this scenario (buoyed by low rates and easing geopolitical tensions), and crypto’s correlation with equities means a rising stock tide lifts crypto too – as was observed in May 2025 when stock rallies coincided with BTC and ETH jumps
blockchain.news
blockchain.news
.
Investor Sentiment and Retail Revival: By early 2026, investor sentiment toward crypto could be the most bullish since 2021. With clear regulatory frameworks, high-profile endorsements (even governments buying in), and tech narratives (Web3, AI+blockchain, etc.), the stage is set for a positive feedback loop. Retail investors who largely sat out during the harsh 2022–23 bear market may fully return, spurred by “fear of missing out” as they see Bitcoin and popular altcoins climbing. This broadening of participation (from hedge funds down to everyday investors globally) increases market breadth and can drive total market cap to climactic heights. Notably, the availability of user-friendly investment onramps – e.g. spot crypto ETFs through any brokerage, crypto offerings integrated in fintech apps and banks – makes it much easier for average investors to allocate to crypto in 2025-26 than in past cycles. The removal of friction means inflows can ramp up faster and larger. Social media and pop culture hype also tend to peak in late-stage bulls; we might see Bitcoin and Ethereum becoming water-cooler talk again, drawing in new demographics. All of this contributes to strong sentiment and capital inflows in winter 2025/26, reinforcing the bullish outlook.
Continued Policy and Geopolitical Tailwinds: The policy landscape is expected to remain a tailwind into 2026. In the U.S., if the pro-crypto Trump administration stays aligned with its promises, we could see additional positive actions: perhaps tax clarity for digital assets, streamlined ETF approvals for more crypto categories, or even federal guidelines for banks to hold crypto on balance sheets. Such steps would further normalize crypto within the financial system. Regulatory coordination internationally might also improve – for example, G20 nations in 2025 have been working on a global crypto reporting framework and stablecoin standards, which, once implemented, reduce the risk of harsh crackdowns in any major economy. On the geopolitical front, the BRICS de-dollarization efforts might bear first fruit by 2026, such as increased trade settled in yuan, gold, or even Bitcoin. If Saudi Arabia (a new BRICS invitee) starts pricing some oil in non-USD, that could weaken dollar liquidity at the margins, and some of that displaced value might flow to alternative stores like crypto or gold. Additionally, by 2026 the world will be looking ahead to the next U.S. Presidential election cycle (2028) – typically, in the lead-up, administrations prefer supportive economic conditions. This could mean fiscal stimulus or at least no new financial regulations that rock markets, implying a benign policy environment for risk assets. In Europe, 2026 will see MiCA fully operational and possibly updated with new provisions for DeFi and NFTs, further integrating the crypto market. In sum, early 2026 should carry forward many of 2025’s positive drivers – ample liquidity, regulatory support, and growing mainstream acceptance – giving little reason to suspect an abrupt end to the bullish trend during this window.
Bitcoin Halving Cycle Peak: If history rhymes, the crypto market might reach a cycle peak somewhere around late 2025 or early 2026. Past bull cycles (2013, 2017, 2021) peaked roughly 12-18 months after the halving; a similar timeframe would put a possible top in the Dec 2025 – Feb 2026 period. That could mean Bitcoin at unprecedented price levels and total crypto market cap in multi-trillions, barring any unforeseen shocks. ARK Invest’s analysis as of late 2024 remained optimistic that Bitcoin was “in sync with historical cycles” and poised for strong performance into 2025
ark-invest.com
. By early 2026, those cycle dynamics (diminished new supply vs. surging demand) might reach a crescendo. One metric to watch is the stock-to-flow or issuance rate – post-halving Bitcoin’s inflation rate is below 1%, lower than gold’s, which can drive the digital gold narrative to its zenith at this point. Moreover, Ethereum’s upcoming transition to a deflationary issuance (with EIP-1559 fee burns and Proof-of-Stake) means ETH could also be seeing declining supply into 2026, potentially amplifying its price if demand spikes. Thus, both of the top crypto assets would have increasing scarcity dynamics during the period when interest is highest – a recipe for a dramatic run-up. Importantly, capital rotations within crypto during peak phases often send smaller altcoins skyrocketing (as investors seek outsized gains), temporarily boosting total market cap beyond just Bitcoin’s contribution. All told, the early 2026 period could represent the euphoric apex of this cycle’s bull market, supported by solid macro and fundamental fuel laid in the preceding months. Even if volatility will be high, the overall outlook through February 2026 remains strongly bullish for crypto’s total market capitalization, given the confluence of loose monetary conditions, favorable policy shifts, geopolitical diversification into crypto, institutional FOMO, and major network upgrades powering the narrative.
✨ Philosophical Reflection
In the ever-unfolding rhythm of cycles—accumulation, expansion, distribution, and reset—crypto mirrors the deeper architecture of nature and consciousness. Just as seeds lie dormant in winter awaiting the kiss of spring, so too does capital bide its time in the shadows before surging into momentum. The Fibonacci spirals found in shells, storms, and galaxies reappear in price action—offering not just numbers, but a language of emergence. What we witness in the TOTAL market cap is not just a breakout—it is a reawakening. A collective pulse of belief, liquidity, and intention. In this confluence of technical geometry and macroeconomic tides, the market becomes more than price—it becomes a story, a symbol, a signal. We don’t just analyze this chart—we read it like a sacred map, charting the ascent of value, vision, and velocity.
BTC short at 116000 to 110500Short BTC116000 looks doable.
E: 116000
SL: 117500
TP1: 113555
TP2: 110500
TP3: 105000
Possibility of 96k, but I doubt it at this moment. would need to take 119k first in my belief, and now there is too many bearish signs for that.
Currently BTC moving after bearish Symmetrical Triangle, forming Diamond Top pattern, perfect entry would be around 116000.
Looks like February 2025
