ALL PUMP. NO DUMP.They said doge was a pump and dump!?😂 We can’t even hear those people way up here.
Tothemoon!!!

Dogecoin bullish trendAround 04:00 (GMT) it broke through Resistance 1, we see a small retracement and now the uptrend is headed for Resistance #. If it breaks through we will probably see a small retracement. After bouncing on Support # (Resistance #) we will have no gravity and we will go to the FCKING MOON!!!!!!!

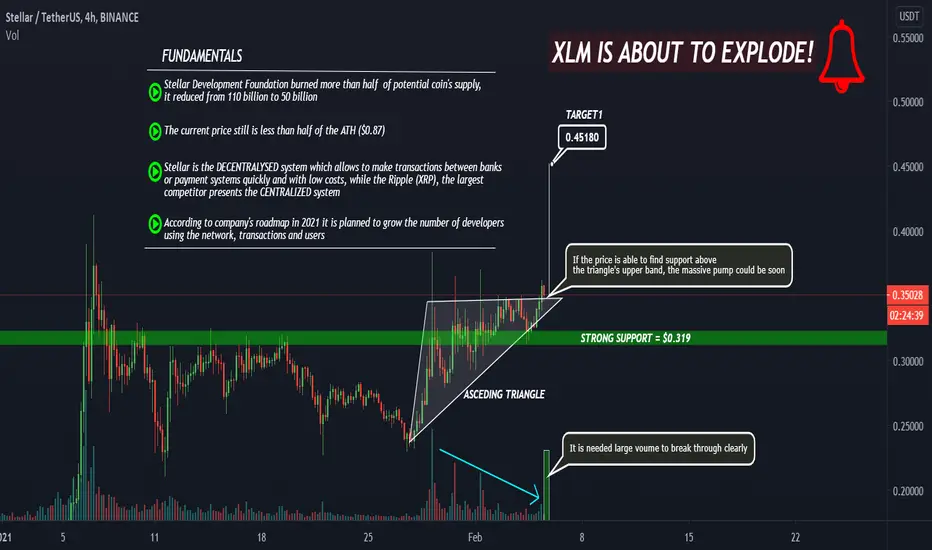
Stellar (XLM) Can Explode Soon! TA + FundamentalsHello, guys!
Let's take a look at the very perspective altcoin which can give nice growth in 2021.
Stellar is the DECENTRALYSED system which allows to make transactions between banks
or payment systems quickly and with low costs. Thus, it has the great fundamentals to explode in this year. You can see these fundamentals on the chart.
As for TA the price formed the ascending triangle. If now the price is able to find support above it's upper band the first potential target is $0.45, but we need a large volume to do this. In every case the $0.319 looks like a very strong support.
DISCLAMER: Information is provided only for educational purposes. Do your own study before taking any actions or decisions.
AMC buys, expecting HIGH impact from wallstreetbets Tp 50$So far AMC has shown a crazy journey, but don't expect the end soon since this is only the beginning.
I'm considering AMC to go till 50$.

EUR/AUD "W" pattern completed. Good Day Traders !!! On this pair we have a market correcting on the M timeframe as well as the W timeframe. On the daily we can clearly see an overextended "W" pattern being completed and we are ready for an impulse to the upside. The target is the 50% FIB retracement taken on the weekly impulse and that aligns perfectly with the next weekly resistance. From a COT perspective we have a strong Eur overall and we do expect this move to complete the Weekly pattern and the impulse correction continuation that we can see on the Daily timeframe.
Now if you enjoyed this analysis please like and share, If you have a different opinion you can comment below as I would love to get more insights about this pair.
Trade safe !!!

possible bullish outbreak for dogecoinStoch indicates a possible bullish trend. might be a fake outbreak, we will see. Let's get this motherfcker to the moon!!!!!!!!

Feeling goodHi!
I expect this coin, which I have been watching for a long time, to increase approximately 2.5 times in 2 months once the correction from the hanging man pattern is complete.
It's my opinion, not an advice for you. If you have any other ideas please share with me.

Levels to keep an eye on! As DOGE goes into uptrend.My previous rule was in play for the downtrend line it recently broke upwards through, so it's no longer in play, but it still can give some resistance.
The resistance levels to look for during its climb will be approximately be (the MA numbers will change as the price moves):
50 day moving avg $0.0352
61.8% fib $0.0373
100 day moving avg $0.0380
Then it would climb up to $0.0469 which is the 50% fib of the entire rally, and past that... it would go to the moon :)


40k$ is not the high! (Bitcoin's historical growth curve)Hello traders, or this time investors,
here is my long term log Bitcoin chart with historical data.
Because of this growth curve and the fact that we "only" made
1.400% so far, since the last low at 3.000$, I believe that we can
still expect much higher price for Bitcoin this year.
But as you know it's not only about the price.
Wish you all a nice weekend.
Greetings
Jens

Flick The Chart ! Ethereum & Bitcoin After yesterday's crazy 900% gain for dogecoin? Why hasn't Etherum & Btc Moon yet? Well get ready folks, I predict the next few weeks are going to be a rocky ride, so flick the chart. Their reason is no valid reason why BTC isn't at $60000 or Etherum at least $15000 yes $15000 for Etherum. These two coins just proved to the world how powerful they really are to the world when RobinHood Halted Trading because, on Wall Street Bets, we all witnessed who really manipulates the markets.
Get ready because these same hedge funds that lost money are going to be pulling out all the stops in the next few weeks in an attempt to short bitcoin . But Bitcoin and Etherum are going to the moon.
Just my 2 cents :)

$GME is going to $500Contextual immersion trading strategy idea.
GameStop Corp. operates as a multichannel video game, consumer electronics, and collectibles retailer in the United States, Canada, Australia, and Europe.
The demand for shares of the company still looks higher than the supply.
I think the short squeeze will continue, thanks wallstreetbets.
Short interest over 100% and free money from FED are not a joke.
So I opened a long position from $220;
stop-loss — $80.
take-profit — $500.
Do not view this idea as a recommendation for trading or investing. It is published only to introduce my own vision.
Always do your own analysis before making deals. When you use any materials, do not rely on blind trust.
You should remember that isolated deals do not give systematic profit, so trade/invest using a developed strategy.
If you like my content, you can subscribe to the news and receive my fresh ideas.
Thanks for being with me!

SXPUSDT To The Moon?SXPUSDT (Day CHART) Technical Analysis Update
Waiting for the resistance zone breakout
SXP/USDT currently trading at $1.30
Buy-level: Above 1.35
Target 1 : $1.81
Target 2 : $2.40
Target 3 : $3.20
Target 4: $4.35
Max Leverage: 2X
ALWAYS KEEP STOP LOSS...
Follow our Tradingview Account for more Technical Analysis Update, | Like, Share and comment your thoughts.

AUDUSD LongAUDUSD is trending to the upside still despite the recent wave of USD strength. Technically there are multiple confluences:
- 2021 open level
-61.8% fibonacci retracement
- 200 moving average
- 1H bullish close, pinbar pattern

XAUUSD has broken to the upside of trading wedge!I anticipate further upside on gold to retest the prev highs, as we've broken above the wedge pattern and are above the 50,100&200 moving averages.

BTC price is preparing for the big move!Hello, dear subscribers!
Today we are going to talk about the warning sign which the market gave to us.
The Bitcoin price is going to form the big descending triangle. We can identify clearly three points at the upper and lower bands. Now the price is next to the lower band level. If the price is able to bounce off it we can see the upward move to the upper band.
Here are two significant reasons that it will be very difficult to continue the growth in the short run. First of all is the R1 pivot level rejection of $33000. This level was a very significant support level and now it is resistance. The second case is that the price always bounced off the 150 EMA line on the 4 hours timeframe during the last 4 months bullish rally, but now it is below this line and was rejected twice.
Also we can see that the volume have been decreasing during the triangle's formation and now it is really low. It is the sign that the big price move for the Bitcoin is upcoming. The negative scenario is the possible testing of the CPR level of $25000. Please be very careful!
DISCLAMER: Information is provided only for educational purposes. Do your own study before taking any actions or decisions.


UsdChf Inverse Head&Shoulder(Swing Trade Idea)
Potential Inverse Head&Shoulder forming.
Wait for price to properly hit support before entering when market opens.

Warning! BTC Potential Price LevelsHello, dear subscribers!
The Bitcoin dumped today significantly. Today we are going to estimate global targets for the pessimistic scenario for the Bitcoin.
First of all take a look at the all bullish rally since October 2020. We can notice that during corrections the price always found support at the 30-day EMA. Now the price clearly broke this line down. This is the first bearish sign.
The big symmetric triangle which started to form at the beginning of January 2020 was broken down today with a huge red candle.
Now let's consider the potential levels for the BTC. The monthly CPR level ($33000) was broken today. The next strong support is the $33000 level because the price found multiple rejection here, also it coincides with 1.61 global Fibonacci retracement level since 2017 year bull run.
If the price is able to break this level down the next target is monthly CPR ($25300). The last dump level is the symmetric triangle's breakout target which corresponds to it's height. This level is $21400 which exactly coincides with monthly S1 level.
DISCLAMER: Information is provided only for educational purposes. Do your own study before taking any actions or decisions.


Three Possible BTC Price Move ScenariosHello, dear subscriber!
Let's consider possible scenarios for the BTC price action.
Now we can see that the triangle formation is almost completed. It means that the big move for Bitcoin is upcoming.
The most positive scenario 1 (green arrow) implies that the price will break through the triangle's upper line at the first significant point on the chart at $38400. This is indefinite area and we are going to close long position here. If the price is able clearly break through this level we can see the price growth to ATH ($42000). According to triangle pattern theory the maximum growth can be up to the $50000, but there will be difficulties to close above the ATH.
Scenario 2 (blue arrow). Triangle patterns rarely end before the complete formation. As a result, after reaching the $38400 (upper line of triangle) we can see a pullback to the lower band.
Scenario 3 (red arrow). What can be if the price is able to break down the triangle? The triangle's lower band coincides with the global uptrend support line. If the price break this level down it is the bearish sign, we can see the $30000 level of significant support. The maximun decline can be equal the triangle's height which corresponds to $22000.
Another one important thing is that the Bitcoin dominance is increasing now after last week decline. It means that the money is accumulated in BTC now, which can be the significant evidence for the future price pump.
DISCLAMER: Information is provided only for educational purposes. Do your own study before taking any actions or decisions.

