TheGrove | EURAUD BUY | Idea Trading AnalysisEURAUD remains overall bullish, trading within a well-defined ascending structure.
Price is now approaching a high-confluence area, where the demand zone aligns perfectly with the lower red trendline. This intersection is critical, as it represents a classic trend-following buy zone within a healthy uptrend.
As long as this zone holds, we will be looking for bullish reactions and continuation setups, aiming for a move back toward the upper side of the channel and the previous highs.
Hello Traders, here is the full analysis.
I think we can soon see more fall from this range! GOOD LUCK! Great BUY opportunity EURUAD
I still did my best and this is the most likely count for me at the moment.
-------------------
Traders, if you liked this idea or if you have your own opinion about it, write in the comments. I will be glad 🤝
Trade-setup

MON trade setupBINANCE:MONUSDT.P
The logic is practically the same as in my review of ENA.
We observed a price deviation from the range. Then, we returned to the range and entered from the point of convergence (PoC) to the upper limit.

NEAR - an addition to the original idea (AMD model).My first review here -
Nothing has changed; everything is still relevant. I'm just analyzing it in terms of the AMD model.
It looks really technical and cool!
BINANCE:NEARUSDT.P

Is Rivian Setting Up For a Breakout?Hi Traders!
On Nov. 5th, Rivian created a daily bullish CHOCH pushing price to resistance at $18. The following weeks showed price returning back to retest that daily CHOCH. Since then, it looks to me that Rivian is working to complete a cup and handle pattern (Lower TFs).
IMO the daily and weekly look bullish, and Rivian could be setting up to break past resistance at $18. Therefore, my plan is to long swing Rivian to a potential target at $20. My ideal entry would be around/in between $16-$16.50, but when looking at a lower TF $17 area could be respected. Watching closely, and alerts are set!
*DISCLAIMER: I am not a financial advisor. The ideas and trades I take on my page are for educational and entertainment purposes only. I'm just showing you guys how I trade. Remember, trading of any kind involves risk. Your investments are solely your responsibility and not mine.*

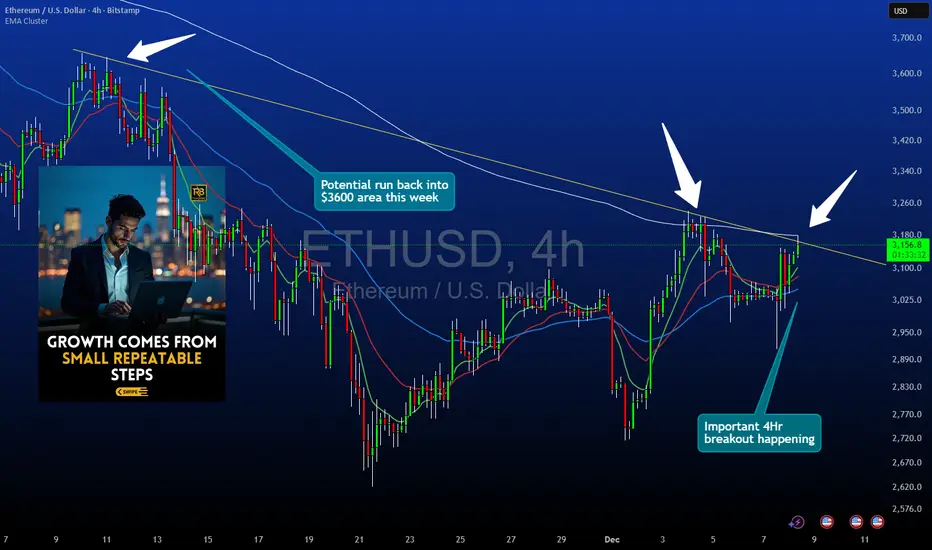
Ethereum 4HR Structure UpdateThis idea focuses on Ethereum on the 4 hour chart.
Price is approaching a descending trendline that has acted as dynamic resistance. A break and confirmed close above this trendline is required before considering any long setups.
Key Levels and Structure
• Primary focus is the descending trendline that has capped every recent bounce
• A full candle close above the trendline is essential before any entry is planned
• The upside reference area for this idea is near 3600 where prior reactions occurred
• Invalidations sit below 2950 which would represent a break beneath the recent structural base
Entry Logic
This setup is based on confirmation rather than anticipation.
• No entries should be taken while price remains under the trendline
• A strong bullish close outside the trendline is needed
• Weak closes or wicks through the trendline without body confirmation do not qualify
• The idea is only valid once the trendline is clearly violated on a closing basis
Why the Close Matters
Closing outside the trendline shows that market participants have accepted price above the descending structure rather than briefly testing it. This helps filter false breaks and reduces reliance on intrabar volatility.
Risk Parameters
Stops would be referenced below 2950 since a move under that area would indicate failure to hold recent structural support. The 3600 region is used as the first upside reference point based on previous reactions on the 4 hour chart.
Notes
This idea evaluates structural behavior and does not forecast future performance. Users should confirm levels and apply their own risk management plan before taking any trade.
Nasdaq nearing critical balanceIn November, we observed a Hagopian pattern - the market failed to reach the centerline despite the high probability of doing so (see weekly chart left). MACD-V is in divergence since then. A sign to be especially cautious.
This led to the current rally lasting more than ten days without a single close below a prior low. It seems the Plunge Protection Team may be at work.
In any case, we are now approaching the yellow centerline, the market’s point of balance. From there, the market will determine whether we push once more above the yellow centerline toward the white U-MLH, or turn downward, producing a second Hagopian and falling back toward the white centerline.
If the second scenario unfolds, the path toward significantly lower prices would be wide open.
Let’s see what we get for Christmas…

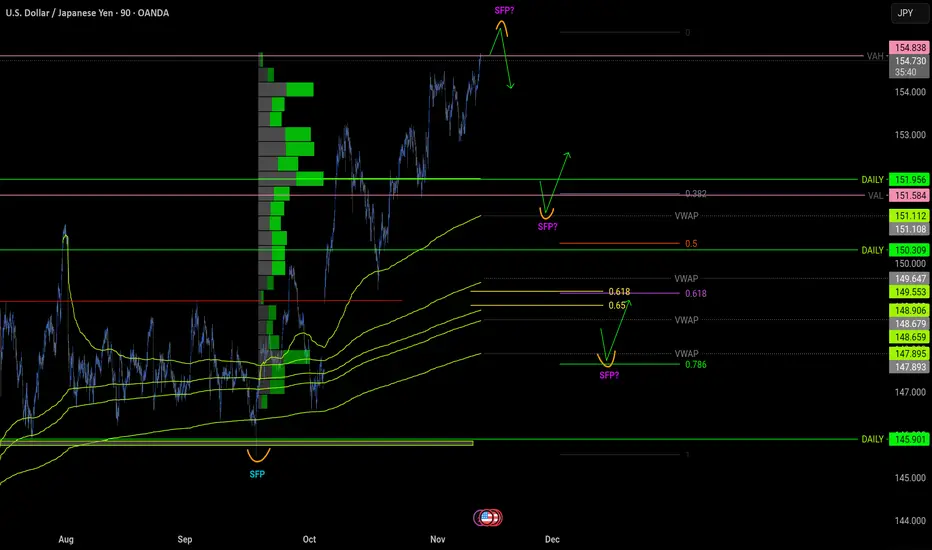
USDJPY idea 12.11.2025I'm primarily following two scenarios in this market: a short position would be possible when the SFP is above the value high. I would like the nearest long when the price drops somewhere around 151.2, where there is a nice confluence. The 0.382 fibo value low level and the daily level are converging. I would like another potential long only after the gap is filled.
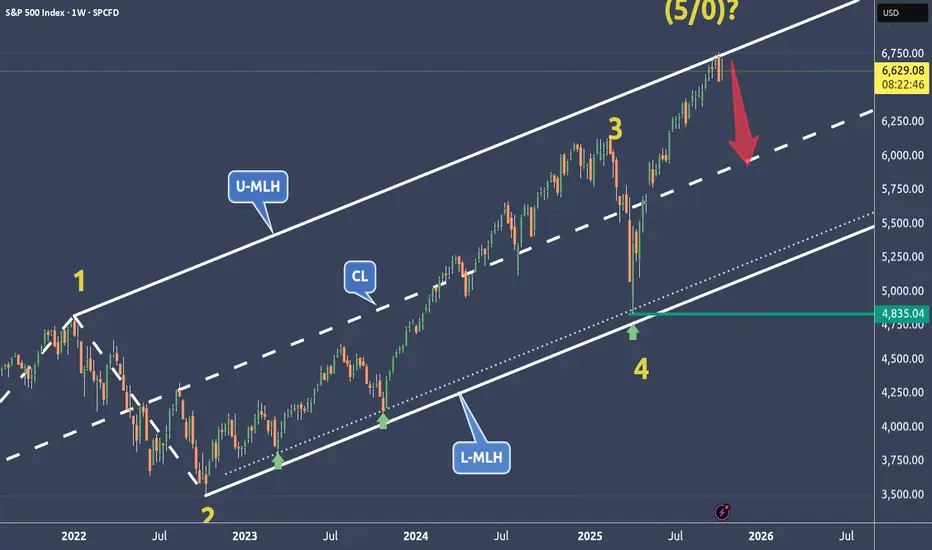
SPX is weakening at a very dangerous price level🔱 SPX is at a very dangerous price level ⚠️
...right at the Upper Median Line Parallel.
💰 If this market turns, the Centerline becomes the next target.
The 0-5 Count is also a good indication when prices start to turn at these extreme levels.
⚠️ Stay sharp — momentum is fading.
I wish you all a relaxing weekend.
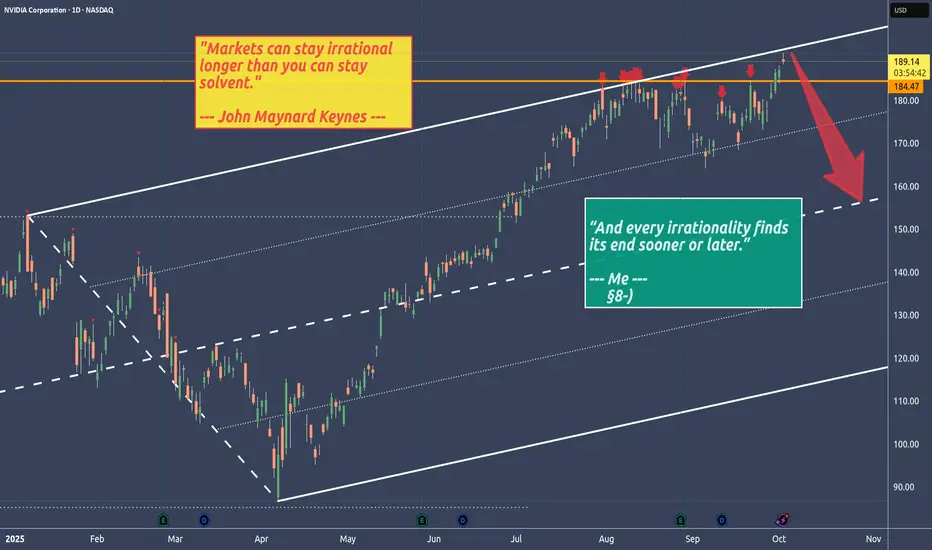
NVIDIA - Stalking NVDA with a short trade in mind🔱 Second approach to crack the U-MLH 🔱
No matter how irrational markets get, sooner or later the Black Bird strikes them down.
We’re back at the U-MLH where price is stretched.
Could it trade through it?
Absolutely.
Even better would be if price trades above the U-MLH and then falls back into the fork — that would be a strong confirming short signal.
But a turn right at the U-MLH would also be a heads-up for me.
👉 Stalking NVDA with a short trade in mind.
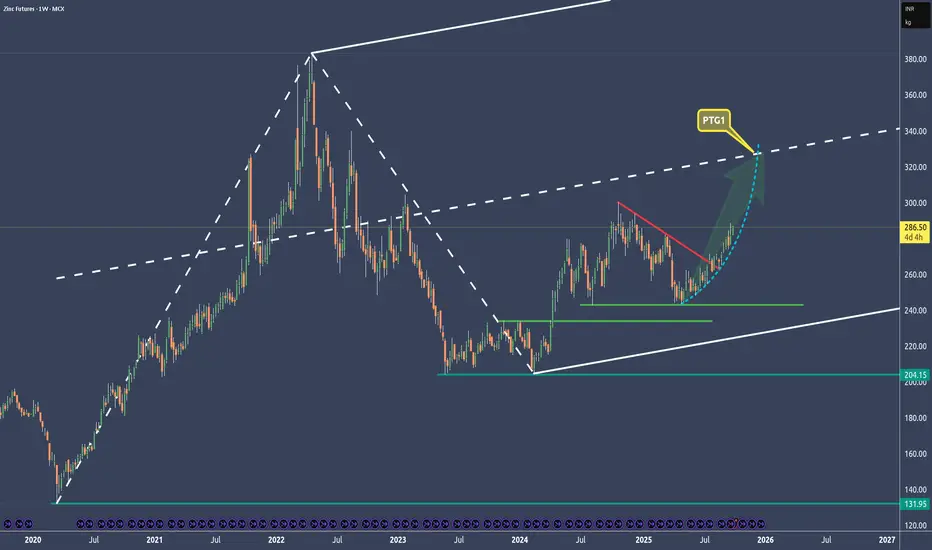
Zinc - Exponential Move To Profit Along With Copper🔱 I posted about copper and zinc on Sep 17. 🔱
Both are closely correlated, and now zinc is moving exponentially.
The target is at the centerline of course with around an 80% probability.
👉 If you think that these forks are doing a good job, then throw me booster please and check out my links. §8-)
SPX - That's all folks?The world has gone nuts, but markets didn't even blink.
Now the SPX has reached it's U-MLH, which means, it's at a real extreme.
This is a level where price starts to stall, then turn.
Often we see "a last attempt" to break through, and it really could happen. But then, gravity again takes it's toll and the rocket starts to turn south.
Here are the scenarios I see:
1. Immediate turn at the U-MLH. Target is the Centerline.
2. A break of the U-MLH, then back into the fork and a fall down to the Centerline.
3. Break the U-MLH, continuation to the WL1.
The most unlikely would be 3.
In my view, Party People should have left allready, but they refused to.
And that's why this time headaches will be the least problem they face.
Wating for a short signal, to load up heavy.

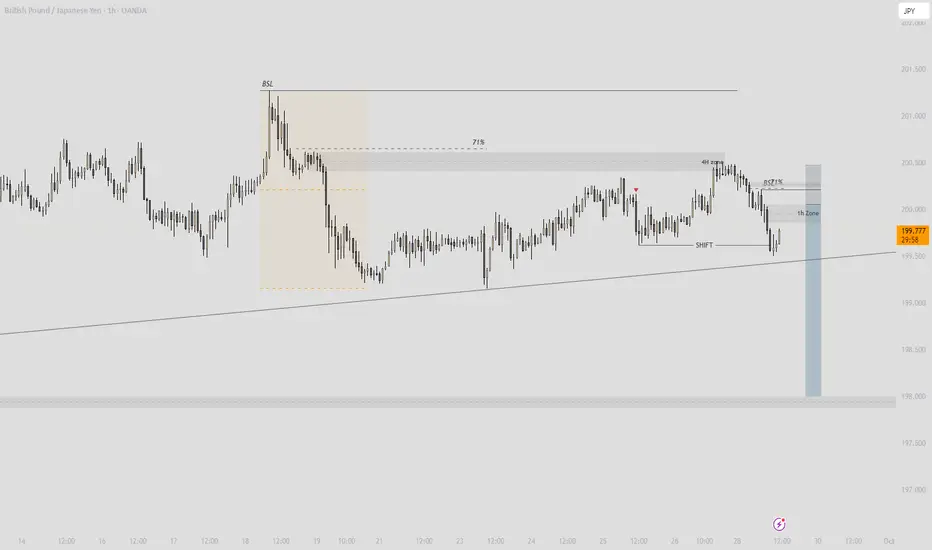
GBP/JPY - Trade Setup⚡ GBP/JPY 1H Breakdown – Samurai Short Setup ⚡
The beast is showing its hand again – let’s cook this setup 🍣👇
🕐 1H Structure
Price tapped into that 4H supply zone sitting just above the 71% fib pocket. We had a clean shift in market structure (SHIFTTT 🛑), and now price is chilling below that level – classic distribution vibes.
📍 Key Levels
Entry : 200.06 (short trigger after the retest)
Stop : 200.47 (above the BSL / invalidation zone)
Target : 198.00 (next demand / liquidity resting below)
R:R ratio = ~5R – heavy sniper play 🎯
🧠 Technical Breakdown
BSL taken: Buy-side liquidity above the swing high got swiped, perfect trap for the bears.
Structure shift: Market flipped bearish after rejection, confirming supply in control.
Confluence: 4H supply + 71% fib + liquidity grab = textbook high-probability short.
🎯 Play Idea
Looking to ride shorts down into the demand zone around 198.00. If stop gets clipped, that means bulls ain’t done hunting yet, but structure says bears got the edge.
✅ Summary
GBP/JPY lining up a short wave – clean liquidity sweep, structure shift, and high R:R. Samurai precision needed here 🗡.
XHB - Housing Is In Real Trouble - My Short explained🏠 Some Facts & Fundamentals first 🏠
The Fed has made its first rate cut in 2025, and more are expected if inflation remains under control. That could put downward pressure on long-term mortgage rates, which may give the market a little boost.
Builders (like Lennar) are 🏚️ facing profit pressure 🏚️ due to affordability and are offering incentives (rate buydowns, other discounts) to spur demand.
📈 Now to the technicals 📉
Price went up to the Centerline. The 80% rule played out like textbook.
Then it closed above the Centerline, and failed to move further up to the U-MLH, which is a loud 🚨 warning sign 🚨.
And finally, we have a confirmed "Hagopian", when we close below the Centerline this Week.
To me it's all perfect in line - I mean, the TA & Fundamentals.
My plan is, to play XHB short with LEAP Options (182 Days) and take profit on the way down, which is at the Centerline, 1/4 Line and the L-MLH.
Of cours I would bail out or hedge, if price open & close again above the Centerline on the weekly time frame Chart.
⚠️ Stay updated ⚠️
I will start something new in one or two weeks, so you better don't miss it and follow! §8-)
❤️ THANK YOU ALL ❤️
...for the Boosts and Follow from this week. Your feedback is what makes it worth to post!
I wish you all a relaxing and happy weekend §8-)

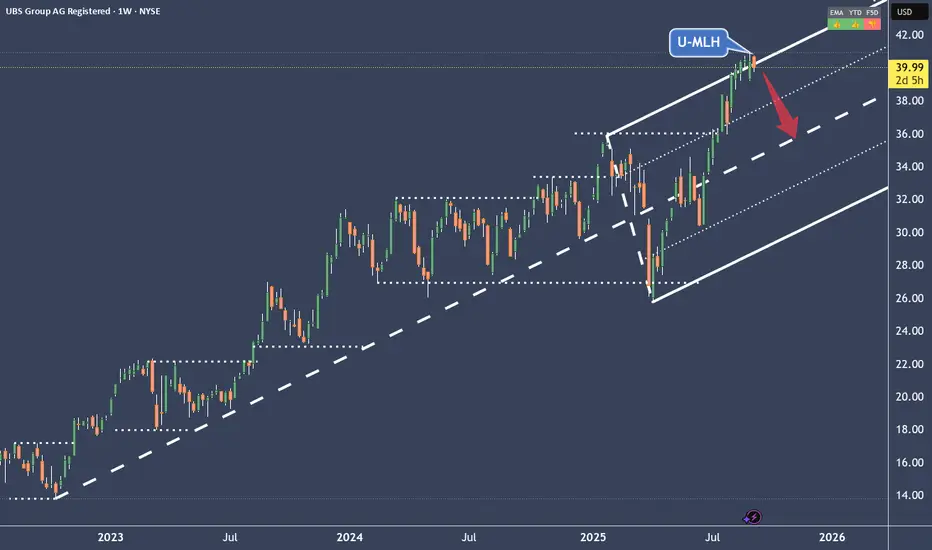
UBS Swiss Bank ran too hot for my likingBut I like it!
It's a fair short opportunity IMO.
Also, the setup is playing out very nice.
It opened & closed back into the Fork on the daily.
I approach it the same way like the Google short, with ITM Options (see link).
Target is the Centerline with an 80% chance of success.
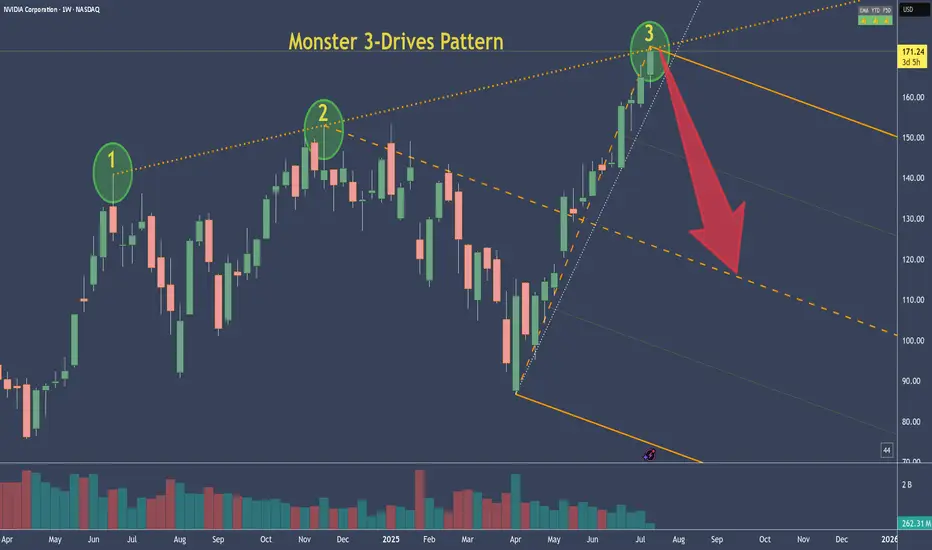
NVDA - NVIDIA's 3-Drive Pattern target if it plays outThis is the weekly chart of NVDA.
We can clearly see a 3-Drives pattern forming.
If this pattern plays out, the centerline would be my target. Of course, it's still too early to short.
But I’ve got my hunting hat on and I'm watching for signals on the daily chart.
One would be a break of the slanted trendline—but there are a couple of other conditions that need to align as well.
Always ask yourself: What if?
SAFEMOON - Not so safe for the medium termIt looks as though there could be a fractal for SAFEMOON. Historiclally, we've seen rises like this but only to be dissapointed and for the trend to be reversed again. I've drawn out a blue line of what the most likely trajectory will occur. The only other alternative is that the upward trend will continue, buying action will surge and we will see a bursting through of the upper trend line and escape the channel. If it comes back within the channel momentarily, that's fine - but not if the volume dies down and we stay within. So, it doesn't look great for an investment and I wont be putting anyting into it. Follow for more.

Scenario on usdjpy 23.1.2025 The market has formed sfp above the high which gives me an idea of where the market could go the likely scenario is a return back to the price around 158 from where a rebound and return back to lower levels could follow

LTC - Loads more up to goI've had a lot of requests for custom analysis on LTC. Its looking strong within the channel and there's potential for lots more up to complete the X wave, which would still look corrective in a very straightforward looking ABC. I actually don't like LTC too much. It's slow, sluggish, doesn't keep up with market trends. But, it's looking strong for some more up. Follow and share for more.

BTC, higher highs incomingBTC has shown huge confidence in with a trendline breakout on price, volume and MACD is looking near vertical too. These are what I call signals that 'jive' together. I would never place a trade on one signal alone, I try and gain as many signals to jive as possible before risking any assets. It's great to see and that means we're within the long awaited wave 5 of larger degree of trend 1. Which, would see at least 135k. Exciting, high confidence here. Follow and share for more.

JAZZ downtrend intactWe can observe how the price continues to decline within the descending channel. Current pullback might present a solid RR selling opportunity.


EURPLN updated trade ideaPreviously we shared EURPLN short trade setup, which was closed at break even. This time is a new setup with different downside target.

Premium Long Trade Setup: DUSKUSDTToday, I’m excited to share our premium long trade setup for DUSKUSDT. Let’s start by focusing on the critical $1.45 support level, where we observed a clean rejection of the 161.8% Fibonacci support. This rejection is a strong positive signal, indicating a potential trend reversal for DUSK.
Currently, we see the completion of a 5-wave move to the upside, which confirms that this rally is not merely an ABC correction. With the 5-wave structure complete, it’s logical to anticipate an ABC correction to the downside.
We’ve strategically placed our buy limit order at $0.2211, offering a robust 1:3 risk-reward opportunity. Additionally, we’ve set three upside targets. Upon reaching the first target, we plan to secure 50% of the profit and simultaneously eliminate the trade’s risk. This approach allows us to manage the trade with confidence, knowing that we’re in a strong position for potential gains.
Let’s monitor this setup together and enjoy the process. Happy trading!
