BTCUSD - Potential Daily Forecast== Technical Outlook ==
Looking at recent price action, we saw a strong bullish impulse from around the $86,000 level up to the $94,000 level. Following today's disappointing ADP jobs figures from the US, we observed continued gains in the greenback due to risk-off sentiment. Nasdaq and gold prices also declined after the report, as it reinforced conviction that the Fed will refrain from slashing interest rates, in line with Powell's recent statements.
Bitcoin is currently finding support at the 50% Fibonacci level, with a strong demand zone around the $90,000 level. If we see another bullish impulse to the upside, this could break through the resistance at $94,000 and potentially push prices back up to the $100,000 level.
== Fundamental Backdrop ==
The split vote and Chair Jerome Powell’s carefully calibrated tone made clear that policymakers are in no rush to accelerate the easing cycle. Officials want greater confidence that the labor market is cooling in an orderly way and that inflation, which Powell described as “still somewhat elevated,” is on a convincing path back to target.
During the press conference, Powell stressed that the Fed feels well positioned to respond to incoming data, but he offered no hint of an imminent follow-up cut. At the same time, he firmly dismissed the idea of rate hikes, which he said do not feature in the baseline outlook.
On inflation, Powell pointed directly to import tariffs introduced under President Donald Trump as a key factor keeping price pressures above the Fed’s 2% target for now, reinforcing the sense that some of the inflation overshoot is policy-driven rather than demand-led.
With that said, markets will now focus on this Friday's jobs data. It's been common in the past to have a negative ADP report but a positive NFP, which is why we might not see Bitcoin continue to sell off heading into this Friday's report.
Tradeplan

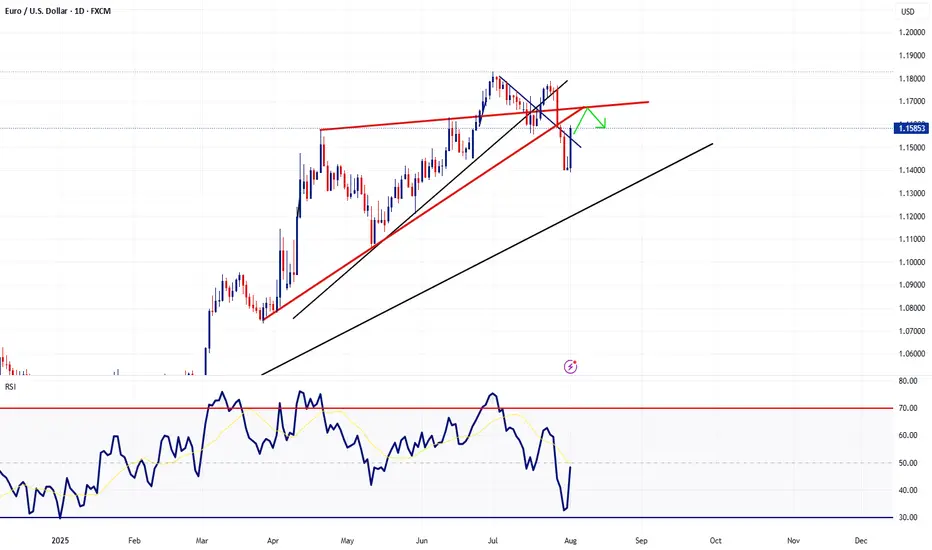
What to Expect this week for EURUSDThe price has been forming a clear Elliott Wave pattern to the upside since early November 2025. The first impulse wave retraced to the 78.6% level, followed by another bullish impulse that pulled back to the 38.2% level. A pullback to the 38.2% or 28.6% level typically indicates strong bullish momentum. As we observe the final impulse in the classic Elliott Wave structure, the price has now pulled back to the 50% level, a deeper correction than the previous 38.2%. This suggests the price may be starting to reverse. The key question is whether the price will break below the ascending trendline. I believe there is a strong possibility of this occurring. Let’s review the economic calendar for this week’s upcoming risk events.
MAJOR RISK EVENTS TO WATCH OUT FOR THIS UPCOMING WEEK
📅 Tuesday, Jan 6
* Germany CPI / HICP Flash (Dec) – headline and harmonized inflation — market-moving for EUR and ECB expectations. Scheduled for ~13:00 GMT.
📅 Wednesday, Jan 7
* Eurozone CPI Flash (Dec) – inflation for euro area (headline + core) ahead of ECB context.
* ADP Employment Change (Dec) – private payrolls preview of Friday’s jobs.
* ISM Services PMI (Dec) – key for services-led U.S. economy.
📅 Thursday, Jan 8
* Eurozone Unemployment Rate (Nov) – growth/employment gauge for ECB outlook.
* Weekly Jobless Claims – labor market breadth check.
* Trade Balance (Oct) – net-exports impact on GDP narrative.
🔥 Friday, Jan 9
* Eurozone Retail Sales (Nov) – consumer demand signal.
* U.S. Nonfarm Payrolls (Dec) – the big one for USD volatility (jobs + wages + unemployment).
Key levels to watch
Upside: Analysts highlight 1.1760–1.1807 as immediate resistance; a firm break and hold above this zone opens room toward previous highs near 1.1840–1.1917.
Downside: Supports are clustered around 1.1700–1.1702; a decisive break below could shift bias back toward 1.16–1.15 in a deeper correction of the recent uptrend.
What to expect this week
Many short‑term outlooks describe the bias as cautiously bullish or neutral as long as EUR/USD holds above roughly 1.17, with the broader trend still pointed higher after the move up from 1.1585 and, earlier, from near 1.04.
Direction is expected to depend heavily on upcoming U.S. employment and inflation releases and key Eurozone data, with the possibility of sharp intraday swings despite relatively contained overall ranges.

US30 Scaling Setup – Pullback to 48k Targeting 50,000 Year EndUS30’s near highs (~48,500–49,000), but a pullback to 48,000 looks likely as we await the first US unemployment rate release since the 43-day government shutdown—a highly anticipated event. Here’s my plan to scale longs and hit 50,000 by Thursday/Friday:
Setup:
Area of Interest (AOI): Targeting ~47,800–48,200 (around 48,000), a high-volume support zone (volume profile) with past buyer activity.
Confirmation: Enter on stalling bearish momentum (e.g., RSI ~50, MACD histogram flattening, bullish pin bars on 4H/1H).
Strategy:
Initial Entry: Small position (0.01 lot) at 48,000 to scalp intra-day bounces.
Scaling In: Add a 2x larger position (0.02 lot) at 47,800 if price drops, building exposure.
Target: Aim for 50,000 (psychological resistance) by Thursday/Friday, December 18–19, post-unemployment data. Close all trades at target or if 4H closes below 47,800 (bearish resumption).
Position Management: Trail stops to lock in profits (e.g., breakeven at +0.2%, trail to 0.5% portfolio gain). This trade fits my broader portfolio (e.g., XAUUSD, EURUSD), with adjustments based on weekly performance.
Risk Management:
Cap risk at 1–2% per trade, 10% portfolio max (per FTMO rules). Stops at 47,500 (initial) and 47,000 (scaled). Diversify with XAUUSD/EURUSD to spread exposure. Reserve margin for event volatility.
Key US Economic Events (Times EST):
*** Tuesday, Dec 16, 8:30 AM: Nonfarm Payrolls (Oct/Nov, delayed). Forecast: ~40,000 (Nov, per). Weak (<20,000) could rally US30 to 50,000; strong (>100,000) may deepen pullback to 47,800.
*** Tuesday, Dec 16, 8:30 AM: Unemployment Rate (Nov). Forecast: ~4.4% (per). First release since shutdown (September: 4.4%, highest since 2021). A spike (>4.7%) could trigger risk-off to 47,000; steady (~4.4%) may support 50,000.
*** Tuesday, Dec 16, 8:30 AM: Retail Sales (Nov). Forecast: +0.4% m/m (per). Weak (<0.2%) may push to 47,000; strong (>0.6%) could delay pullback.
*** Thursday, Dec 18, 8:30 AM: Initial Jobless Claims (week ending Dec 13). Forecast: ~220K (per). High (>250K) supports US30; low (<200K) caps upside.
Market Context:
US30’s up 17% YTD but faces resistance at 50,000 (per,). RSI (~55) and MACD flattening suggest a pullback to 48,000, a high-volume zone (November 2025, per,). The Nov unemployment rate (Tuesday), the first since the shutdown, is a major catalyst—steady data could fuel a rally to 50,000; a spike may trigger risk-off. Volatility’s 1–2% daily (~500–1000 points), ideal for scaling longs post-data.
Risk Warning:
The unemployment rate release could spike volatility. Keep risk at 1–2% per trade, diversify, and use tight stops. Trade your plan!
What’s your US30 play this week? Share your setups below!
#US30 #DowJones #Scalping #Unemployment #EconomicEvents

BTCUSD in Risk-Off Mode | Diversify & Scalp SmartBTCUSD Risk-Off Consolidation – Eyes on 70K Risk, Scalping to 100K
Bitcoin’s stuck in a risk-off rut, consolidating near 90,000–95,000 as global markets turn cautious. It’s not dumping yet, but a sell-off to 70,000 looms if sentiment worsens. Here’s my approach to navigate this:
Setup:
Current State: BTCUSD’s holding low, reflecting risk-off flows (flat 20-day EMA, RSI ~40). Volume profile shows weak support until 70,000.
Risk Warning: A break below 90,000 could trigger a slide to 70,000, a key demand zone with historical buying.
Strategy:
Scalping Start: Enter small-position scalps (0.01–0.02 lots) on intraday bounces (e.g., 4H bullish pin bars above 90,000), then manage into longer-term positions if momentum builds.
Diversification: Mitigate risk by trading other pairs (e.g., XAUUSD, EURUSD) with calculated entries. Use available margin and prop firm leverage (e.g., FTMO’s 1:100) wisely, keeping total risk at 10% max.
Position Management: Scale in cautiously, trailing stops to lock in profits. My long-term target is 100,000, but hope isn’t a strategy—small positions keep me flexible.
Market Context:
Risk-off sentiment (e.g., equity sell-offs, USD strength post-Fed) is capping Bitcoin’s upside. Recent highs near 103,000 (November 2025) faded fast, and low volume suggests hesitation. A 70,000 test is possible if macro fears grow, but 100,000 remains viable if safe-haven flows return. Volatility’s moderate (3–5% daily), ideal for scalping with tight risk.
Risk Warning: Don’t put all eggs in one basket. BTC’s downside risk demands diversification and strict risk management (10% max, per FTMO rules). Trade calculated, not emotional!
What’s your BTCUSD play?
Share your setups or risk-off strategies below!
#BTCUSD #Bitcoin #RiskOff #Scalping #RiskManagement

XAUUSD Long Setup – Scaling into ~4250 PullbackGold’s holding strong above 4300, and I’m eyeing a high-probability long setup on XAUUSD with a pullback to the ~4250 demand zone. Here’s my plan to scale in and target 4500:
Setup:
Entry Zone: Waiting for a pullback to ~4240–4260, a high-volume support area (confirmed by volume profile) with strong past buyer activity.
Confirmation: Looking for bullish signals in the zone (e.g., pin bar, absorption, or momentum divergence on lower timeframes).
Entry Strategy:
Machine-Gun Style: Scaling in with hundreds of micro-position buy limit orders (0.01–0.02 lots) across 4240–4260 to capture the reversal. Total risk capped at 1–2% of account.
Risk Management: Stops below 4220. If the setup fails (e.g., daily close below 4220), I’ll pause adding orders, close some positions to reduce exposure, or hedge with other pairs (e.g., EURUSD shorts) while keeping margin free.
Exit Plan:
Target: Targeting 4500, a key psychological level with potential resistance.
Profit Management: At +1% basket profit, move stops to breakeven +0.5% (securing a 0.5% win if stopped out). Trail stops to 4500, closing all positions at target.
Hedge Option: If momentum fades (e.g., daily close below 4220), I’ll consider hedging or cutting exposure to protect capital.
Market Context:
Gold’s bullish above 4300, fueled by USD weakness after the Fed’s December rate cut and ongoing safe-haven demand (recent highs near 4366). The 4240–4260 zone aligns with historical support from November 2025 consolidation. With daily volatility at 100–150 points, this setup offers a solid risk-reward for disciplined scaling.
Risk Warning: High-frequency scaling and hedging involve risks. Maintain strict risk control and ensure margin for multi-pair strategies. Trade your plan!
What’s your take on XAUUSD? Drop your setups or thoughts below!
#XAUUSD #Gold #Forex #Scalping #PriceAction

EURUSD Bullish Pullback Setup | Scaling into High-Volume AOITargeting a bullish setup on EURUSD with a scaling strategy into the 1.1667 Area of Interest (AOI), prepared for a 100-pip drop. Here’s the breakdown:
Setup:
AOI: Scaling longs in the 1.1640–1.1667 demand zone, a high-volume support area (confirmed by volume profile) with recent buyer activity.
Drop Plan: Ready for a 100-pip pullback to 1.1567, continuing to buy micro-positions unless the daily candle closes below the prior day’s close (e.g., below 1.1610).
Entry Strategy:
Machine-Gun Style: Placing 10–20 buy limit orders (0.01–0.02 lots each) across 1.1645–1.1667 to scale in during the pullback.
Continuation: Keep buying on dips within the 100-pip range (1.1567–1.1667) until a daily close below the last candle (e.g., 1.1610), signaling a pause.
Total Risk: Capped at 1–2% of account, with stops below 1.1567 or adjusted per daily close.
Exit Plan:
Target: Aiming for 1.1740–1.1780, aligning with recent resistance and a potential inverse head-and-shoulders target.
Profit Management: Once the basket hits +1% profit, trail stops by 0.5% to secure gains while targeting the upside.
Hedge Option: If the daily candle closes below 1.1610, pause buying and consider hedging (e.g., sell orders at 1.1610 targeting 1.1500).
Market Context:
EURUSD holds a bullish structure above 1.1610–1.1620, with buyers defending this support (recent higher lows and ascending channel). The pair’s rise from 1.1467 suggests upside potential to 1.1740–1.1780, but a 100-pip drop to 1.1567 remains possible in consolidation. USD weakness (post-Fed rate cut) and ECB’s firmer stance support the bullish case, though volatility is moderate (50–60 pips daily average).
Risk Warning: Scaling in a 100-pip drop requires strict risk control. Monitor daily closes and volatility spikes. Trade your plan, not impulses!
What’s your view? Share your thoughts or setups below!
#EURUSD #Forex #Scalping #PriceAction #VolumeProfile .

GBPJPY - Top Down Analysis== IN SUMMARY ==
Basically just waiting for the PCE report from the US to be released.
As of recently the US has been continuing to show signs of economic improvement including yesterday's GDP, Initial Jobless Claims and the early PCE report.
If today's report shows inflation still hot, I'm expecting the Yen to strengthen, US equities to decline and the British Pound to also decline.
Furthermore, Trump did announce yesterday a 100% tariff on branded pharmaceutical imports, effective October 1, which could add further inflationary pressure and weigh on global risk assets like equities while bolstering the USD in the short term.
This move, part of his broader tariff escalation, risks amplifying supply chain disruptions but aligns with the resilient US data we've seen—Q2 GDP revised up to 3.8% annualized growth (from 3.3%), driven by strong consumer spending and a narrowing trade deficit.
Initial Jobless Claims also dropped sharply to 218K for the week ending September 20, signaling a tight labor market and low layoff risks.

XAUUSD Trade Plan Follow UpThe threat of a U.S. government shutdown is intensifying, heightening the stakes and sustaining elevated gold prices in the wake of recent Federal Reserve and President Trump speeches.
Additionally, U.S. jobless claims data is set for release this morning, with the forecast at 240,000 compared to last week's 264,000. If jobless claims come in better than expected (i.e., below 240,000), it could pave the way for an ABC correction in gold prices.
Finally, monitor the PCE report scheduled for this Friday, with a forecast of 2.6% year-over-year for the core measure and a previous reading of 2.9%.

AUDNZD Trade Plan - Scaling into Weekly Resistance== VIDEO SUMMARY ==
Currently selling small micro lot
Looking to add more to the basket at AOI levels.
1st AOI level @ 1.1348
2nd AOI level = major weekly resistance @ 1.1432
That's basically it - keep it simple - trade safe

AUDCAD - Hedging Short Targeting 0.9257Currently trading a 96k prop account with an open sell trade of 0.5 lots. Price seems to want to rise higher and so I'm not really confident in this short sell position at the present moment. Roughly 30 minutes ago just before creating this analysis I noticed Aussie accelerating and especially with pairs like EURAUD. I decided to hedge it 100% by adding an equal lot on the long size of 0.5.
I believe there is a good chance this pair will rise to my first target as explained in the video which is 0.9257
At this level I plan to lock-in my hedge of 0.5 long lots, book the profit and consider adding an additional sell of 0.5 lots to bring my breakeven level closer.

AUDCAD Trade Plan on 96k AccountCurrently trading a 96k prop account with an open sell trade of 0.5 lots. Price seems to want to rise higher and so I'm not really confident in this short sell position at the present moment. Roughly 30 minutes ago just before creating this analysis I noticed Aussie accelerating and especially with pairs like EURAUD. I decided to hedge it 100% by adding an equal lot on the long size of 0.5.
I believe there is a good chance this pair will rise to my first target as explained in the video which is 0.9257
At this level I plan to lock-in my hedge of 0.5 long lots, book the profit and consider adding an additional sell of 0.5 lots to bring my breakeven level closer.

AUDCAD - Trade Plan After recording this video, I also noticed that RSI and Stochastics on the 4hour are showing topping action, this give me some belief that this pair very well might correct and pullback as expected.
Happy Trading - Trade Safe..

BTCUSD - Basic Trade PlanJust a basic trade plan I thought I'd share with the world. Working on making some improvements behind the scenes.
Let me know what you guys think.
- Trade Safe!

GBPUSD - Trade Plan Heading into NY SessionTaking a look at GBPUSD on the 1 hour timeframe, I'm expecting to see a retest of around the 1.35 handle. Once price action reaches that zone, I'll simply be looking to implement my scaling short sell strategy. I'll likely enable my Expert Advisor for MT5 to manage this trade.

Waiting for the 1.3490 AreaJust a simple trade alert set at 1.3490. If price arrives back at this level I might start with a scalp to the downside targeting roughly 15-20 pips

EURUSD - Scaling into Confluence ZoneTaking a look at EURUSD on the daily timeframe we had quite the rebound in EURUSD last Friday following the NFP report. However price action is now heading towards a cluster of resistance levels which is why I'm implement my scaling in technique using a specially designed and programmed EA that i use for MT5.
== TRADE PLAN ==
Scale-in with short positions and target a 0.5% growth on the account. In other words, once the basket arrives in profit by 0.5% CLOSE ALL.
Trade Safe - Trade Well
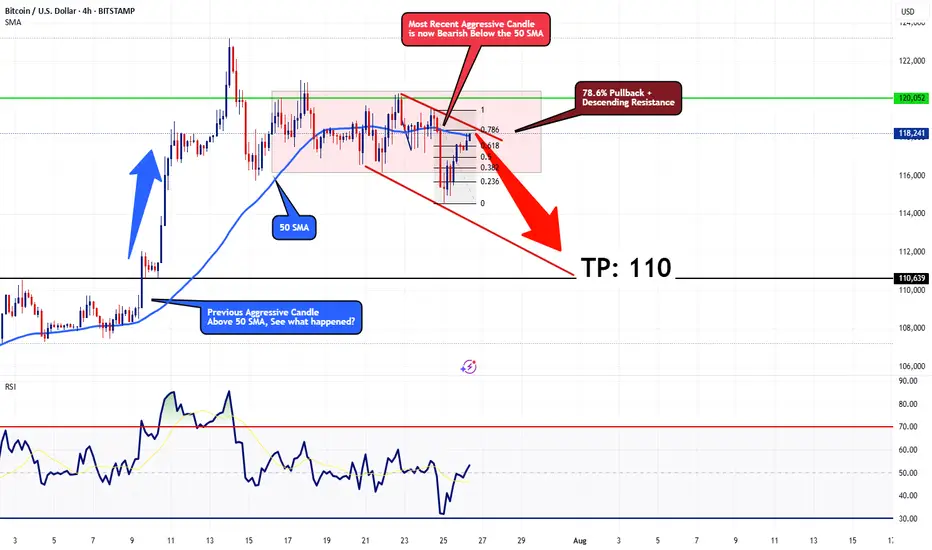
Bearish Outlook for BTCUSDOn the 4-hour timeframe, Bitcoin seems to be starting a corrective phase, likely moving toward the $110 mark. Current price action is facing resistance at a descending trendline, aligned with the 78.6% Fibonacci retracement level, which should limit any short-term upward moves. The price is also trading below the 50-period SMA, with a strong bearish candle from a few sessions back supporting the downward trend.
For a bullish outlook to take hold, Bitcoin would need to decisively break above the 78.6% Fibonacci level with a robust bullish candle closing above the 50 SMA. Until that happens, I remain bearish, with a target of $110.
This technical perspective aligns with the scenario where the Federal Reserve opts to maintain interest rates at 4.50% at this Wednesday's FOMC meeting
Stay cautious and trade wisely!
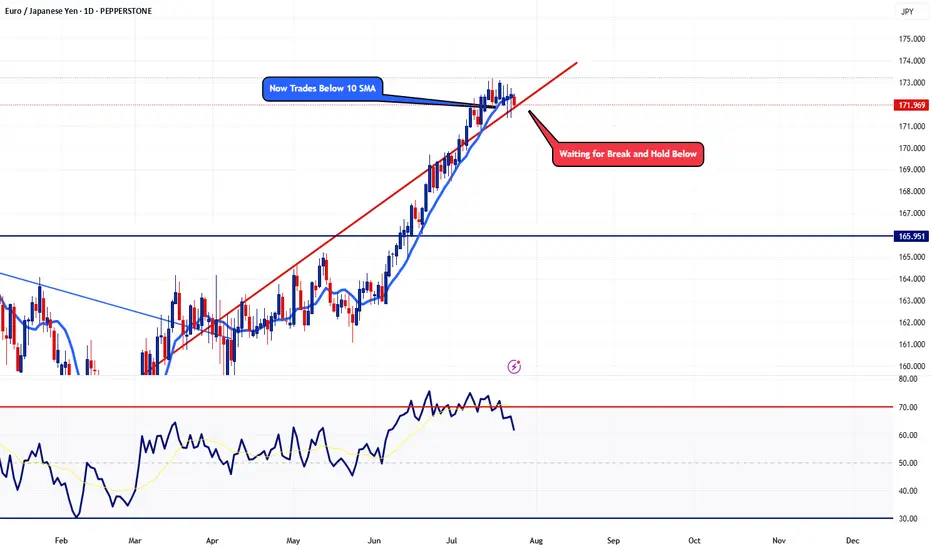
EURJPY - Potential Topping ActionTaking a look at the daily timeframe, price action is now trading below the 10 SMA. This pair has not traded below the 10 SMA since May 26. Now I'm just waiting for a few more confirmation before I'm fully confident. For now, adding a few small sells won't hurt.
Trade Safe - Trade Well
EURUSD Remains Under Pressure Following CPIThis morning, after the US CPI report was released at 8:30 AM EDT, EUR/USD surged briefly due to a slightly weaker-than-expected inflation reading. Despite this, signs of rising inflation persisted, leading EUR/USD to rise sharply before quickly retreating.
EUR/USD has seen an intermediate top at 1.1830 since early July. The euro is under pressure due to looming US tariffs (30% on EU imports, effective August 1) and mixed economic signals, like Eurozone industrial production rising 1.7% in May (vs. 0.9% expected). The pound (GBP) and other currencies are also reacting to tariff concerns.
Taking a look at the 1hour chart, you can see we are still trading below a descending trendline. Taking everything into consideration, I'm positioning short sells whenever we get bounce higher.
That's it - That's all - Trade Safe
BTC - Zoomed Out ScenarioAs predicted DXY has broken down a major monthly bearish trendline - currently finishing a bearish retest before further free fall.
If this plays out we have 2-3 years of a weakening / correcting dollar, and a strengthening investment in assets such as Bitcoin.
This means an extended bull market spanning 2-4 years on Bitcoin and equities.
However - there is a mass amount of liquidity to the uber lows towards 10,000 on BTC.
Market is showing manipulated intention to hit these lows by keeping the price below this bearish cross section - and that’s why bitcoin hasn’t been moving up yet.
This tells me this is more likely than we all think to play out.
I’m trading the following:
Short - 108,200 to 35,000
Long - 35,000 to 80,000
Short - 80,000 to 10,000
Will update accordingly if the plan changes.
Happy trading.

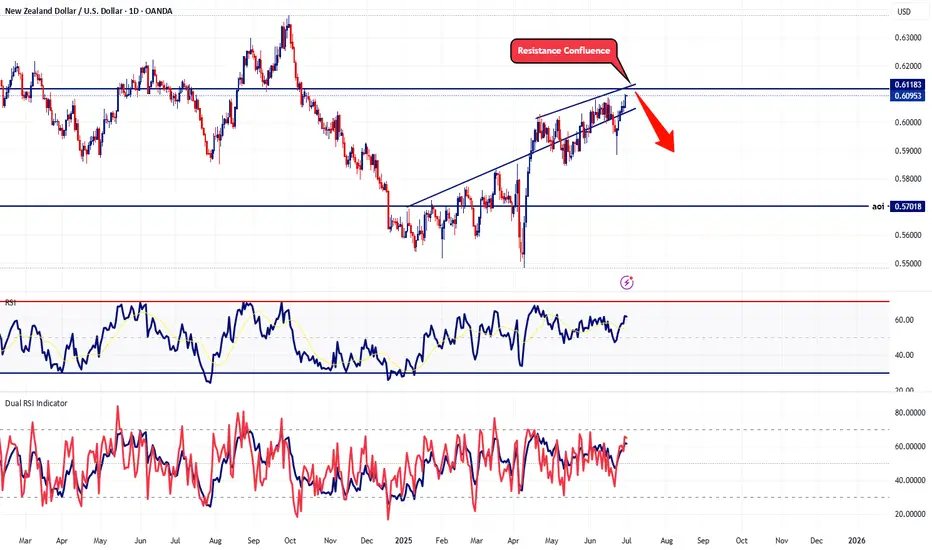
Preparing to Short Sell NZDUSD - Large LotsThis pair doesn't really get much attention but the fact is that the US is the strongest country of the majors while New Zealand is actually the weakest. When I pooled together all the economic data, these are the facts.
With that said, this pair is approaching a significant confluence resistance territory and it's highly unlikely to break above. Needless to say, I'm preparing to start scaling shorts with this pair. As I mentioned in the title, since this pair doesn't get much daily pip action, I'll be increasing my lot sizes to make up the difference.
That's it - That's all
Trade Safe
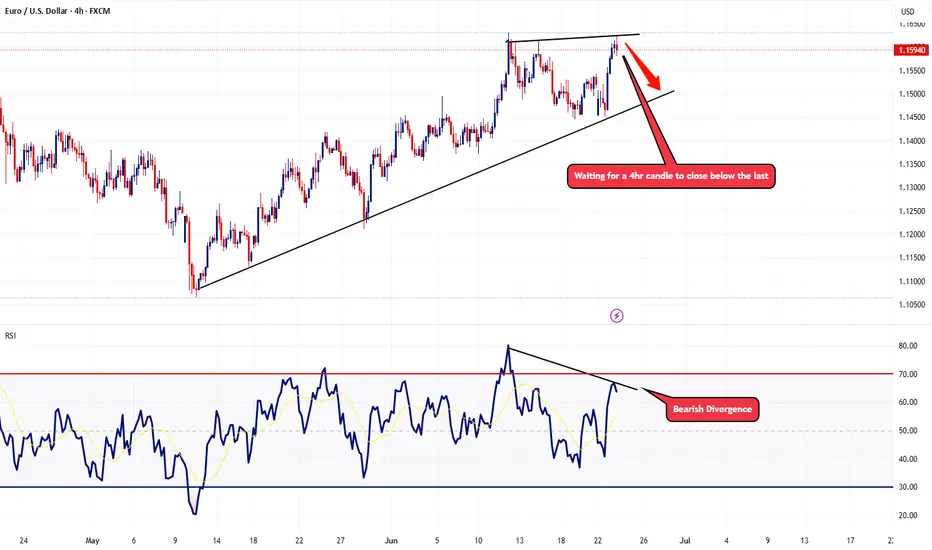
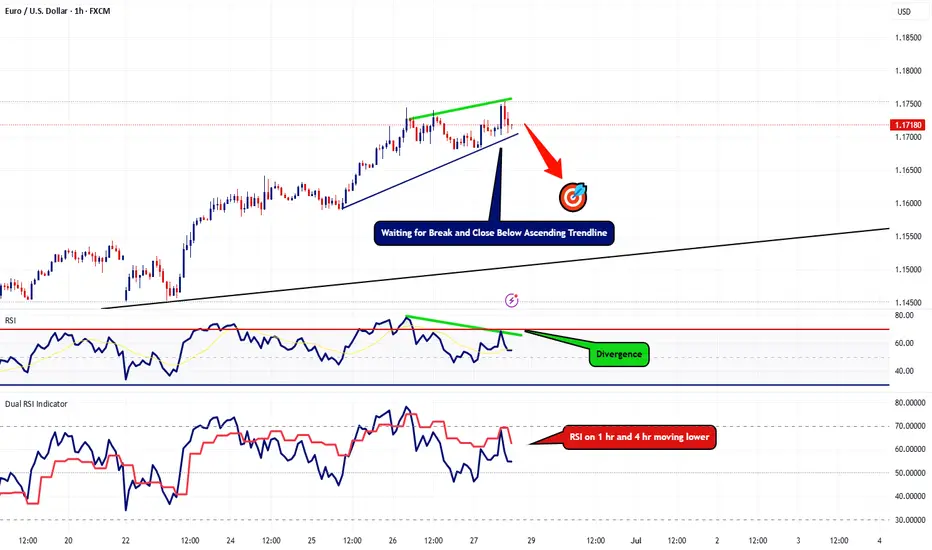
EURUSD Lots of Bearish Clues Popping UpThis is an update to my last post, I'm still waiting for that 4hr candle to close below the last. However, now I'm starting to spot more bearish indications on the 1hr timeframe.
First thing I'm noticing is the RSI divergence show that the bullish strength is weakening. RSI on the 4hr + the 1hr are heading lower. Now I'm still waiting for that 4 hour to close below the last but I also want to see this ascending trendline break and hold below as well.
In the event we break below this trendline, I'll be looking to go short with my target plotted on the chart.
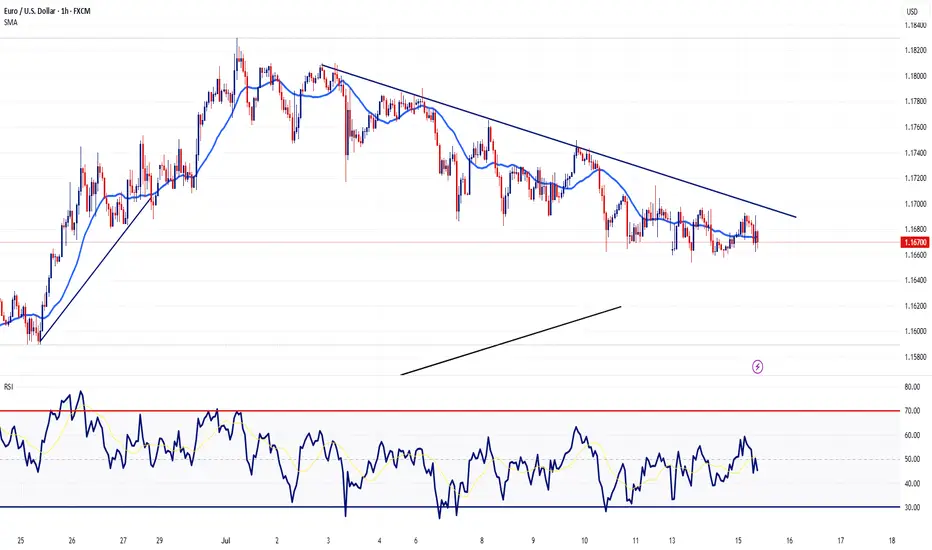
EURUSD Potential Topping ActionTaking a look at the 4hr chart, RSI is showing signs that the bullish momentum is starting to fade with the bearish divergence. In the event we get a 4hr candle that closes below the last, I'll be looking to start scaling some short positions with this pair.
Trade Safe - Trade Well.