Diary of emotions: a detailed guide. Part 1Hello, traders 😊
Today we will talk about 📖 diary of emotions .
🏳️ This is part 1, as the topic is very voluminous.
In the second part, there will be an example of a diary and consider the mistakes in its management.
I know many people don't even keep a trade journal, but they don't take into account the importance of recording emotions at all.
⚡️ Perhaps, after reading this article, you will change your mind and the diary will become as routine and important for you as opening/ closing deals.
Let's start with the definition:
✔️ Emotion Diary - is a structured tool for the systematic registration and analysis of a trader's psychoemotional state at key moments of the trading process: before entering a position, during its execution, and after closing .
📍 The purpose of the diary is to objectively identify correlations between emotional states and the quality of trading decisions, as well as to exclude subjective interpretations in the process of analyzing the results.
It is not intended for therapy, self-reflection, or motivation.
✂️ It serves as an analytical tool that allows you to quantify the impact of psychological factors on the execution of a trading strategy, thereby reducing the likelihood of errors caused by cognitive biases (there was a recent post about some cognitive biases, it will be attached)
🔎 Theoretical basis
The psychology of trading demonstrates that decisions in the market are often made not based on analysis, but under influence.
➡️ Cognitive distortions:
- the effect of disposition (profit is attributed to oneself, loss to the market);
- loss effect (greater reaction to loss than to equivalent profit);
- confirmation effect (interpretation of data in favor of one's own beliefs).
➡️ Emotional triggers:
- stress from a previous loss;
- the desire to win back;
- social pressure (comparison with other traders);
- feeling guilty or ashamed of a mistake.
📔 Studies of behavioral economics (Daniel Kahneman, Amos Tversky and Richard Thaler) and neuroscience (A.Damasio) confirm that emotions influence decision-making even among experienced traders, and this influence cannot be realized without external fixation.
The diary of emotions is a methodology of external cognitive support that allows to circumvent the limitations of human memory and subjective interpretation.
🔎 Diary structure:
A diary can consist of several important components, each of which is designed to capture a specific aspect of a psychological state and its relationship to an action.
✏️ For example, such:
🟣 1. Date and time of the transaction: provides an emotional state link to a specific transaction and time context (session, news background).
🟣 2.Position type: long / short - allows you to analyze whether there is a dependence of emotions on the direction of the transaction (for example, fear of shorts)
🟣 3.Trading instrument and time frame of analysis: BTC/USDT, H1 - captures the context, whether the emotional state affects the choice of the instrument (for example, high volatility → increased anxiety).
🟣 4. Emotional state before entering, determine the state: calm, nervous, aggressive, tired, expectation of profit, fear of loss, doubt, indifference.
Purpose: to record the basic psycho-emotional state prior to making a decision.
🟣 5. The key thought before entering. Captures the automatic thought that influenced the decision. Examples: "The market needs to bounce off this level," "I don't want to miss the last opportunity," "I lost yesterday, I'll fix everything today." Objective: to identify the cognitive biases underlying the input.
🟣 6. Emotional state during the execution of the transaction. Captures the dynamics of emotions in real time. It may differ from the state before entering, for example, "calm" → "nervous" after the stop is triggered. The goal: to determine how the price affects the emotional state, and vice versa.
🟣 7. Emotional state after closing the deal. Captures the consequences of a decision. For example: "The deal closed with a profit, but I feel empty" → indicates dependence on the result, not on the process.
🟣 8. Was there a violation of the trading plan? yes/no
If "yes", it is mandatory to indicate the type of violation: entering without a signal, changing the stop loss, increasing the lot, holding a losing position, no take profit, trading outside the Kill Zone.
The goal: to connect emotions with specific violations of the rules.
🟣 9. The factor that influenced the emotional state. Indicates an external or internal trigger: a previous loss, someone else's profit on the social network, lack of sleep, FOMC news, lack of a plan for the day ...
Goal: to identify systemic provocateurs of emotional breakdowns.
.......
💡 The second part will be released in a few days .
Leave 🚀, so I'll understand that the topic is interesting to you.
Profit and discipline to all 🪙
Traderlife
XAUUSD3 week continue long on gold after breaking 3500 , it took 3 month around , are we looking for 4000 coming within this month? is gold short or keep up trend.? i am sure everyone have this question in mind.
i have drawed line to understand what could happend as it is an analysis base on education, every price need to be confirmed after breakout and retested with rejection,,, and it take time to predict the direction of the market.
i had a great 3 week. how about you leave your thoughts in the comment.

When Ego Takes Over, Your Account Pays the Price Revenge Trading – When Ego Takes Over, Your Account Pays the Price 💔
Traders, be honest…
How many times have you taken a painful SL, and before you could even breathe, your finger was already clicking “Buy/Sell” without a second thought?
In your head: “I’ll get it back right now… the market can’t do this to me!”
And then…
🔻 A candle goes straight against your position.
🔻 SL beeps again.
🔻 Your account balance drops faster than your mood.
That’s Revenge Trading – it sounds fierce, but in reality, it’s just an emotional storm pulling you further away from shore.
1️⃣ The Sweet but Deadly Psychological Trap
After a loss, your brain refuses to accept reality. It pushes you into the “must recover immediately” mode.
You throw discipline out the window – no setup, no plan.
You increase your lot size recklessly – “Just one win and I’ll be back.”
And… the market doesn’t care if you’re mad or not.
The danger is, at that moment, you’re no longer trading with logic — you’re trading with a wounded ego.
2️⃣ The Downward Spiral
Lose one trade → frustration.
Jump into a revenge trade → bigger lot size.
Lose again → account drains faster.
Emotions spiral out of control → random clicking.
Account blown.
It’s like standing at the edge of a cliff — you could step back and be safe… but you jump, thinking there’s a cushion down there.
3️⃣ How to Cut the Revenge Trading Cycle Before It Eats You Alive
Step away from the charts immediately after a losing streak — go for a walk, exercise, do something unrelated to trading.
Set a daily/weekly loss limit (e.g., -2R) and stick to it.
Journal your emotions after each trade to spot when revenge impulses start creeping in.
Trade smaller when you return — the goal now is to recover your mindset, not your money.
Remind yourself: “The market will always be here. My capital and mental state won’t wait for me.”
4️⃣ MMF’s Note to You
Revenge trading is not strength — it’s weakness in disguise.
It doesn’t help you beat the market; it just helps the market beat you faster.
Keeping a cool head is what keeps a trader alive in the long run.

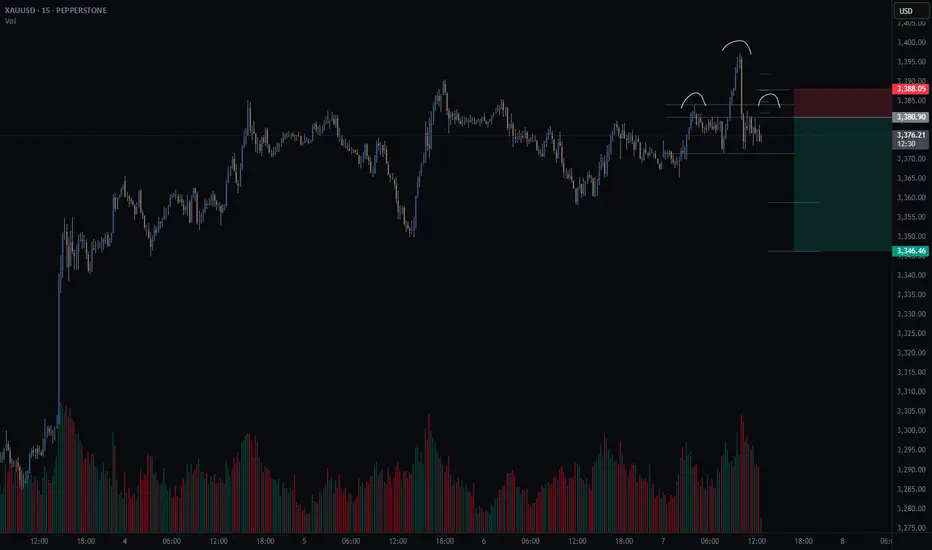
Gold short – Head and Shoulders Setting Up on 15min?There’s a potential head and shoulders pattern forming on the 15-minute chart.
📌 What I’m watching for:
A 15min candle close back inside the neckline range
Lower volume on the right shoulder vs. the left (to confirm weakening momentum)
🧠 Trade Idea (Short bias)
🎯 Entry: 3380.9
❌ Stop Loss: 3388.0
✅ Take Profit 1 (50%): 3358.9
✅ Take Profit 2 (50%): 3346.3
⚖️ Risk/Reward: 3.8R
This setup lines up with my trading method that focuses on structure, volume, and clean risk/reward.
🤔 What are your thoughts on gold today?
Are we about to roll over — or will bulls push through resistance?
Waiting for market structure to become more obvious Hello friends, hope you are well
On the higher time frames, there seems to be a little work that needs to be done
On the lower timeframes we are DOMINATING
If you'd like to be a front runner, speak to me and lets do this!
#MarketDomination
#TradingSuccess
#TimeframeAnalysis
#TradeSmart
#FrontRunner
#MarketOpportunities
#CryptoJourney
#WinningTrades
#HigherTimeframes
#LowerTimeframes
#TradingStrategies
#ProfitPursuit
#FinancialFreedom
#MarketMoves
#TradeWithConfidence
#UnlockSuccess
#TraderLife
#CrushTheMarket
#LetsDoThis
#DominateTheCharts

Live from the crypto cave TeddyTrader! 🖥️ My setup: tracking market moves 24/7. Here’s how it works: 📊
⬛️ Left Screen: Real-time order flow from a combined chart of three major exchanges to catch big capital moves and clusters of Bid/Ask orders.
⬛️ Center Screen: In-depth on-chain and social analytics to gauge sentiment, activity, and key market behaviors.
⬛️ Right Screen: Advanced charting tools for detailed technical analysis, using specialized indicators and candlestick models to forecast price direction.
🔑 The secret to a reliable price direction analysis at 65% accuracy lies in these tools. Sorry for the photo skills, I’m better at trading! 🤣
Disclaimer: Content for seasoned traders only. Not financial advice. You bear sole responsibility for trading outcomes. ➖ DYOR 🧠 💡


EUR/GBP Cypher formation 1 HR (Sniper price action) strategy
On the EUR.GBP 1hr chart we have a potential short opportunity at the D leg completion of bearish Cypher setup.
The price reversal zone on this pair is between .8519 & .8577
The PRZ zone is only a guideline of where we will be paying attention for trade setups and opportunity's.
Potential targets for the Cypher setup placed at the .382% and .618% retracement of the C to D move.
There is also opportunity to look for extended targets at around .8328
Stop loss would be placed above X leg structure resistance.
Target 1 - .8436
Target 2 - .8384

XAUUSD looking for shortsCurrently watching price retrace after being a heavy downtrend. Looking for further downside. Intra day position.


EURUSD - full analysis the EUR is now weaker than the USD, price has broken its weekly zone and now we have exhaustion back to that zone, now we are waiting for entry confirmation for a sell to our daily zone

$SHLS is giving a GREAT IPO LONG opportunity todayIPO intraday trading strategy idea
Shoals Technologies Group is a leading provider of electrical balance of system or “EBOS” solutions for solar energy projects in the United States.
The share price is rising and gonna continue this trend today.
The demand for shares of the company still looks higher than the supply.
These and other conditions can cause a rise in the share price today.
So I opened a long position from $32,00;
stop-loss — $30,25;
take-profit — 37,25/MOC price.
Do not view this idea as a recommendation for trading or investing. It is published only to introduce my own vision.
Always do your own analysis before making deals. When you use any materials, do not rely on blind trust.
You should remember that isolated deals do not give systematic profit, so trade/invest using a developed strategy.
If you like my content, you can subscribe to the news and receive my fresh ideas.


Possible GBP/JPY Scenario, via 4 Hr ChartAs we can see, price has broken out of December's descending trend line. Price eventually found support at 142.940. Right now, it's in a small bullish flag. If price breaks out of that flag, it shall go further til it reaches that level of supply. Will it show rejection from that supply level or break out and retest that level?

GOLD LONG SETUP INCOMING / 2019 ENDRALLYGoing to 1700 / It is a easy long setup with really small risk! I Hope the dream is coming! :)


LNG, Cheniere Energy Inc. - Breakout or Rebound?AMEX:LNG
Did you set the alerts? What do you do on level 70? Do you have a clear strategy? Trading is mathematical and if you understand your way of trading you may achieve financial freedom.

THIS IS LOOKING GOOD, I'VE BEEN WAITING...looks like we're going for a run today, volume has been healthy for the past few days

Analysis on Google 6.06.2018The price above 200 MA, indicating a growing trend.
The MACD histogram is above the zero line.
The oscillator Force Index is above the zero line.
If the level of resistance is broken, you should follow recommendations below:
• Timeframe: H4
• Recommendation: Long Position
• Entry Level: Long Position 1145.00
• Take Profit Level: 1160.00 (1500 pips)
If the price rebound from resistance level, you should follow recommendations below:
• Timeframe: H4
• Recommendation: Short Position
• Entry Level: Short Position 1130.00
• Take Profit Level: 1128.00 (200 pips)

Is the Bull run over for EUR/USD?!?!OANDA:EURUSD has shown a weak dollar for the majority of 2017 but are we near a switch in the current trend? or is it just a medium term move to allow some steam off?
For the time being we have a Bearish Head & Shoulders formation in which we're awaiting the right shoulder to form. We also have heavy bearish divergence on the momentum indicator as you can see with the Red arrow on the chart.
This week we had a slight decrease in the institutional bullish sentiment which adds up more evidence to our case.
We have NFP on friday therefore there is a high chance we wont take a trade until then to make sure we're on the right side or at least the most probable side.
Safe Trading!!

Gold fails second re-test of new high and opens downsideGold has double topped at the last lower high and while I am skeptical of a sell right now given the USD index is falling there should be caution when taking a long position.
We need a higher close above the lower high to safely buy into Gold which may come later in today's session, otherwise if the USD index re-bounds (see linked trade analysis) we could short gold to the previous higher low at 1312.00.

GOLD(Monthly) Decision Time
Everyone is Busy with Daily and Hourly charts,So I have stepped back and trying to shed some light on Monthly as it is at a very Crucial Decision point.
Falling Trend line from all time Highs we hit in 2011 is here to decide the faith of Gold ;)
Short Term Correction at least to $1200 is expected in coming month or two, it may not come in light of some Big Global Risk event.
Big Supply zone at $1500 - $1600 which is also a important Fib level.
Best Demand Zone from a Decade perspective is lying at $980 - $890 which again is a important fib level.
Medium Term Traders Look to Buy around $1200 levels and look for break of the falling trend line.
Long Term Investors should Buy around the marked Demand Zone as it will offer them best risk to reward ratio.
I hope i have not disappointed anyone neither Bulls Nor Bears :) I have something for everyone ;)
Take Care
