$GOLD - Yellowstone's Shine'Our TVC:GOLD is no longer safe in the Fed’s vaults’
“Given the current geopolitical situation, it seems risky to store so much TVC:GOLD in the U.S” “In the interest of greater strategic independence from the US, the Bundesbank would therefore be well advised to consider repatriating the $Gold.
- leading economist and former Bundesbank head of research Emanuel Mönch told the German press on Friday.
TVC:GOLD loving uncertainty printed a New All Time High during Asian Session (26/1/2026) ;
defeating swiftly the 5.000$ per troy ounce psychological benchmark.
Seems like every pull back seen on TVC:GOLD 's charts,
is another great opportunity to BUY.
Firmly based on a large scale of structural demand purposes for TVC:GOLD ,
vastly noting the accumulation phase of Central Banks and Sovreings States since 2008 Financial Crisis;
People’s Bank of China ECONOMICS:CNGRES remains a steady long-term buyer, adding TVC:GOLD monthly even amid record prices, out-pacing $USGRESUnited States, ECONOMICS:GBGRES United Kingdom, ECONOMICS:EUGRES European Union as a whole and ECONOMICS:CHGRES Switzerland .
So has done Russia ECONOMICS:RUGRES , Japan ECONOMICS:JPGRES , ECONOMICS:PLGRES Poland and Germany ECONOMICS:DEGRES .
However, current uptrend isn't soly supported by a long accumulation phase past 2008 Financial Crisis.
Tariffs threats of Donald Trump towards China, Canada, South-Korea have spooked investors, trying to hedge on the yellowstone against trade-wars.
Geo-Politics have been popping up on consistent basis ever since Russia-Ukraine war took place on 202;
while lately conflicts brewing with U.S and Venezuela, Iran, and tensions between Greenland take over which has troubled the European Union and NATO.
Also a shunning TVC:DXY and a troubled-policy driven currency like Japanese-Yen are losing strength as an hedge.
Their appeal being dimmed can be found at how Commercial and Central Banks have been adding up on their TVC:GOLD reserves like never before.
With TVC:GOLD and TVC:SILVER prices increasing fast,
seems like retailers have a low probability to accumulate as much as they wish to do so on lower prices.
Wether you're a Spot buyer or a CFD trader, is not smart to counter-trend against precious metals.
While many wondering where the top is, forecasts of big players varies from 5.500$/oz to 7.000$ by end year of 2026.
What's important seeking out is not the peak or the bottom, but rather focusing on what price levels will be for the next pro-longed accumulation phase that shall follow when Geo-Politics uncertainty comes to an end and a more positive stabilization of TVC:DXY and other macro-economics factors such as Interest Rates and Inflation.
Tradewar

Nasdaq crashes but recovering: Buy the dip or sell the break?The NASDAQ has taken a serious hit, dropping 1.6% to test 25,280 after failing to break the double top at 25,900. The market is caught in a crossfire of 25% AI chip tariffs, China export bans, and tensions in Iran. But technically, we might be forming an ascending triangle that suggests a breakout to 27,500 is still possible.
Read as we analyse the clash between bearish headlines—US-China escalation and the Iran crisis—and bullish technicals. We break down the ascending triangle pattern with higher lows at 23,860, 24,660, and now 25,170, and explain why the 50 RSI reset on the daily chart could signal a perfect "buy the dip" opportunity.
Key topics covered:
Trade war escalation: How 25% tariffs on AI chips and China’s retaliatory bans on dual-use items and cybersecurity companies are hitting tech giants.
Iran tensions: The impact of Trump's remarks and their effect on investor confidence and "risk-off" sentiment.
Technical setup: The critical ascending triangle formation. A hold at 25,200 keeps the bullish bias alive for a measured move to 27,500 (100% Fib extension).
Two scenarios:
Bullish : De-escalation in Iran/trade war + triangle hold = breakout to 26,500 and 27,500.
Bearish : Escalation + break below 25,200 = failure of the triangle, targeting 24,650 and lower.
Are you buying the triangle dip or shorting the double top? Let us know in the comments!
This content is not directed to residents of the EU or UK. Any opinions, news, research, analyses, prices or other information contained on this website is provided as general market commentary and does not constitute investment advice. ThinkMarkets will not accept liability for any loss or damage including, without limitation, to any loss of profit which may arise directly or indirectly from use of or reliance on such information.

USD/CAD: Will the Great Divergence Break the Greenback?The financial world stands on the precipice of a defining moment for North American currency markets. The USD/CAD pair hovers near 1.3855, ticking nervously as traders count down to a rare double-header of central bank decisions. December 10, 2025, marks a pivotal divergence point where economic pathways between the United States and Canada split sharply. This is not merely a technical adjustment; it is a fundamental collision of monetary policy, geopolitical strategy, and industrial resilience. The outcome will likely dictate the Loonie’s trajectory for the coming year.
Macroeconomics: A Tale of Two Trajectories
The macroeconomic landscape reveals a stark contrast between the two nations. The Federal Reserve prepares to slash interest rates for the third consecutive time, targeting a range of 3.50%-3.75%. Markets price this move at nearly 88% probability. The US labor market displays clear signs of cooling, necessitating easier financing conditions to prevent a recession. Conversely, the Bank of Canada (BoC) stands firm. Canada’s economy defied expectations with a robust 2.6% annualized GDP growth in Q3, crushing earlier forecasts. This resilience compels the BoC to hold rates at 2.25% to prevent reigniting inflation, which remains sticky at 2.2%.
Geostrategy: The Fertilizer Chess Game
Beyond interest rates, a high-stakes geopolitical trade war complicates currency valuation. The US administration’s threat of severe tariffs on Canadian fertilizer imports paradoxically jeopardizes US food security. American farmers rely heavily on Canadian potash, importing over half of Canada’s production. Tariffs here act as a double-edged sword: they aim to punish Canada but simultaneously drive up input costs for the US agricultural sector. This strategic misstep weakens the US Dollar’s purchasing power domestically while forcing the administration to print subsidies, further diluting the currency.
Industry Trends: Agriculture Under Siege
The agricultural industry sits at the epicenter of this financial storm. The promise of $12 billion in aid to US farmers highlights the structural damage already inflicted by trade barriers. This subsidy model creates a vicious cycle of dependency rather than innovation. While Canadian fertilizer producers face tariff headwinds, their product remains essential, granting them significant pricing power. US farmers face a "margin squeeze" that ripples through the broader economy, softening the US economic outlook and diminishing the appeal of the Greenback relative to the resource-backed Loonie.
Management & Leadership: Powell vs. Macklem
Leadership styles at the central banks further amplify market volatility. Fed Chair Jerome Powell operates under intense political pressure and conflicting data, forcing a reactionary "data-dependent" approach. His leadership currently signals caution and retreat. In contrast, BoC Governor Tiff Macklem displays a steady hand, anchoring policy to tangible growth metrics like the recent 180.6K job surge. This stability in Canadian monetary leadership attracts foreign capital seeking predictable returns, creating a natural demand for the Canadian Dollar over the politically volatile USD.
Business Models: Supply Chain Resilience
The trade dispute forces companies to rethink business models. Canadian exporters are diversifying markets beyond the US, strengthening long-term resilience. Meanwhile, US importers face a supply chain crisis, unable to quickly source alternative fertilizer at competitive rates. This rigidity in the US supply chain exposes a critical weakness in the American business model for agriculture. Investors recognize this structural flaw, leading to capital flows that favor the adaptability of the Canadian export sector, thereby supporting the CAD against the USD.
Conclusion: The Loonie’s Rebellion
The confluence of diverging interest rates and self-inflicted US trade wounds creates a perfect storm for USD/CAD bears. The Federal Reserve’s dovish pivot contrasts sharply with the Bank of Canada’s confident hold, widening the yield spread in favor of Canadian assets. Combined with the strategic failure of fertilizer tariffs, fundamental drivers point toward a weaker US Dollar. Traders must watch the 1.3850 level closely; a break below likely signals the start of a prolonged downtrend for the pair. The divergence is real, and the Loonie is ready to rebel.

SPX | Daily Analysis #10 - 3 November 2025Hello and Welcome Back to DP,
Review & News Coverage:
Since our last SPX analysis, we mentioned that a broken trendline could open the door for downside movement. As we can see on the chart, the index fell toward the 1.68 Fibonacci zone before bouncing back.
This drop created about $44 of volatility — hopefully, you managed to catch that move! We had highlighted the 6811 area as a potential buy zone, and indeed, that level opened an opportunity for entries (I personally missed it since I needed more confirmation, but I hope some of you caught it).
From both the economic and political sides, several developments could shape SPX sentiment and direction:
Economic Calendar:
Monday: ISM Manufacturing PMI
Wednesday: ADP Non-Farm Employment Change & ISM Services PMI
Friday: Tentative Unemployment Rate
Stronger-than-expected data could strengthen the dollar and weigh on equities, while weaker readings may support a rebound if markets price in potential rate relief.
Political Landscape:
Watch for new announcements on funding negotiations or relief measures — any progress (or setback) in the government-shutdown talks could move markets.
The U.S. government shutdown remains a risk factor, with pressure building from expiring healthcare tax credits and food assistance programs.
And most importantly — keep an eye on “Trump’s Indicator” (his posts or tweets). His remarks often create sharp, short-term volatility across indices and sectors.
1H - 4H Technical Analysis:
On the charts, the SPX is struggling to regain upward momentum.
If price breaks the intraday trendline, room opens for a move down toward 6844 and 6829.
If those zones show strong volume and bullish candle patterns, we could look for buy entries around that range.
The key is to wait for confirmation — volume support and candle behavior will guide whether the market finds its footing or continues to slide.
Summary:
Short-term tone remains cautiously bullish while above 6811, but pressure remains from macro and political uncertainty.
Watch mid-week data and political headlines for volatility spikes.
Technical zones: Support 6829–6811, Resistance 6895–6920 (potential retest if sentiment turns).
Disclaimer:
This content is for informational purposes only and does not constitute financial or investment advice. © DIBAPRISM
Amir D.Kohn

Soybeans Surge on Thin Ice: Lessons from 2019Soybean prices have surged nearly 8% in two weeks, driven by renewed US-China trade tensions. While this looks like a familiar, event-driven rally, the fundamentals tell a different story.
Conflicting Weak Fundamentals
China has not purchased any US soybeans for the 2025/26 marketing year. In 2024/25, Chinese buying stalled after May. That’s unusual given that the prior year saw over 500,000 tons of late-season sales. The slowdown dropped China’s share of total US soybean commitments to 45% from 55%, the lowest since 2018.
Source – Reuters
That matters because 2018 marked the last time soybeans became a trade weapon. Back then, US soybean exports fell 18% from 2017/18 to 2018/19 despite record production. Exports recovered briefly in 2020-21 but have since declined again. If history rhymes, the 2025 conflict could have longer-term consequences for US producers and exporters.
The puzzle is that prices have climbed despite worsening fundamentals. Futures rose after the latest escalation, hinting that traders may be pricing in an eventual resolution. If tensions ease before the seasonal export peak over the next two months, demand could lift prices further. If not, the current rally may prove unsustainable. The key uncertainty lies in timing - whether a diplomatic thaw comes soon enough to coincide with US export strength.
Source – Kansas City Fed
Performance and Parallels with 2019
The structure of this year’s rally mirrors the 2019 pattern. Then, too, optimism around US-China negotiations drove soybean futures higher. On 13 December 2019, as the Phase-One trade deal was announced, CBOT soybean futures rallied about 9.8% for the month. That uptrend persisted until the onset of COVID-19, which derailed demand and disrupted logistics, preventing the expected rebound in US exports.
The technical setup also echoes that period. In both 2019 and 2025, the Relative Strength Index (RSI) crossed into overbought territory above 70-a rare signal under normal conditions. Between 2020 and 2022, RSI readings were inflated by one-off global shocks. In contrast, the 2019 and 2025 spikes both stem from optimism around de-escalation, underscoring how trade détente tends to trigger strong momentum buying.
Today, market sentiment again hinges on reports that China may resume US soybean purchases. Investors are reacting to statements and commentary including remarks from industry figures suggesting Beijing could pivot back toward US supply as signs that tariffs or import restrictions may soften. If these expectations materialize, the rally could extend into early 2026, though the fundamental picture remains weak.
Historical Trade Example
To illustrate how optimism-driven price spikes have historically translated into trade outcomes, consider the 2019 example.
A trader buying one CBOT soybean futures contract (5,000 bushels) at $8.70 per bushel in early December and exiting at $9.50 in early January would have captured a 9% gain.
Entry: 870 cents/bushel
Exit: 950 cents/bushel
Profit/Loss: 80 cents/bushel = USD 0.8/bushel
Each contract of Soybean futures provides exposure to 5000 bushels:
Profit/Loss per Contract = 0.8 x 5000 = USD 4,000
Traders can express the same view using CME Micro Soybean Futures, which provide exposure to one-tenth of the standard contract’s notional value and require lower margin.
The 2025 setup resembles that pattern. If de-escalation signs strengthen into year-end, a similar short-term momentum trade could play out. However, if diplomatic talks stall or China delays purchases, prices could quickly retrace.
The recent rally has also occurred on low trading volume, with limited activity during the upward move and higher volume concentrated near resistance levels. Additionally, the price action around these resistance levels shows long wicks, suggesting a failed breakout and indicating weak momentum.
In essence, this rally is speculative optimism priced into a weak fundamental base. For traders, it is a short-duration opportunity with defined risk: the thesis hinges on improved trade headlines within the next two months. For producers and longer-term investors, the focus should remain on export commitments and Chinese buying patterns rather than short-lived technical surges.
History suggests that while geopolitical relief rallies can deliver sharp gains, they often fade once the narrative loses momentum. The 2025 soybean rally may yet prove another example of that cycle - strong on hope, but fragile on fundamentals.
This content is sponsored.
MARKET DATA
CME Real-time Market Data helps identify trading set-ups and express market views better. If you have futures in your trading portfolio, you can check out on CME Group data plans available that suit your trading needs tradingview.com/cme .
DISCLAIMER
This case study is for educational purposes only and does not constitute investment recommendations or advice. Nor are they used to promote any specific products, or services.
Trading or investment ideas cited here are for illustration only, as an integral part of a case study to demonstrate the fundamental concepts in risk management or trading under the market scenarios being discussed. Please read the FULL DISCLAIMER the link to which is provided in our profile description.

GOLD | Daily Analysis #2 - 30 October 2025Hello and welcome back to DP,
Review and news:
Yesterday Gold pulled back slightly from recent highs after strong run-up. According to FXTrendo, it had briefly topped the psychological US$4,000/oz level, then traded around ~US$3,995. Expectations that the Federal Reserve might cut interest rates later this year remain a tailwind, which helps non-yielding assets like gold. Geopolitical uncertainties and safe-haven demand continue to underpin gold’s appeal. In summery gold remains structurally bullish, but near-term momentum is under pressure. The market is in a consolidation/correction phase while waiting for the next catalyst (Fed clarity, inflation prints, major geopolitical event).
1H – 4H Technical Analysis:
As you can observe, the major downtrend broke, the upside moving is feuled up. Demand zones are strong and 3914 zone is still irony. So if price pass and break 4024 area, there is potential to uptrend goes continuously. With analyzing the support and resistance zones, these scenarios are possible: Bearish scenario: If gold fails to reclaim the resistance zone (~4,000 +), and breaks below short-term support (~3,940), then a deeper retracement toward ~3,900 or lower becomes more likely. Bullish scenario: If gold holds above ~3,940-3,900 and the Fed or external shock triggers safe-haven flows, a move back toward ~4,050-4,100 is possible. Neutral to caution: Given the mixed signals (strong overall trend but short-term pullback), many traders may prefer to wait for confirmation (e.g., breakout above resistance or a clean bounce off support) rather than aggressively chase.
Disclaimer:
This content is for informational purposes only and does not constitute financial or investment advice. © DIBAPRISM
Amir D.Kohn

SPX | Daily Analysis #9 - 30 October 2025Hello and welcome back to DP,
Market Review:
Well, yesterday was a significant day across global markets — from U.S. stock indexes to crypto assets — with investors digesting major developments from the Federal Reserve and the renewed U.S.–China trade dialogue. The yesterday’s market summery:
- Monetary policy / central bank: The Fed’s decision to cut interest rates by 25 basis points (as expected) was overshadowed by Powell’s cautious tone about future cuts. However, optimism was tempered by comments from Jerome Powell indicating that another rate cut in December is not guaranteed. That caused some caution in the market.
- S&P 500: 6,890.59 (down ~0.30 points). Dow Jones Industrial Average: 47,632.00 (down ~74.37 points, ~0.2%). Nasdaq Composite: 23,958.47 (up ~130.98 points, ~0.5%).One of the biggest drivers: Nvidia Corporation became the first public company to reach a roughly $5 trillion market valuation, boosting the tech segment.
- Trade & geopolitics: The U.S. signalled progress in trade and industrial policy with China: comments from Donald Trump hinted at easing of some tariffs (e.g., on fentanyl-related goods) and possible cooperation on rare-earth export controls. The U.S. will reduce some tariffs on Chinese goods: for example, tariff on certain chemicals tied to fentanyl production will go from 20 % down to 10 %, and overall U.S. duties on Chinese imports shift from ~57 % to ~47 %. China agreed to resume more agricultural purchases from the U.S. (e.g., soybeans, sorghum) and to postpone export restrictions on rare earth materials for about one year.
- And for watching ahead is earnings: Big names like Apple Inc. (AAPL) and Amazon .com Inc. (AMZN) are due after market close, which could influence the market.
- The overall crypto market cap held steady near $3.2 trillion, with sentiment described as “risk-on, but wary.”
1H – 4H Technical Analysis:
As observed on the chart, price has broken below the bullish trend line and moved through yesterday’s key demand zone, signaling a potential shift in short-term momentum.
Currently, the price is declining, approaching lower demand areas. As of this analysis, SPX is retracing and may find temporary support around the 6,842 level, where a short-term rebound toward 6,877 is possible before the next move unfolds.
However, if bullish momentum fails to hold above that level, a drop through the gap zone could follow, pushing price action toward the 6,810 support region, which aligns with the next major demand zone on the 4-hour chart. This zone may serve as a stronger accumulation area for potential medium-term buyers.
From a broader perspective, the recent U.S.–China trade truce provides a fundamental tailwind for the market — a bullish catalyst that could limit downside extensions and support sentiment in the coming sessions.
It’s also notable that the S&P 500’s annual return now stands near +16 %, compared with roughly +24 % two years ago. This suggests that while growth has moderated, there remains room for further upside if macro conditions stay supportive and earnings momentum continues.
Disclaimer:
This content is for informational purposes only and does not constitute financial or investment advice. © DIBAPRISM
Amir D.Kohn

SPX | Daily Analysis #7 - 27 October 2025Hello and welcome back to DP Weekly Market Review,
Past Week Overview:
The past week saw a strong inflow of volume from investors optimistic about a market rebound, following the sharp two-week decline driven by renewed U.S.–China trade tensions. The S&P 500 initially showed a K-shaped reaction, but buyers quickly stepped in, pushing prices higher. By Friday, the market not only recovered but also broke above the previous high, setting a new record.
On Sunday, Treasury Secretary Bessent announced that the U.S. and China are ready to reach a trade agreement. This news fueled bullish sentiment in the Asian session, causing a major gap-up in the markets, with the index opening around the 6,850 zone.
Week Ahead:
This week stands as one of the most critical of the quarter for global markets.
Federal Reserve Decision: All eyes are on the Fed’s rate announcement—whether they hike, cut, or hold. Every word from Chair Powell regarding “soft landing,” “inflation progress,” or “economic resilience” could move global markets sharply.
Tech Earnings Season: The “Tech Titans” — Apple, Microsoft, Meta, Amazon, and Google — report their earnings this week. These giants collectively account for around 35% of the Nasdaq’s total weight.
U.S.–China Relations: President Trump is expected to meet President Xi for the first time in his second term, with trade tensions still in the background.
1H – 4H Technical Outlook:
As shown on the chart, the market opened with a large bullish gap. Some short-term traders anticipate a pullback to fill the gap, which could push prices down toward the 6,800 area. However, a sustained move above 6,860 may signal further bullish momentum toward the upside.
Trading Strategy:
For now, patience is key — let the market reveal its reaction around key price zones before entering new positions.
Disclaimer:
This content is for informational purposes only and does not constitute financial or investment advice. © DIBAPRISM
Amir D.Kohn

Gold suffers biggest crash since 2013: What’s next for metal?Gold just experienced its worst single-day crash since 2013, plunging over 8% from record highs after forming a double top.
What’s behind this dramatic move, and what’s next for gold?
After a strong rally driven by fiscal and trade uncertainty and delayed US economic data, gold suddenly tumbled to the $4,000s. This sharp drop comes amid technical overextension and ahead of a crucial US CPI report due Friday, with the government shutdown still adding to market uncertainty.
Overextended : Gold was heavily overbought on multiple timeframes (4-hour, daily, weekly, monthly), with a double top and weakening RSI signalling a correction was due.
Profit-taking ahead of CPI : Many traders secured profits before Friday’s CPI report, with consensus expecting inflation to tick up, potentially impacting Fed rate expectations and the US dollar.
Trade developments : De-escalation between the US and China, with Trump and Xi set to meet at APEC, reduced some risk premium that had supported gold.
Support and scenarios : Strong support levels remain, with a possible further downside to the 38.2% Fibonacci retracement (~$3,945), but a deeper drop to $3,735 is seen as unlikely unless catalysts turn more bearish.
Volatility is back in the gold market! Will this correction turn into a longer consolidation, or is it just a pause before new highs?
Watch the key levels and upcoming CPI data, and remember—trade smart, respect your risk, and cash out when needed!
This content is not directed to residents of the EU or UK. Any opinions, news, research, analyses, prices or other information contained on this website is provided as general market commentary and does not constitute investment advice. ThinkMarkets will not accept liability for any loss or damage including, without limitation, to any loss of profit which may arise directly or indirectly from use of or reliance on such information.

SPX | DAILY ANALYSIS #6Hello and welcome back to DP.
Let’s kick off the weekday together by analyzing the **S&P 500 Index (SPX)**.
🟠 Market Overview
Previous Close: 6692.50
Current Daily Range: 6678.00 – 6705.80
Asia Session High: 6705.80
Asia Session Low: 6678.00
The index has seen significant selling pressure over the past week. She broke below the previous demand zone at 6715–6700, forming a new demand zone between 6680–6665.
This could suggest:
* Sellers are gaining momentum, OR
* Short positions were liquidated to make room for new entries.
🔵 Key Levels to Watch
Resistance Zone (Upside Target):
6711 – A break and hold above this level could lead to a test of 6735 and potentially new highs near 6755.
Support Zone (Blue Box):
6680 – 6665 – This is a critical support zone.
If broken, we may see the index fall toward:
First Support (Yellow Box): 6645
Deeper Support Zone: 6620 – 6605
If the 6680 zone holds and we see bullish confirmation (e.g., strong buying wicks, volume spike, or bullish engulfing candle), buyers may regain control and push the price back up toward the 6710–6730 range.
🧠 Trading Outlook
Bullish Bias Above: 6711
Bearish Bias Below: 6680
Neutral Zone: 6680–6710 (watch for consolidation or fakeouts)
📌 Note: The current structure suggests we are at a decision point. Be patient, wait for confirmation, and manage your risk accordingly.
Take care and have a great trading day!
For informational purposes only – not financial advice. © DIBAPRISM
Amir D. Kohn

SPX | Daily Analysis #5Hello and welcome back to DP,
**Yesterday’s Review and News**
In the previous trading day, the market experienced fluctuations of approximately $118. It initially climbed during the Asian and London sessions. However, during the New York session, the market showed significant downward movement, breaking key support levels and trend lines.
Regarding news, the most notable event was the phone call between Trump and Putin, with a scheduled meeting to discuss the Ukraine conflict. The price approached the 6720 level, but sellers prevented the index from reaching and breaking the last pivot point, causing a sharp decline. The price broke through the important candle we mentioned earlier and eventually stopped at 6540.
**1H – 4H Time Frame**
Today, the market showed weakness during the Asian session (breaking the previously mentioned candle) and the early London session. However, by mid-day in London, the price found support and began moving upward. If buyers maintain this support, the price could potentially reach the 6700 level.
**Trade Idea**
At this time, the best strategy is to wait for the price to approach the 6700 area and then consider selling the index to target lower levels.
- For informational purposes only – not financial advice. © DIBAPRISM -
Issued: Amir D. Kohn

USDCHF 10-year support points to major breakdown to 0.70! USDCHF BREAKDOWN ALERT: Decade-long support shattered – here's why this could be the start of a major move to 0.70 and below!
The Dollar-Swiss Franc pair is setting up for a potentially significant breakdown after breaking decade-long support levels since May. Both fundamental and technical factors are aligning for Swiss franc strength, creating what could be a rare high-probability trading opportunity.
Key Drivers:
Fed Dovish Pivot: Powell's Tuesday signal acknowledged downside risks to job markets, with 97% probability of October rate cuts and two more by December fully priced in
Swiss Franc Strength: CHF has strengthened nearly 9% over the past 12 months, now testing the 0.78 level, while Trump's tariff escalation forces Switzerland to slash GDP forecasts
Technical Breakdown: Multiple analytical methods (range breakouts, Fibonacci projections, and triangle pattern analysis) all point to targets around 0.7417-0.6840, representing potential moves to levels not seen since 2011
SNB Constraints: The Swiss National Bank cannot intervene in forex markets while trade talks are ongoing, meaning the Franc is likely to stay strong by default, with stable inflation data
Don't miss this detailed technical and fundamental breakdown! Like and subscribe for more high-probability forex setups, and drop a comment below with your USD/CHF targets - are you seeing the same bearish signals?
This content is not directed to residents of the EU or UK. Any opinions, news, research, analyses, prices or other information contained on this website is provided as general market commentary and does not constitute investment advice. ThinkMarkets will not accept liability for any loss or damage including, without limitation, to any loss of profit which may arise directly or indirectly from use of or reliance on such information.

SPX | Daily Analysis #4 Hello and welcome back to DP,
**Review and News**
Yesterday, the index experienced a $150 intraday fluctuation and closed in the green. As mentioned in a previous post, we noted that "if the price breaks the 6682 zone, the index could extend towards the 6720 area." As illustrated in the chart, the market responded to this price range and dropped towards the 6620 zone. However, in a significant move, buyers outperformed sellers, pushing the price back to the 6681 zone. This move is noteworthy as it indicates that the market shows more potential for upward movement rather than a downward move. It’s also important to note that, in the final moments before market closure, President Trump tweeted: "The USA is officially in a trade war with China."
**1-Hour and 4-Hour Time Frame Price Action**
As depicted in the chart, the formation of higher highs (HH) and higher lows (HL) suggests that the market is struggling to regain gains and recover from its previous record highs. The significant candlestick shows that buyers have a strong presence and are willing to push the price higher. However, if the price dips below this candlestick, the index could move lower, potentially benefiting short sellers. That being said, I don’t believe this will happen. In my opinion, many retail traders are hoping for a larger price drop, but based on market behavior, this could be a trap for sellers. Therefore, I anticipate a potential upward move and a recovery of last Friday’s losses within this week.
**Trend Analysis**
While I’m unable to display my trend analysis chart here, as mentioned previously, the price tested the 4-hour trend line (with the first trend line originating from February 25, 2025, and the second starting from August 12, 2025). The price then made a significant move, breaking through the upper trend line.
**Trade Ideas**
1. If the price falls through the 6681 zone and confirms the break, consider entering a buy position at the last high.
2. If the price declines with high volume (possibly triggered by news) through the 6617 area and breaks this zone strongly, a cautious sell position can be considered, with two take-profit levels on the way down.
3. Based on the 4-hour trend line, a buy position could be considered if the price falls and approaches the trend line again (around the 6630 area).
**Disclaimer**
These notes and trade ideas are for informational purposes only and do not constitute financial advice.
*Issued by: A. Diba Kohn*

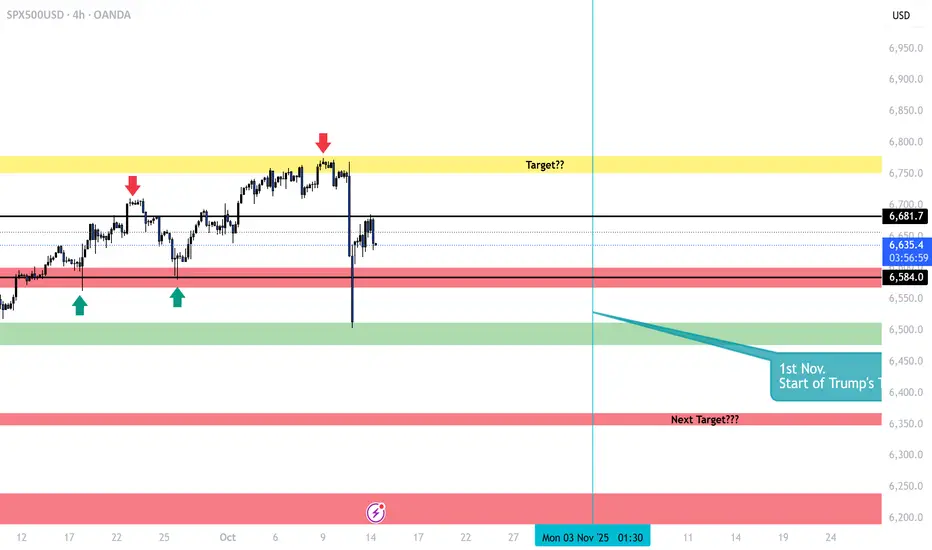
SPX500USD | Daily Analysis #3**Yesterday Review**
As observed, the index reacted to the 6682 zone, and news from China stating, "China will maintain tariffs until the end," fueled the market with sellers, pushing the price to the lower zone at 6584. In the morning of the New York session, it appeared that Trump realized the importance of offering a positive signal or message, or the index would suffer significantly. After a strong battle between buyers and sellers on the 1-hour timeframe, the price began to rise, driven by buying pressure.
During the middle of the New York session, Trump found an opportunity to provide some optimism, announcing a scheduled meeting with Chinese President Xi in South Korea on November 1st to discuss trade matters. (This could be a significant day.) This news contributed to a bounce, pushing the price back up to 6682.
**1-Hour & 4-Hour Timeframes**
On the 1-hour timeframe, two potential patterns are forming. One is a box range between 6682 and 6585, and the other is an upward trend channel. However, neither pattern is fully respected due to limited confirmation.
On the 4-hour timeframe (although I cannot share an image here), if you draw two lines—one starting from February 25, 2025, and the other from August 12, 2025—and extend them to the right, you'll notice a clear respect and relationship between these lines.
**Current Situation**
As of the time I am posting this analysis, the price is currently testing below the trendline, and we are awaiting a reaction. If the index, with or without further news, breaks the 6682 zone or the trendline strongly, we could expect the price to reach the 6672 zone. On the other hand, if the price respects the box or the upward trend channel, the index may find support and rise toward the 6604 area.

AUDUSD breakdown:Hidden oppportunity while Gold grabs headlines?While everyone's watching gold hit fresh records after Trump's China tariff threats, there's an overlooked opportunity in AUDUSD that could be setting up for a major breakdown.
The Australian dollar just broke key support at 0.6520 against the USD, creating a fundamental and technical alignment for further downside. With Australia sending 63% of its exports to China, any trade war escalation directly impacts the Aussie dollar.
Key Drivers:
Trade War Impact : Australia's heavy dependence on China makes AUD vulnerable to US-China trade war escalation
Technical Breakdown : Break below 0.6520 support with Fibonacci targets at 0.6443, 0.6311, and 0.6254
Dollar Strength : Government shutdown paradoxically supports USD strength by removing spending and debt payments from the equation
RSI Momentum : RSI shows room for further decline with potential head and shoulders pattern forming, targeting the neckline first
This macro/technical alignment presents a strong trading setup. When others chase gold headlines, smart traders can position for the AUD breakdown. Trade smart, respect the levels, and don't miss this overlooked opportunity.
This content is not directed to residents of the EU or UK. Any opinions, news, research, analyses, prices or other information contained on this website is provided as general market commentary and does not constitute investment advice. ThinkMarkets will not accept liability for any loss or damage including, without limitation, to any loss of profit which may arise directly or indirectly from use of or reliance on such information.

SPX | Daily Analysis #2Hello and welcome back to DP,
**Review and News**
Yesterday, at the start of the week, the SPX opened with a significant upside gap, largely driven by a tweet from former President Trump on Friday. His statement—"Don’t worry about China and Xi, they don’t want a recession for their economy, and neither do we"—helped restore investor confidence, pushing them back into the market, particularly into this index. However, shortly after, Trump reiterated that tariffs would still be implemented on November 1st, which is expected to have a considerable impact.
This morning, President Xi reaffirmed his stance, saying, "China will fight to the end, but the doors for negotiation are always open." As seen on the chart, the price has moved within a range between $6,681 and $6,584.
**4-Hour Price Action**
As indicated by the chart, the price range between $6,681 and $6,584 seems to be holding steady for now. One scenario suggests the market is in a consolidation phase. The shape of this consolidation will depend on the future performance of the market. It could either form a diagonal pattern or remain within a box range, as investors battle against short-sellers.
Using Fibonacci retracement, it appears the price may extend to the 0.236 line at $6,706. If this Fibonacci level holds, the market could face a downturn, potentially targeting the next support level indicated by the red box below the chart.
**Trend Analysis**
As shown, the trend illustrates a clear relationship with price movement. The price opened above the trend line, then expanded below the next trend level, showing respect for it. This movement suggests that downward pressure remains, with the market's direction depending on the break of the current trend line.
Personally , I believe the market may head south, but it won’t be a straightforward move. The decline could be unpredictable and happen quickly, or it may unfold in more gradual, choppy moves. One thing to be certain of is that retail traders are betting against the market, mainly due to the gap being filled. However, caution is advised when trading this index. It’s important to wait for confirmation before making any decisions.
SPX | Daily Analysis #1Lets take a look at OANDA:SPX500USD at start of the Monday and being ready for the week.
Last Week:
well, as you may know last week was a struggle and flashy crashy market for all and at least about 80% of indexes was turning red in Friday amid US and China trade war escalation.
Start Of the Week:
Personally I think the market will open with huge gap in down side and flame the Fear factor for the start of Monday.
Horizon:
Well, during 2018-2019 trade war showed us that this romance not gonna end soon and this story will continue at least 3-6 months. And if any tension rises, the markets will shot again.
4H Time Frame:
As you can see, the index passed trough the latest Demand zone and heading to Supply zone. this area may good for some buyers to take action for catching or creating correction for Friday's move. if this will happen the price would go in $6580 area. and make some range towards 1st of November.
✔️ Personally, I’m waiting and observing for market re-action for THIS first day of market.

USD/JPY creates reversal as trade war re-ignitesThe USD/JPY has reversed along with many other FX majors and indices, as markets have turned risk off all of a sudden. Today's bearish engulfing candle could the the start of a new bearish trend on the USD/JPY and we could see 150.00 in early next week, and potentially lower.
Markets were in desperate need of a catalyst for volatility, and it seemed like nothing would shake things up as the weekend approached — until suddenly, that changed.
It now appears the trade war with China has officially reignited. Trump threatened a “massive increase in tariffs” on Chinese goods, citing China’s recent restrictive export measures on rare-earth minerals. The announcement sent shockwaves through financial markets: stocks and crude oil tumbled, the dollar slumped against the yen, and risk-sensitive currencies like the Australian dollar weakened sharply.
Buckle up!
By Fawad Razaqzada, market analyst with FOREX.com

Time for Short on GoldMassive Win since last 2 weeks on buy . Now time take a fall . Look for sell from 3380-88 .

GOLD BUY INTACTFinal bullrun towards 34xx plus is remaining to complete ite wave before goes sideways to decide either going down or ATH

Direct Buy In Gold : Coming Currently gold is trading under falling wedge pattern which will explode soon once volume will come . Buying here is good idea imao

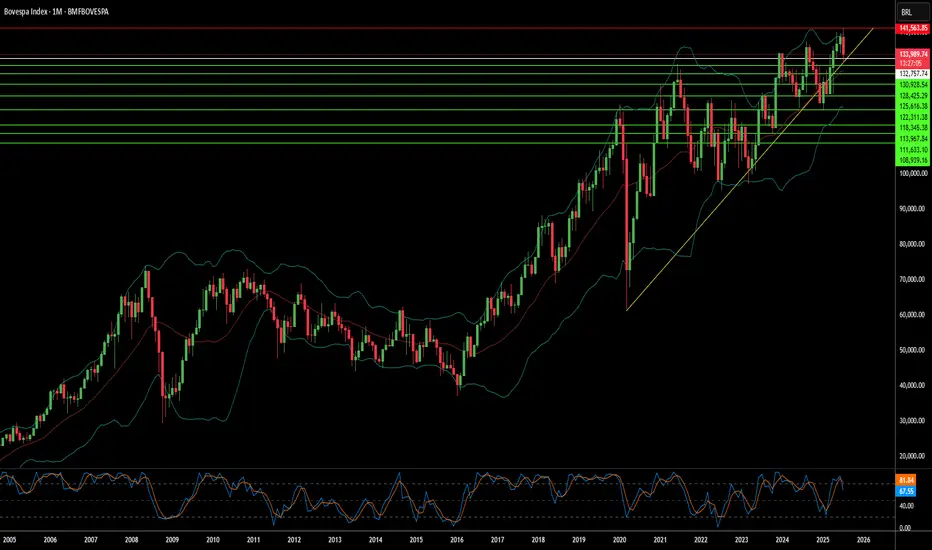
Has Geopolitics Clouded Brazil's Market Horizon?The Bovespa Index, Brazil's benchmark stock market index, faces significant headwinds from an unexpected source: escalating geopolitical tensions with the United States. Recent decisions by the US administration to impose a steep 50% tariff on most Brazilian imports, citing the ongoing prosecution of former President Jair Bolsonaro, have introduced considerable uncertainty. This move, framed by the US as a response to perceived "human rights abuses" and an undermining of the rule of law in Brazil's judiciary, marks a departure from conventional trade disputes, intertwining economic policy with internal political affairs. Brazilian President Luiz Inácio Lula da Silva has firmly rejected this interference, asserting Brazil's sovereignty and its willingness to negotiate trade, but not judicial independence.
The economic repercussions of these tariffs are multifaceted. While key sectors like civil aircraft, energy, orange juice, and refined copper have secured exemptions, critical exports such as beef and coffee face the full 50% duty. Brazilian meatpackers anticipate losses exceeding $1 billion, and coffee exporters foresee significant impacts. Goldman Sachs estimates an effective tariff rate of around 30.8% on total Brazilian shipments to the US. Beyond direct trade, the dispute dampens investor confidence, particularly given the US's existing trade surplus with Brazil. The threat of Brazilian retaliation looms, potentially exacerbating economic instability and further impacting the Bovespa.
The dispute extends into the technological and high-tech realms, adding another layer of complexity. US sanctions against Brazilian Supreme Court Justice Alexandre de Moraes, who oversees Bolsonaro's trial, directly link to his judicial orders against social media companies like X and Rumble for alleged disinformation. This raises concerns about digital policy and free speech, with some analysts arguing that regulating major US tech companies constitutes a trade issue given their economic significance. Furthermore, while the aerospace industry (Embraer) received an exemption, the broader impact on high-tech sectors and intellectual property concerns, previously highlighted by the USTR regarding Brazilian patent protection, contribute to a cautious investment environment. These intertwined geopolitical, economic, and technological factors collectively contribute to a volatile outlook for the Bovespa Index.