SPY DEMAND LEVEL BELOW|LONG|
✅SPY tapped into the demand level and printed bullish reaction wicks, signaling a short-term rebound toward 678$. Liquidity above minor highs could be targeted. Time Frame 2H.
LONG🚀
✅Like and subscribe to never miss a new idea!✅
Trading

US30: Bulls Are Winning! Long!
My dear friends,
Today we will analyse US30 together☺️
The recent price action suggests a shift in mid-term momentum. A break above the current local range around 47,172.59 will confirm the new direction upwards with the target being the next key level of 47,302.90 and a reconvened placement of a stop-loss beyond the range.
❤️Sending you lots of Love and Hugs❤️

SILVER: Next Move Is Down! Short!
My dear friends,
Today we will analyse SILVER together☺️
The in-trend continuation seems likely as the current long-term trend appears to be strong, and price is holding below a key level of 47.778 So a bearish continuation seems plausible, targeting the next low. We should enter on confirmation, and place a stop-loss beyond the recent swing level.
❤️Sending you lots of Love and Hugs❤️

EURUSD: Target Is Down! Short!
My dear friends,
Today we will analyse EURUSD together☺️
The market is at an inflection zone and price has now reached an area around 1.14920 where previous reversals or breakouts have occurred.And a price reaction that we are seeing on multiple timeframes here could signal the next move down so we can enter on confirmation, and target the next key level of 1.14799.Stop-loss is recommended beyond the inflection zone.
❤️Sending you lots of Love and Hugs❤️

GOLD: Move Up Expected! Long!
My dear friends,
Today we will analyse GOLD together☺️
The price is near a wide key level
and the pair is approaching a significant decision level of 3,968.64 Therefore, a strong bullish reaction here could determine the next move up.We will watch for a confirmation candle, and then target the next key level of 3,986.66.Recommend Stop-loss is beyond the current level.
❤️Sending you lots of Love and Hugs❤️

Gold price analysis April 11XAUUSD — Gold retains bullish structure within the price channel
Gold is currently moving in the lower half of the rising price channel, showing that buying power is quietly accumulating. The main trendline continues to play an important support role, maintaining the current uptrend.
The key level 4033 is still an important confirmation level for buyers — when the price closes stably above, the uptrend can be more clearly consolidated.
Trading strategy in this period still prioritizes BUY:
BUY around the trendline: around 3980
BUY when the price breaks through the resistance of 4033 (confirms breakout)
🎯 Target: 4100
⚠️ Risk: If the trendline is broken, the scenario of a deep drop to the support zone of 3800 needs to be considered.
Overall, the price structure is still inclined to the uptrend, only when the price channel is completely broken will the trend reverse.

ETHFI – Potential Rebound from Major Support ZoneETHFI is currently testing a critical support zone between $0.60 and $0.80, a level that previously held strong during market corrections. Price structure appears to be respecting this level, and the RSI is nearing oversold territory, hinting at a possible momentum shift. This combination sets the stage for a potential bounce if current conditions hold.
🔹 Trade Idea Setup
📌 Entry Zone: $0.60 – $0.80
🎯 Take Profit Targets:
• TP1: $1.90
• TP2: $2.90
🛑 Stop Loss: $0.18
This setup presents a favorable risk-reward ratio, with entry at support and clearly defined targets. RSI signals are adding confluence, but always watch for volume confirmation and broader market behavior.

Chainlink (LINK) – SmartCon 2025 + Key Support TestLINK is in focus as SmartCon 2025 kicks off today, drawing attention to the broader Chainlink ecosystem. Historically, this event has sparked major announcements and partnerships, often impacting LINK price action. Traders are now watching for potential bullish catalysts during the event.
Technically, LINK is breaking down into a key support zone between $14.50 and $15.00. This zone has held in the past and could act as a launchpad for a reversal bounce, especially if event-driven sentiment kicks in. Failure to hold this zone opens the door to deeper retracements.
🛠️ Trade Setup (Idea Only):
Entry Zone: $14.50–$15.00
Take Profits: $20 / $22 / $25
Stop Loss: $13
Bias: Short-term bullish if support holds

BTC: 103.9k–103.1k cluster on watch, 109k is key__________________________________________________________________________________
Market Overview
__________________________________________________________________________________
BTC is in a corrective drift into a dense multi‑TF demand zone as the macro regime stays risk‑off. Buyers defend the upper cluster, but bounces keep stalling beneath the first supply shelf.
Momentum: 📉 Bearish-corrective — intraday pressure persists with rejections below 104.8k–105.6k.
Key levels:
• Resistances (HTF/1D–12H): 104.8k–105.6k (breakdown shelf), 109.0k (must reclaim), 111.8k–114.6k (1D supply stairs).
• Supports (12H/6H/4H/1D): 103.9k–103.1k (multi‑TF cluster), 102.93k–102.75k (AGG/1H), 102.23k (1D floor).
Volumes: Normal to moderate on 1H–4H (🔎 act as an amplifier, no major catalyst yet).
Multi-timeframe signals: 1D/12H still Up, while 6H/4H/2H/1H/30m/15m are Down; average tilt remains lower while below 105.6k and 109k.
Risk On / Risk Off Indicator: neutral sell — confirms the risk‑off tilt and tempers dip‑buying near supports.
__________________________________________________________________________________
Trading Playbook
__________________________________________________________________________________
Strategic stance: HTFs are still up but the regime is risk‑off — favor confirmed tactical buys at demand and sell rejections under supply shelves.
Global bias: Neutral‑sell while < 109k; tactical invalidation if we close ≥ 109k with confirmation.
Opportunities:
• Tactical buy: fade into 103.9k–103.1k on a ≥2H reversal, first target the 104.8k–105.6k shelf.
• Breakout buy: add on reclaim/hold > 104.8k–105.6k with a 4H close; target 107.4k then 109k.
• Tactical sell: fade rejections at 104.8k–105.6k (and/or 109k) with rising sell volume.
Risk zones / invalidations: A sustained close < 102.93k (AGG) invalidates the bounce and opens 102.23k; failure to reclaim 109k keeps sellers in control.
Macro catalysts (Twitter, Perplexity, news):
• US spot ETFs: 4‑day outflow streak, 7‑day average negative — headwind for dip‑buys.
• Fed/liquidity vs growth: Fed injections vs growth/credit stress — sticky risk‑off regime.
• ISM contraction and softer USD expectations — could ease pressure if flows improve.
Action plan:
• Long (cluster): Entry 103.9k→103.1k on ≥2H reversal / Stop < 102.93k / TP1 103.9k–104.2k, TP2 104.8k–105.6k, TP3 107.4k / R:R ~1.5–2.2.
• Short (rejection): Entry 104.8k–105.6k on rejection / Stop > 105.6k / TP1 103.9k, TP2 103.3k–103.1k, TP3 102.93k / R:R ~1.6–2.0.
__________________________________________________________________________________
Multi-Timeframe Insights
__________________________________________________________________________________
HTFs (1D/12H) still support buy‑the‑dip, while LTFs argue for patience and favor rejection sells.
1D/12H: Structure remains constructive; testing a stacked demand zone at 103.9k–103.1k; clean rejection wicks or bullish closes can trigger tactical longs.
6H/4H/2H/1H/30m/15m: Downtrends with lower highs; repeated failures beneath 104.8k–105.6k; a reclaim/hold above this shelf is needed to ease pressure.
Major divergences: HTF Up vs LTF Down — dip‑buys at Cluster A/B (103.9k→102.9k) need confirmation; a failure below 102.93k opens extension to 102.23k.
__________________________________________________________________________________
Macro & On-Chain Drivers
__________________________________________________________________________________
Macro is mixed: liquidity support versus growth/credit stress and negative ETF flows, sustaining a risk‑off regime.
Macro events: ISM manufacturing in contraction; Fed injecting liquidity while bank reserves slide; USD seen softer, but geopolitics keeps risk premia elevated — a choppy backdrop for crypto beta.
Bitcoin analysis: Lost ~109k as a cost‑basis/pivot; key demand 103.5k→100k with a ~99k shelf; high squeeze risk on a 109k reclaim and hold.
On-chain data: Rising CEX balances, elevated LTH distribution, Fear sentiment — nearby supply capping bounces until flows flip.
Expected impact: Conservative technical bias below 109k; look for confirmed bounces at 103.9k–103.1k, else room toward 102.23k then 98.9k.
__________________________________________________________________________________
Key Takeaways
__________________________________________________________________________________
Controlled correction testing a multi‑TF demand zone just below clear overhead supply.
- General trend: short‑term neutral‑bearish within an HTF uptrend.
- Most relevant setup: confirmed tactical buy in 103.9k–103.1k with fast profit‑taking below 104.8k–105.6k.
- One key macro factor: persistent spot ETF outflows enforce a risk‑off regime; wait for confirmations before sizing up.
Stay nimble: watch the 103.9k→102.9k reaction and keep risk tight until 109k is reclaimed. ⚠️

AUD-CHF Bullish Bias! Buy!
Hello,Traders!
AUDCHF is reacting from the horizontal demand area, showing signs of bullish intent. If the level holds, we could see a continuation toward 0.5280$. Time Frame 3H.
Buy!
Comment and subscribe to help us grow!
Check out other forecasts below too!
Disclosure: I am part of Trade Nation's Influencer program and receive a monthly fee for using their TradingView charts in my analysis.

NZDJPY FREE SIGNAL|LONG|
✅NZDJPY Price has tapped into the demand level with a clean rejection wick, signaling potential short-term bullish reversal toward 87.40. Liquidity resting above equal highs could attract price.
—————————
Entry: 86.95
Stop Loss: 86.64
Take Profit: 87.40
Time Frame: 2H
—————————
LONG🚀
✅Like and subscribe to never miss a new idea!✅

EUR-AUD Local Short! Sell!
Hello,Traders!
EURAUD is reacting from the horizontal supply area after a corrective pullback. Liquidity has been engineered above equal highs, signaling potential bearish continuation to 1.7680$. Time Frame 5H.
Sell!
Comment and subscribe to help us grow!
Check out other forecasts below too!
Disclosure: I am part of Trade Nation's Influencer program and receive a monthly fee for using their TradingView charts in my analysis.

USOIL BULLS ARE STRONG HERE|LONG
USOIL SIGNAL
Trade Direction: long
Entry Level: 60.06
Target Level: 60.65
Stop Loss: 59.67
RISK PROFILE
Risk level: medium
Suggested risk: 1%
Timeframe: 2h
Disclosure: I am part of Trade Nation's Influencer program and receive a monthly fee for using their TradingView charts in my analysis.
✅LIKE AND COMMENT MY IDEAS✅

Big Moves Ahead? DXY, EUR/USD & Gold at Crucial LevelsLadies and gentlemen, there was a time when forex was full of trading opportunities... to the point where most people struggled with overtrading. But these days, you need a solid watchlist to even find positions, and that's where Skeptic Lab comes in—it's a great spot for spotting good opportunities. So without further ado, let's dive into the analysis of DXY , or the dollar index.
💲 In the daily timeframe , after the drop it had, it's entered a consolidation box, and it looks like we're nearing the end of that box. The main long trigger is a break of 100.262 from a technical standpoint, but personally, after the break of 99.850, I'm already positioned on one of the USD symbols. In lower timeframes, plus the fact that breaking the ceiling of consolidations is usually not straightforward and comes with a lot of volatility, so it's better to have a pre-breakout position.
💶Let's head over to EURX in the 4H timeframe —we've had a good reaction at the 1085.9 support. Breaking it would be a great trigger if you want a EURUSD position.
Speaking of EURUSD , it's already entered a secondary bearish trend after breaking its daily trend line. If the DXY consolidation box breaks, EURUSD will officially change its HWC trend to bearish. The position I mentioned at the start of the analysis—I opened it with the break of that same daily EURUSD trend line. The key level for profit-taking will be 1.14640. I'll wait to see what reaction DXY gives—if it fakes the box break, I'll close the position; if not, I'll leave it open for now.
🪙But let's move on to gold —the commodity I'm eyeing today for opening a position. From a technical perspective, it's at a spot that gives both short and long triggers... let me explain.
In the daily timeframe, we had a strong uptrend rally that, after reaching 4377.67 , entered its secondary corrective trend. In the 4H timeframe, what's interesting is the formation of these range boxes we're seeing. So our long and short triggers are clear: break of the box ceiling = long / break of the box floor = short.
But the thing is, the targets are the same... see, opening a short here basically means going along with the secondary trend, so? Your expectations should be relative to this leg, not the weekly one... so it's better to take your targets quicker, like 3896.31 (the 0.38 fib intersection), which could be a good target. Plus, each bearish leg is weaker than the previous one, so the point I mentioned makes sense for the target.
For longs, though, you can proceed with partial profits and not close too early. Alright, that's it. Now get outta here.

EUR/NZD SHORT FROM RESISTANCE
EUR/NZD SIGNAL
Trade Direction: short
Entry Level: 2.031
Target Level: 1.999
Stop Loss: 2.053
RISK PROFILE
Risk level: medium
Suggested risk: 1%
Timeframe: 1D
Disclosure: I am part of Trade Nation's Influencer program and receive a monthly fee for using their TradingView charts in my analysis.
✅LIKE AND COMMENT MY IDEAS✅

EUR/AUD BEARS WILL DOMINATE THE MARKET|SHORT
Hello, Friends!
We are targeting the 1.752 level area with our short trade on EUR/AUD which is based on the fact that the pair is overbought on the BB band scale and is also approaching a resistance line above thus going us a good entry option.
Disclosure: I am part of Trade Nation's Influencer program and receive a monthly fee for using their TradingView charts in my analysis.
✅LIKE AND COMMENT MY IDEAS✅

ZEC - Roadmap to $500!💪Zcash has been on fire lately, outperforming over 90% of altcoins in the market. After months of accumulation, the bulls have finally taken control, driving ZEC into a strong impulsive rally that shows no signs of exhaustion yet.
📈 From a technical perspective , ZEC is trading within a well-defined rising channel, maintaining a clean bullish structure of higher highs and higher lows. The recent breakout above the previous all-time high around $372 confirms strong bullish momentum.
🏹As long as the channel’s lower boundary continues to act as dynamic support, the next logical target for the bulls sits around the $500 round number, which aligns with the upper boundary of the channel, a major confluence zone.
In the short term, a minor pullback toward the $370–$400 region wouldn’t be surprising and could offer new long opportunities before the next bullish leg kicks in.
⚠️ Disclaimer: This is not financial advice. Always do your own research and manage risk properly.
All Strategies Are Good; If Managed Properly!
~Richard Nasr

EUR/CAD SENDS CLEAR BULLISH SIGNALS|LONG
Hello, Friends!
We are now examining the EUR/CAD pair and we can see that the pair is going down locally while also being in a downtrend on the 1W TF. But there is also a powerful signal from the BB lower band being nearby indicating that the pair is oversold so we can go long from the support line below and a target at 1.637 level.
Disclosure: I am part of Trade Nation's Influencer program and receive a monthly fee for using their TradingView charts in my analysis.
✅LIKE AND COMMENT MY IDEAS✅

ENA - bearish MIL:ENA - price analysis: 🔴
The chart is Following the global market sentiment: Bearish 📉
Bulls are literally absent at the moment.
Another bearish candle closed on the daily basis, under 0.3600$ 🚨
Rejection also on POC point daily 📉🔴
Zooming on the daily view, price could continue to dump & stabilize on lower demand zone:
🎯0.3100 - 0.300$ (weak level)
🎯0.2600 - 0.2500
🎯0.200 - 0.2050$
Even if it's a solid project, following general market trend often give view the right direction and best entries.
Long term outlook:
Prices is traded under many key levels Weekly / Monthly.
0.400 - 0.4550 - 0.500$ 🔴
Weekly candle close with volume above 0.400$ is required for potential bull reversal!
#ENA #trading

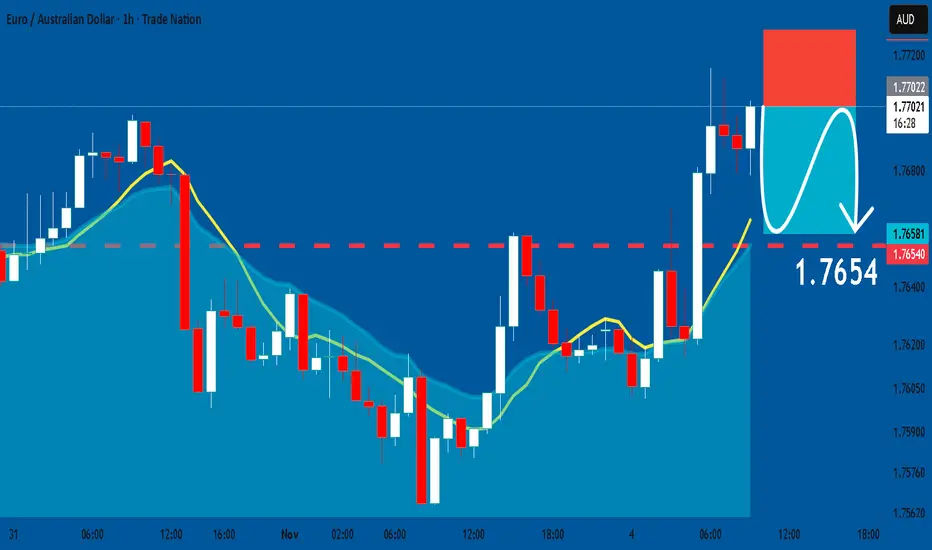
EURAUD: Short Signal Explained
EURAUD
- Classic bearish formation
- Our team expects fall
SUGGESTED TRADE:
Swing Trade
Sell EURAUD
Entry Level - 1.7701
Sl - 1.7728
Tp - 1.7654
Our Risk - 1%
Start protection of your profits from lower levels
Disclosure: I am part of Trade Nation's Influencer program and receive a monthly fee for using their TradingView charts in my analysis.
❤️ Please, support our work with like & comment! ❤️
SILVER Will Go Higher! Long!
Take a look at our analysis for SILVER.
Time Frame: 1D
Current Trend: Bullish
Sentiment: Oversold (based on 7-period RSI)
Forecast: Bullish
The market is approaching a key horizontal level 4,796.6.
Considering the today's price action, probabilities will be high to see a movement to 5,274.4.
P.S
Overbought describes a period of time where there has been a significant and consistent upward move in price over a period of time without much pullback.
Like and subscribe and comment my ideas if you enjoy them!

AUDUSD Will Go Up! Buy!
Please, check our technical outlook for AUDUSD.
Time Frame: 3h
Current Trend: Bullish
Sentiment: Oversold (based on 7-period RSI)
Forecast: Bullish
The market is approaching a significant support area 0.650.
The underlined horizontal cluster clearly indicates a highly probable bullish movement with target 0.654 level.
P.S
Please, note that an oversold/overbought condition can last for a long time, and therefore being oversold/overbought doesn't mean a price rally will come soon, or at all.
Like and subscribe and comment my ideas if you enjoy them!

GBPCHF Is Bullish! Long!
Take a look at our analysis for GBPCHF.
Time Frame: 3h
Current Trend: Bullish
Sentiment: Oversold (based on 7-period RSI)
Forecast: Bullish
The price is testing a key support 1.056.
Current market trend & oversold RSI makes me think that buyers will push the price. I will anticipate a bullish movement at least to 1.059 level.
P.S
We determine oversold/overbought condition with RSI indicator.
When it drops below 30 - the market is considered to be oversold.
When it bounces above 70 - the market is considered to be overbought.
Like and subscribe and comment my ideas if you enjoy them!
