Gold price analysis todayXAUUSD Update — Hold the structure, wait for a quality BUY setup
Currently, the gold chart has no major structural changes — the market is in a correction phase at an important resistance zone. This is a “consolidation” phase before the next trend becomes more obvious, so the priority is to be patient and wait for a high probability setup.
If you are holding a SELL position from the resistance zone, the current strategy is to hold the order and manage profits — wait for a reaction at the support zones to decide to close/open more. For those looking for BUY opportunities, wait for signs of price rejection (rejection / wick / bullish price action) at the indicated support zone before entering the order.
Important zone: 4075 — 4031 (support zone to find BUY signal)
Strategy: Enter BUY when there is a clear price rejection signal + volume/price action reaction.
Target: 4300
Risk management: stoploss placed below support zone if price action breaks and closes deep below.
Trading

CADCHF STRONG REJECTION|LONG|
✅CADCHF swept liquidity beneath the previous swing low and is now reacting from a clean demand block, hinting at a possible short-term reversal toward internal range liquidity. Time Frame 3H.
LONG🚀
✅Like and subscribe to never miss a new idea!✅

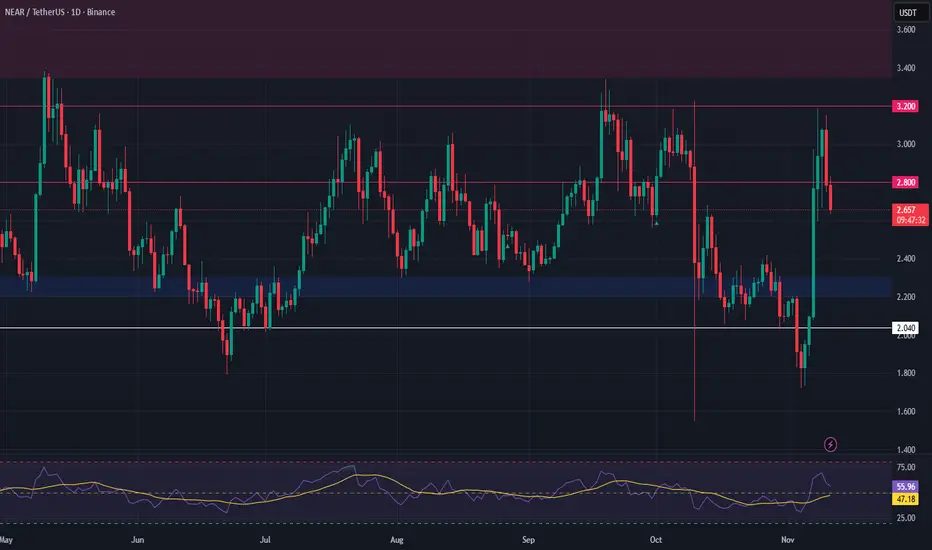
NEAR Protocol – AI Sector Strength & Breakout SetupStrength is rotating back into the AI and Web3 sectors, and NEAR is starting to show leadership. We’ve seen a clean breakout above consolidation, with volume confirming bullish intent. This could mark the beginning of a new leg up if the structure holds.
💡 Trade Idea
Entry Zone: $2.20 – $2.30 (support retest)
Take Profit Targets: $2.80 / $3.20
Stop Loss: $2.04
A pullback into the highlighted zone offers a high-probability entry, as prior resistance flips to support. The setup provides a solid R/R ratio for momentum continuation.
📊 Technical Outlook
Breakout confirmed with volume
Retest in progress or upcoming
Momentum shifting into AI narratives across crypto and equities
Watch closely for confirmation on the retest. As always, manage risk carefully.
🔔 Set alerts around the support zone for potential entry timing.
GBPAUD Will Go Higher! Buy!
Please, check our technical outlook for GBPAUD.
Time Frame: 1h
Current Trend: Bullish
Sentiment: Oversold (based on 7-period RSI)
Forecast: Bullish
The market is trading around a solid horizontal structure 2.007.
The above observations make me that the market will inevitably achieve 2.013 level.
P.S
The term oversold refers to a condition where an asset has traded lower in price and has the potential for a price bounce.
Overbought refers to market scenarios where the instrument is traded considerably higher than its fair value. Overvaluation is caused by market sentiments when there is positive news.
Like and subscribe and comment my ideas if you enjoy them!

EURJPY FREE SIGNAL|SHORT|
✅EURJPY shows price delivery into a premium area, mitigating a clear supply level while forming bearish order flow. Short-term target sits below the recent internal range low. Time Frame 3H.
—————————
Entry: 178.640
Stop Loss: 178.900
Take Profit: 178.150
—————————
SHORT🔥
✅Like and subscribe to never miss a new idea!✅

GOLD SENDS CLEAR BEARISH SIGNALS|SHORT
GOLD SIGNAL
Trade Direction: short
Entry Level: 4,124.58
Target Level: 4,005.98
Stop Loss: 4,203.19
RISK PROFILE
Risk level: medium
Suggested risk: 1%
Timeframe: 9h
Disclosure: I am part of Trade Nation's Influencer program and receive a monthly fee for using their TradingView charts in my analysis.
✅LIKE AND COMMENT MY IDEAS✅

GBPCAD: Price Cross Below H1 ATLKey Observations
On the D1 TF, price is showing a weak bearish trend
EMA20 barely crossed below EMA60, however, price is showing more inside bars than what I'd like to see
On the H1 TF, price crossed below the ATL
Price is also accelerating away from the EMA band

SILVER Will Go Down! Short!
Here is our detailed technical review for SILVER.
Time Frame: 9h
Current Trend: Bearish
Sentiment: Overbought (based on 7-period RSI)
Forecast: Bearish
The market is testing a major horizontal structure 5,097.6.
Taking into consideration the structure & trend analysis, I believe that the market will reach 4,922.1 level soon.
P.S
We determine oversold/overbought condition with RSI indicator.
When it drops below 30 - the market is considered to be oversold.
When it bounces above 70 - the market is considered to be overbought.
Like and subscribe and comment my ideas if you enjoy them!

USD/JPY BEARS ARE STRONG HERE|SHORT
USD/JPY SIGNAL
Trade Direction: short
Entry Level: 154.370
Target Level: 152.668
Stop Loss: 155.497
RISK PROFILE
Risk level: medium
Suggested risk: 1%
Timeframe: 6h
Disclosure: I am part of Trade Nation's Influencer program and receive a monthly fee for using their TradingView charts in my analysis.
✅LIKE AND COMMENT MY IDEAS✅

GBPJPY Technical Analysis! SELL!
My dear friends,
Please, find my technical outlook for GBPJPY below:
The instrument tests an important psychological level 202.90
Bias - Bearish
Technical Indicators: Supper Trend gives a precise Bearish signal, while Pivot Point HL predicts price changes and potential reversals in the market.
Target - 201.75
About Used Indicators:
Super-trend indicator is more useful in trending markets where there are clear uptrends and downtrends in price.
Disclosure: I am part of Trade Nation's Influencer program and receive a monthly fee for using their TradingView charts in my analysis.
———————————
WISH YOU ALL LUCK

AUDUSD Under Pressure! SELL!
My dear followers,
This is my opinion on the AUDUSD next move:
The asset is approaching an important pivot point 0.6535
Bias - Bearish
Technical Indicators: Supper Trend generates a clear short signal while Pivot Point HL is currently determining the overall Bearish trend of the market.
Goal - 0.6506
About Used Indicators:
For more efficient signals, super-trend is used in combination with other indicators like Pivot Points.
Disclosure: I am part of Trade Nation's Influencer program and receive a monthly fee for using their TradingView charts in my analysis.
———————————
WISH YOU ALL LUCK

USDJPY Will Move Lower! Sell!
Take a look at our analysis for USDJPY.
Time Frame: 15m
Current Trend: Bearish
Sentiment: Overbought (based on 7-period RSI)
Forecast: Bearish
The market is approaching a key horizontal level 154.303.
Considering the today's price action, probabilities will be high to see a movement to 154.127.
P.S
Overbought describes a period of time where there has been a significant and consistent upward move in price over a period of time without much pullback.
Like and subscribe and comment my ideas if you enjoy them!

Gold H1 - Holds Above 4,140$, Eyes the 4,200$ Breakout🔍 Market Context
Gold continues its relentless climb, trading near a three-week high at 4,146$ as buyers remain firmly in control.
Despite a mild rebound in the US Dollar — driven by cautious sentiment across Asian markets — gold’s momentum stays intact, fueled by expectations that the Federal Reserve may proceed with a rate cut in December.
Soft US data last week and weaker consumer sentiment readings have further strengthened this outlook, keeping real yields under pressure and reinforcing gold’s safe-haven appeal.
📊 Technical Outlook (H1–H4)
The market structure remains bullish, forming a clear ascending channel.
Price has broken above the previous resistance at 4,086$ and is now consolidating around 4,140$, preparing for a potential continuation move.
Key Levels:
• Support Zones: 4,086$ – 4,039$ → retest area for new buyers
• Immediate Resistance: 4,146$
• Breakout Target: 4,203$
• Extended Bullish Target: 4,382$ (ATH zone)
If gold maintains structure above 4,080$, the bias remains strongly bullish.
Only a confirmed close below this zone would suggest a short-term pullback before continuation.
⚜️ MMFLOW Insight:
“Momentum follows liquidity. Once price reclaims key structure, smart money builds the next leg — not noise, but narrative.”

AUD/USD LONG FROM SUPPORT
Hello, Friends!
We are now examining the AUD/USD pair and we can see that the pair is going down locally while also being in a downtrend on the 1W TF. But there is also a powerful signal from the BB lower band being nearby indicating that the pair is oversold so we can go long from the support line below and a target at 0.654 level.
Disclosure: I am part of Trade Nation's Influencer program and receive a monthly fee for using their TradingView charts in my analysis.
✅LIKE AND COMMENT MY IDEAS✅

$SPY $SPX Scenarios — Tuesday, Nov 11, 2025🔮 AMEX:SPY SP:SPX Scenarios — Tuesday, Nov 11, 2025 🔮
🌍 Market-Moving Headlines
🇺🇸 Veterans Day — U.S. bond market closed, equities open but expect thin liquidity and lower volume.
💬 Fed focus: Fed Governor Michael Barr headlines the day’s lone major event, speaking mid-morning on financial stability and supervision.
📉 Small-business sentiment dips: The NFIB Optimism Index slipped to 98.2 from 98.8, reflecting softer hiring plans and higher cost concerns.
⚠️ Shutdown delays: Broader federal data remains constrained this week — investors will continue watching Fed commentary for policy cues.
📊 Key Data and Events (ET)
⏰ 6:00 AM — NFIB Small Business Optimism (Oct) | 98.2 vs 98.8 prior
⏰ 10:25 AM — Michael Barr (Fed Governor) speech
📉 Bond market closed for Veterans Day; expect quieter sessions and possible afternoon drift in equities.
⚠️ Note:
No Tier-1 data today. With lighter volume and no Treasury trading, price action will likely be headline-driven. Keep an eye on Barr’s tone for any hints on post-shutdown policy or liquidity support.
⚠️ Disclaimer: Educational and informational only — not financial advice.
📌 #SPY #SPX #trading #Fed #MichaelBarr #NFIB #VeteransDay #markets #macro #liquidity #bonds

LiamTrading – XAUUSD H2 | A corrective move may occur todayLiamTrading – XAUUSD H2 | A corrective move may occur today
Follow Liquidity 4090, FVG 4053–4069 & VAH ~4025
Quick note: Gold remains in an uptrend but shows signs of stalling at the upper boundary of the ascending channel. Amid the backdrop of potential USD fluctuations as the US nears reopening, a technical correction towards liquidity zones is a scenario to prepare for.
Technical Analysis
Trendline/Price Channel: Price is moving within an ascending channel; the channel top at 4130–4140 is prone to profit-taking/stalling.
Liquidity: 4085–4092 – a price pull/volume attraction point before choosing the next direction.
FVG #1: 4053–4069 – a price gap with a probability of filling and reversing.
VAH (Volume Profile): 4023–4028 – volume value peak; strong confluence support in case of a deep correction.
POC: ~3985–3990 – a magnetic point if the market weakens more than expected.
Resistance: 4135–4140 (near channel top + short-term offer), further out 4166 (Fibo/channel top extension).
Fibonacci: The latest upward wave shows the expansion area around 4135–4166 as a “liquidity pocket” – suitable for scalp sell upon clear rejection; retracement levels 0.382–0.5 converge around 406x–402x, aligning with FVG & VAH → preferred buy point if price corrects.
Trading Scenarios
Buy shallow pullback (trend-following)
Entry: 4083–4085
SL: 4077
TP: 4098 → 4112 → 4140 → 4166
Note: Requires rejection/candle wick at Liquidity 4090; move SL to breakeven at +1R.
Buy deep at VAH/Volume Profile
Entry: 4025–4028
SL: 4020
TP: 4040 → 4065 → 4100 → 4112
Note: Prioritize when FVG 4053–4069 fills and reverses; exercise caution with volume.
Sell scalp at channel resistance (counter-trend)
Entry: 4135–4140
SL: 4148
TP: 4122 → 4105 → 4090
Note: This is a scalp trade; abandon if H1/H2 closes strongly above 4140.
H1/H2 closes below 4077 → risk of testing 4053–4069; further breach of 4020 may drag to POC ~3990.
Each trade risks 0.5–1%, do not average down against the trend; adhere to Dow (enter only upon confirmed support/resistance break on entry timeframe).
What level are you watching for gold today? Comment below & hit Follow on LiamTrading channel for the fastest updates.

EURGBP FREE SIGNAL|LONG|
✅EURGBP formed a clean liquidity sweep below the equal lows, tapping into a defined demand block before showing displacement to the upside. Targeting the imbalance left behind by impulsive selling.
—————————
Entry: 0.8770
Stop Loss: 0.8762
Take Profit: 0.8785
Time Frame: 2H
—————————
LONG🚀
✅Like and subscribe to never miss a new idea!✅

EURGBP My Opinion! BUY!
My dear friends,
EURGBP looks like it will make a good move, and here are the details:
The market is trading on 0.8775 pivot level.
Bias - Bullish
Technical Indicators: Supper Trend generates a clear long signal while Pivot Point HL is currently determining the overall Bullish trend of the market.
Goal - 0.8787
Recommended Stop Loss - 0.8768
About Used Indicators:
Pivot points are a great way to identify areas of support and resistance, but they work best when combined with other kinds of technical analysis
Disclosure: I am part of Trade Nation's Influencer program and receive a monthly fee for using their TradingView charts in my analysis.
———————————
WISH YOU ALL LUCK

Gold price analysis October 11✨ Gold Analysis XAUUSD – 10/11/2025
Gold price has officially broken the Keylevel 4031 zone, confirming a strong bullish wave is forming. This development makes the intraday trading strategy clearer and more favorable when giving full priority to BUY setups following the trend.
Main scenario:
✅ BUY right at the price zone 4045
✅ BUY when the price rejection signal appears around the support zone 4031
🎯 Profit target: 4150
Sub-scenario (low risk):
❌ SELL is only considered if a false break appears and the price closes the candle back below 3985 – however, this possibility is currently very low.
👉 Comment: The break zone 4031 is the perfect confirmation point for the uptrend. Prioritize looking for buying opportunities with the main wave instead of trading against the trend.

SILVER WILL KEEP GROWING|LONG|
✅SILVER is rallying from a refined demand zone, showing bullish orderflow continuation. With liquidity swept below previous lows, institutions may target the next imbalance near $51.00. Time Frame 3H.
LONG🚀
✅Like and subscribe to never miss a new idea!✅

CAD-CHF Short From Supply Area! Sell!
Hello,Traders!
CADCHF is reacting from a premium supply zone where liquidity was previously engineered. Expect a short-term drop toward the next demand imbalance as smart money rebalances the range.Time Frame 5H.
Sell!
Comment and subscribe to help us grow!
Check out other forecasts below too!
Disclosure: I am part of Trade Nation's Influencer program and receive a monthly fee for using their TradingView charts in my analysis.

GBPCHF LOCAL SHORT|
✅GBPCHF is tapping into a clear supply level after an inefficient move upward. Institutional traders may look to rebalance the range by driving price toward the liquidity resting below 1.0590. Time Frame 3H.
SHORT🔥
✅Like and subscribe to never miss a new idea!✅

Gold Price Rejection at Trendline – Pullback Toward 4075 TargetGold price is testing a key resistance trendline near the 4,110 level after a strong bullish rally. A potential pullback is expected toward the 4,075 target zone, aligning with a nearby support level and fair value gap (FVG).
