NZD-CAD Free Signal! Buy!
Hello,Traders!
NZDCAD is reacting within a premium zone after filling imbalance and tapping into a horizontal supply area. The move shows potential redistribution for a leg higher.
---------------------
Stop Loss: 0.7955
Take Profit: 0.7905
Entry: 0.7925
Time Frame: 2H
---------------------
Sell!
Comment and subscribe to help us grow!
Check out other forecasts below too!
Disclosure: I am part of Trade Nation's Influencer program and receive a monthly fee for using their TradingView charts in my analysis.
Trading

EURJPY FREE SIGNAL|SHORT|
✅EURJPY shows price delivery into a premium area, mitigating a clear supply level while forming bearish order flow. Short-term target sits below the recent internal range low. Time Frame 3H.
—————————
Entry: 178.640
Stop Loss: 178.900
Take Profit: 178.150
—————————
SHORT🔥
✅Like and subscribe to never miss a new idea!✅

EUR-AUD Local Short! Sell!
Hello,Traders!
EURAUD is trading inside a premium range, rejecting from a horizontal supply area with strong bearish reaction and clean imbalance left below—suggesting a potential continuation lower. Time Frame 2H.
Sell!
Comment and subscribe to help us grow!
Check out other forecasts below too!
Disclosure: I am part of Trade Nation's Influencer program and receive a monthly fee for using their TradingView charts in my analysis.

EURCHF LOCAL LONG|
✅EURCHF tapped into a clean demand zone, sweeping liquidity below previous lows before showing bullish displacement. A retracement could now aim for the imbalance zone overhead. Time Frame 3H.
LONG🚀
✅Like and subscribe to never miss a new idea!✅

USD-CHF Bullish Rebound! Buy!
Hello,Traders!
USDCHF is showing reaction off a key demand reaccumulation block after a strong displacement move, hinting at potential short-term retracement toward the inefficiency above. Time Frame 4H.
Buy!
Comment and subscribe to help us grow!
Check out other forecasts below too!
Disclosure: I am part of Trade Nation's Influencer program and receive a monthly fee for using their TradingView charts in my analysis.

Backtesting on TradingViewBased on the massive feedback from our previous article about backtesting we decided to make a follow up on how to backtest your strategy.
Every trader talks about strategy.
Few actually test it.
Backtesting is where ideas meet data — and TradingView makes it surprisingly simple.
Whether you code your own system or use built-in tools, backtesting shows you how your logic performs before you risk a single dollar.
1. Open the Strategy Tester
Start by opening the chart of the asset you want to test.
Click “Strategy Tester” at the bottom of the screen.
This activates TradingView’s built-in engine that simulates your system’s historical trades automatically.
You’ll see three tabs appear:
Overview: a summary of your results.
Performance Summary: key stats like profit, drawdown, and win rate.
List of Trades: every single historical trade your strategy executed.
2. Load or Create a Strategy
Go to the Indicators & Strategies tab.
TradingView separates indicators from strategies — only strategies can trigger trades for backtesting!
You have two options:
Use a built-in or public strategy: like “MACD Strategy” or “Moving Average Crossover.”
Paste your own Pine Script strategy: under “Pine Editor,” then click “Add to Chart.”
Once applied, TradingView automatically calculates historical trades based on your logic.
Tip: Indicators are for signals, strategies are for testing execution.
3. Adjust the Test Parameters
To make your test realistic, click the ⚙️ icon next to your strategy name.
In the Properties tab, you can define:
Initial capital (e.g. $10,000)
Position size (fixed or percent-based)
Commission and slippage
Pyramiding (how many positions can stack)
Then set your date range in the Strategy Tester — for example, test from 01-01-2022 to 01-01-2024.
The goal is to simulate what your system would have done under real conditions.
4. Analyze the Results
Once the test runs, TradingView gives you a detailed breakdown:
Net Profit (%) — your total gain or loss.
Max Drawdown — your biggest loss from peak to trough.
Win Rate & Profit Factor — how often you win and how much you win versus lose.
Average Trade — the mean result per trade.
Equity Curve — how your balance evolved over time.
Scroll through the List of Trades to see how each entry and exit behaved.
If you spot clusters of losses, note the pattern — that’s where improvements start.
This is the part where you analyze and think why did a trade fail and how can I avoid it.
TradingView also enables you to export data in excel so its super easy to analyze and look for improvement.
5. Refine and Forward-Test
Once you’ve seen how your system performs historically, make small adjustments.
Change one parameter at a time — like EMA length, RSI threshold, or stop-loss distance — and rerun the test.
When you find consistent results across timeframes or markets, move to paper trading mode.
Forward-testing confirms your backtest logic under real conditions, including live volatility and execution timing.
If your live and backtested results align closely, you’ve built something solid and you are ready to make money.
A big tip here, even a small thing such as a change in stop loss or timeframe change from 15 minutes to 14 minutes can make a huge difference so try out different conditions.
TRUMP Update📊 TRUMP Update
TRUMP is testing the blue support level 🔵
If it breaks below, it could confirm a bearish setup 📉
The first short target would be the green line level 🟢

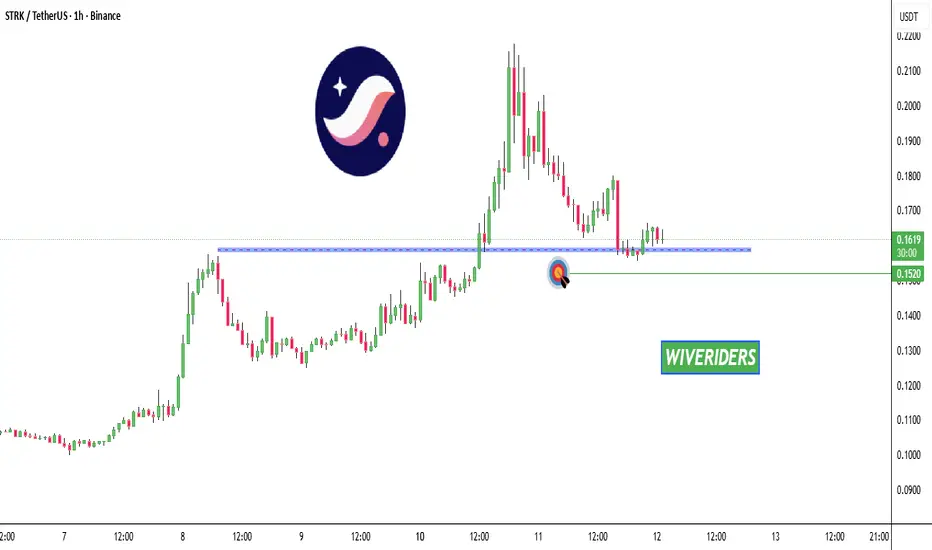
$STRK Update📊 NASDAQ:STRK Update
NASDAQ:STRK is testing the blue support level 🔵
If it breaks below, it could confirm a bearish setup 📉
The first short target would be the green line level 🟢
$ZEC Update📊 CRYPTOCAP:ZEC Update
CRYPTOCAP:ZEC is testing the blue support level 🔵
If it breaks below, it could confirm a bearish setup 📉
The first short target would be the green line level 🟢

$1INCH Update📊 $1INCH Update
$1INCH has formed a Double Top pattern 🧠
If price breaks below the 🔵 support zone, it could confirm a bearish setup 📉
Short-term target = 🟢 level 👇

Gold price analysis November 11Gold continued to move as expected in yesterday's session, bringing impressive profits to traders who followed the previous strategy.
Currently, the resistance zone of 4150 is acting as an important barrier as buying pressure starts to slow down. There is a high possibility that the market will see a short-term correction around this area.
Current strategy:
SELL GOLD (Scalping) around the resistance zone of 4145, expecting a short-term price reaction.
When the buyers return and create a confirmation signal around the 4076–4106 area, wait to BUY in line with the main trend, with a further target towards ATH 4375, where the liquidity zone above is still empty.
📈 The overall trend is still up – the correction is only temporary for the market to gain momentum for the next wave.

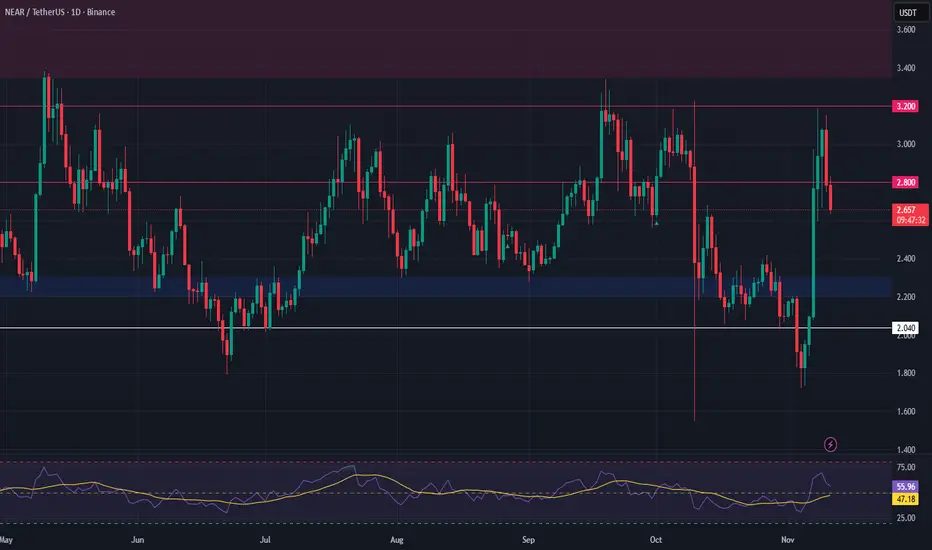
NEAR Protocol – AI Sector Strength & Breakout SetupStrength is rotating back into the AI and Web3 sectors, and NEAR is starting to show leadership. We’ve seen a clean breakout above consolidation, with volume confirming bullish intent. This could mark the beginning of a new leg up if the structure holds.
💡 Trade Idea
Entry Zone: $2.20 – $2.30 (support retest)
Take Profit Targets: $2.80 / $3.20
Stop Loss: $2.04
A pullback into the highlighted zone offers a high-probability entry, as prior resistance flips to support. The setup provides a solid R/R ratio for momentum continuation.
📊 Technical Outlook
Breakout confirmed with volume
Retest in progress or upcoming
Momentum shifting into AI narratives across crypto and equities
Watch closely for confirmation on the retest. As always, manage risk carefully.
🔔 Set alerts around the support zone for potential entry timing.
Centuri Holdings, Inc. (CTRI) AnalysisCompany Overview:
Centuri Holdings NYSE:CTRI is a leading North American utility infrastructure services provider focused on gas and electric grid modernization. It gives investors direct exposure to the energy transition, infrastructure resilience, and climate-hardening of aging utility networks.
Key Catalysts:
Contract Momentum:
Secured $950M+ in new awards (July–Sept 2025) tied to utility capital plans, grid hardening, and electrification.
This materially expands Centuri’s backlog and revenue visibility and reinforces its positioning as a go-to partner for grid reliability.
Post-Spinoff Flexibility:
After its full separation from Southwest Gas, Centuri now has a cleaner capital structure and more strategic flexibility to pursue M&A and regional expansion across a $100B+ utility services market.
Execution & Growth:
Q2 2025 revenue up 7.7% YoY to $724M.
Management raised FY25 guidance to $2.7–$2.85B, citing strong demand for high-margin electrification and modernization projects.
Why It Matters:
Utilities are spending heavily on grid upgrades, undergrounding, storm hardening, and EV-related infrastructure — Centuri sits right in that flow.
Secular tailwinds (electrification, resiliency, clean energy interconnects) support multi-year growth.
Investment Outlook:
Bullish above: $17.50–$18.00
Upside target: $30–$32
Supported by backlog strength, post-spin growth optionality, and exposure to long-cycle utility capex.
📢 CTRI — building the modern, climate-resilient grid. ⚡🏗️

CADJPY Downtrend Continuation - WavesOfSuccess MethodologyTrade Execution:
Wednesday, 11th November 2025 @ 09:35 GMT
Entry triggered after price closed below the Momentum Low bar at 110.01, confirming downtrend continuation.
Trade Management:
Entry: 110.01
Stop Loss (Invalidation): 110.08
Risk: -8.6 pips
Target: 109.73 (Fibonacci 76.4% retracement to -23.6% extension)
Risk: Reward Ratio: 3.06:1 (Risking 8.6 pips to capture 26.1 pips)
Result:
Target achieved at 13:28 GMT after New York session open. ✅
The Psychological Edge - How to Behave While in Trade
This is MORE important than technical analysis. Master these five fundamental truths:
1️⃣ Anything can happen in the market
2️⃣ Every moment is unique
3️⃣ An edge is just an indication of higher probability
4️⃣ There will be random distribution between wins and losses
5️⃣ I don't need to know what happens next
The key: Follow your mechanical rules, manage your risk, and let probability work in your favour over time.
This is mechanical trading. This is the WavesOfSuccess methodology.
If you found this valuable:
👍 Hit the boost button
👤 Follow for more trade breakdowns and education

USDJPY Buyers In Panic! SELL!
My dear subscribers,
USDJPY looks like it will make a good move, and here are the details:
The market is trading on 154.20 pivot level.
Bias - Bearish
Technical Indicators: Both Super Trend & Pivot HL indicate a highly probable Bearish continuation.
Target - 153.80
About Used Indicators:
The average true range (ATR) plays an important role in 'Supertrend' as the indicator uses ATR to calculate its value. The ATR indicator signals the degree of price volatility.
Disclosure: I am part of Trade Nation's Influencer program and receive a monthly fee for using their TradingView charts in my analysis.
———————————
WISH YOU ALL LUCK

AUDNZD Trading Opportunity! BUY!
My dear subscribers,
My technical analysis for AUDNZD is below:
The price is coiling around a solid key level - 1.1545
Bias - Bullish
Technical Indicators: Pivot Points High anticipates a potential price reversal.
Super trend shows a clear buy, giving a perfect indicators' convergence.
Goal - 1.1562
My Stop Loss - 1.1536
About Used Indicators:
By the very nature of the supertrend indicator, it offers firm support and resistance levels for traders to enter and exit trades. Additionally, it also provides signals for setting stop losses
Disclosure: I am part of Trade Nation's Influencer program and receive a monthly fee for using their TradingView charts in my analysis.
———————————
WISH YOU ALL LUCK

XDC Update📊 XDC Update
XDC is currently retracing 🔄
If price continues to retrace toward the green zone, it could offer a potential long entry 🟢
Wait for confirmation before entering to ensure a strong reversal setup 📈

Gold Technical Outlook
Price has stabilized around the 4060 resistance zone (confirmation with a 1H or 4H candle close). If the level holds, the bias remains bullish, with potential upward movement toward the 4100 resistance. A break above 4100 would open the way for continued bullish momentum, targeting the next levels at 4133 and 4168.
However, if the price fails to sustain above 4060 and confirms a reversal candle, it may trigger a downside correction toward the 4030 support zone. A confirmed break below 4030 (1H candle close) would likely extend the bearish move toward the 3965 level.
Bias Trend: Bullish
Volatility: High

SILVER Will Go Down! Short!
Here is our detailed technical review for SILVER.
Time Frame: 9h
Current Trend: Bearish
Sentiment: Overbought (based on 7-period RSI)
Forecast: Bearish
The market is testing a major horizontal structure 5,097.6.
Taking into consideration the structure & trend analysis, I believe that the market will reach 4,922.1 level soon.
P.S
We determine oversold/overbought condition with RSI indicator.
When it drops below 30 - the market is considered to be oversold.
When it bounces above 70 - the market is considered to be overbought.
Like and subscribe and comment my ideas if you enjoy them!

USDCHF Is Very Bullish! Buy!
Here is our detailed technical review for USDCHF.
Time Frame: 4h
Current Trend: Bullish
Sentiment: Oversold (based on 7-period RSI)
Forecast: Bullish
The market is on a crucial zone of demand 0.803.
The oversold market condition in a combination with key structure gives us a relatively strong bullish signal with goal 0.807 level.
P.S
The term oversold refers to a condition where an asset has traded lower in price and has the potential for a price bounce.
Overbought refers to market scenarios where the instrument is traded considerably higher than its fair value. Overvaluation is caused by market sentiments when there is positive news.
Like and subscribe and comment my ideas if you enjoy them!

USOIL BEST PLACE TO SELL FROM|SHORT
USOIL SIGNAL
Trade Direction: short
Entry Level: 60.33
Target Level: 59.05
Stop Loss: 61.18
RISK PROFILE
Risk level: medium
Suggested risk: 1%
Timeframe: 5h
Disclosure: I am part of Trade Nation's Influencer program and receive a monthly fee for using their TradingView charts in my analysis.
✅LIKE AND COMMENT MY IDEAS✅

USD/JPY BEARS ARE STRONG HERE|SHORT
USD/JPY SIGNAL
Trade Direction: short
Entry Level: 154.370
Target Level: 152.668
Stop Loss: 155.497
RISK PROFILE
Risk level: medium
Suggested risk: 1%
Timeframe: 6h
Disclosure: I am part of Trade Nation's Influencer program and receive a monthly fee for using their TradingView charts in my analysis.
✅LIKE AND COMMENT MY IDEAS✅

NZD/USD BULLS WILL DOMINATE THE MARKET|LONG
Hello, Friends!
The BB lower band is nearby so NZD-USD is in the oversold territory. Thus, despite the downtrend on the 1W timeframe I think that we will see a bullish reaction from the support line below and a move up towards the target at around 0.579.
Disclosure: I am part of Trade Nation's Influencer program and receive a monthly fee for using their TradingView charts in my analysis.
✅LIKE AND COMMENT MY IDEAS✅
