EURUSD 4H – Alligator “Sleep Phase” Before Next MoveAlligator lines have tightened after a bullish leg and are starting to turn down while price sits under the descending trendline → short-term momentum is weakening. The chart shows a clear triangle/descending resistance and support zones marked for targets.
What Alligator is saying
Sleeping / compressing now → wait for the Alligator to open (lines separate) before taking a directional trade.
If the Alligator opens down (green < red < blue) = bearish continuation.
If the Alligator opens up (green > red > blue) after a clean break above the trendline = bullish continuation.
Trade ideas (4H)
Bear (preferred while price below trendline):
Entry: Short on a close below 1.157 with Alligator stacking bearish.
1st TP: 1.1500 (support zone).
2nd TP: 1.1480–1.1460 (lower support cluster).
Stop: 1.1620–1.1640 (above consolidation / Alligator cluster).
Bull (counter / breakout):
Buy on a clean close above the descending trendline / 1.1610–1.1620 with the Alligator reopening upward.
Targets: 1.1647 (near resistance) → 1.1700 (upper target zone).
Stop: below 1.154 (recent swing low / Alligator cluster).
Risk & execution notes
Alligator tangled = no edge; prefer confirmed line separation and candle close for entries.
Use proper position sizing (1–2% risk), look for volume confirmation on breakouts.
Timeframe: this is a 4H read — check daily for stronger confirmation.
Trading

GBP-CAD Local Long! Buy!
Hello,Traders!
GBPCAD will soon hit a strong order block so despite the aggressive selling, we are likely to see a local rejection and a correction into a higher inefficiency gap.Time Frame 3H.
Sell!
Comment and subscribe to help us grow!
Check out other forecasts below too!
Disclosure: I am part of Trade Nation's Influencer program and receive a monthly fee for using their TradingView charts in my analysis.

USDCAD Under Pressure! SELL!
My dear subscribers,
This is my opinion on the USDCAD next move:
The instrument tests an important psychological level 1.4029
Bias - Bearish
Technical Indicators: Supper Trend gives a precise Bearish signal, while Pivot Point HL predicts price changes and potential reversals in the market.
Target - 1.4009
My Stop Loss - 1.4041
About Used Indicators:
On the subsequent day, trading above the pivot point is thought to indicate ongoing bullish sentiment, while trading below the pivot point indicates bearish sentiment.
Disclosure: I am part of Trade Nation's Influencer program and receive a monthly fee for using their TradingView charts in my analysis.
———————————
WISH YOU ALL LUCK

EURNZD LOCAL SHORT|
EURNZD retested a premium supply zone again and we are already seeing a strong rejection, so we are bearish biased and we will be expecting a move down.Time Frame 2H.
SHORT🔥
✅Like and subscribe to never miss a new idea!✅

NZD-USD Free Signal! Buy!
Hello,Traders!
NZDUSD is going down to retest a strong horizontal demand area where a big order block lies, so after the retest a bullish rebound is to be expected!
--------------------
Stop Loss: 0.5606
Take Profit: 0.5639
Entry: 0.5620
Time Frame: 5H
--------------------
Buy!
Comment and subscribe to help us grow!
Check out other forecasts below too!
Disclosure: I am part of Trade Nation's Influencer program and receive a monthly fee for using their TradingView charts in my analysis.

LINKUSDT: Long Setup on Major Support Retest - Targeting $21!Chainlink (LINK) is entering a critical support zone between $13.00 and $14.00, a level that has previously acted as a strong base for bullish reversals. Price action is showing signs of slowing down its downtrend, and we're now closely watching for stabilization or reversal signals before entering a spot long position.
📌 Entry Zone: $13.00 – $14.00
🎯 Take Profit Targets:
• TP1: $15.50 – $16.50
• TP2: $19.00 – $21.00
🛑 Stop Loss: $12.50

BTC — Original Distribution Still UnfinishedBTC continues to move inside unfinished structure. Risk tone is neutral and overnight flows were thin, leaving the market waiting for direction from today’s U.S. releases. The only event with enough weight to shift risk appetite is the FOMC Minutes later today.
On the chart, BTC has rejected the original bullish distribution gap at 88,804.64 for several sessions. That gap remains unclosed, which signals unfinished architecture rather than trend continuation. Price is still confined within Monday’s range between 91,158 and 95,950, forming a clean mid-range compression. Nothing in this structure confirms resolution yet.
Market Structure Mapping views this compression as a neutral regime: the market is balancing, not trending. The failure to close the distribution zone shows the prior move left imbalance behind, and markets generally rebalance before committing to a new leg. Retail sees “sideways.” Professionals see preparation.
The non-obvious point: this isn’t hesitation; it’s the market restoring balance before revealing intent.
For operators, the approach is straightforward. Let New York volatility clear the noise. Structural clarity only appears once price resolves above 95,950 or below 91,158. Anything before that is positioning, not direction.
— CORE5DAN
Institutional Logic. Modern Technology. Real Freedom.

SILVER Will Go Down From Resistance! Short!
Take a look at our analysis for SILVER.
Time Frame: 1D
Current Trend: Bearish
Sentiment: Overbought (based on 7-period RSI)
Forecast: Bearish
The market is approaching a key horizontal level 5,142.9.
Considering the today's price action, probabilities will be high to see a movement to 4,723.3.
P.S
The term oversold refers to a condition where an asset has traded lower in price and has the potential for a price bounce.
Overbought refers to market scenarios where the instrument is traded considerably higher than its fair value. Overvaluation is caused by market sentiments when there is positive news.
Like and subscribe and comment my ideas if you enjoy them!

EURUSD Will Go Higher! Long!
Please, check our technical outlook for EURUSD.
Time Frame: 9h
Current Trend: Bullish
Sentiment: Oversold (based on 7-period RSI)
Forecast: Bullish
The market is approaching a significant support area 1.158.
The underlined horizontal cluster clearly indicates a highly probable bullish movement with target 1.165 level.
P.S
We determine oversold/overbought condition with RSI indicator.
When it drops below 30 - the market is considered to be oversold.
When it bounces above 70 - the market is considered to be overbought.
Like and subscribe and comment my ideas if you enjoy them!

USDJPY Will Go Down! Sell!
Here is our detailed technical review for USDJPY.
Time Frame: 1D
Current Trend: Bearish
Sentiment: Overbought (based on 7-period RSI)
Forecast: Bearish
The market is on a crucial zone of supply 155.460.
The above-mentioned technicals clearly indicate the dominance of sellers on the market. I recommend shorting the instrument, aiming at 152.862 level.
P.S
Overbought describes a period of time where there has been a significant and consistent upward move in price over a period of time without much pullback.
Like and subscribe and comment my ideas if you enjoy them!

GBPAUD Will Move Lower! Short!
Take a look at our analysis for GBPAUD.
Time Frame: 6h
Current Trend: Bearish
Sentiment: Overbought (based on 7-period RSI)
Forecast: Bearish
The price is testing a key resistance 2.023.
Taking into consideration the current market trend & overbought RSI, chances will be high to see a bearish movement to the downside at least to 2.006 level.
P.S
Please, note that an oversold/overbought condition can last for a long time, and therefore being oversold/overbought doesn't mean a price rally will come soon, or at all.
Like and subscribe and comment my ideas if you enjoy them!

BITCOIN BULLS WILL DOMINATE THE MARKET|LONG
BITCOIN SIGNAL
Trade Direction: long
Entry Level: 91,611.86
Target Level: 109,265.02
Stop Loss: 79,807.17
RISK PROFILE
Risk level: medium
Suggested risk: 1%
Timeframe: 12h
Disclosure: I am part of Trade Nation's Influencer program and receive a monthly fee for using their TradingView charts in my analysis.
✅LIKE AND COMMENT MY IDEAS✅

AUD/CHF BEARS ARE GAINING STRENGTH|SHORT
Hello, Friends!
We are targeting the 0.514 level area with our short trade on AUD/CHF which is based on the fact that the pair is overbought on the BB band scale and is also approaching a resistance line above thus going us a good entry option.
Disclosure: I am part of Trade Nation's Influencer program and receive a monthly fee for using their TradingView charts in my analysis.
✅LIKE AND COMMENT MY IDEAS✅

GBP/CHF BULLISH BIAS RIGHT NOW| LONG
Hello, Friends!
Previous week’s red candle means that for us the GBP/CHF pair is in the downtrend. And the current movement leg was also down but the support line will be hit soon and lower BB band proximity will signal an oversold condition so we will go for a counter-trend long trade with the target being at 1.050.
Disclosure: I am part of Trade Nation's Influencer program and receive a monthly fee for using their TradingView charts in my analysis.
✅LIKE AND COMMENT MY IDEAS✅

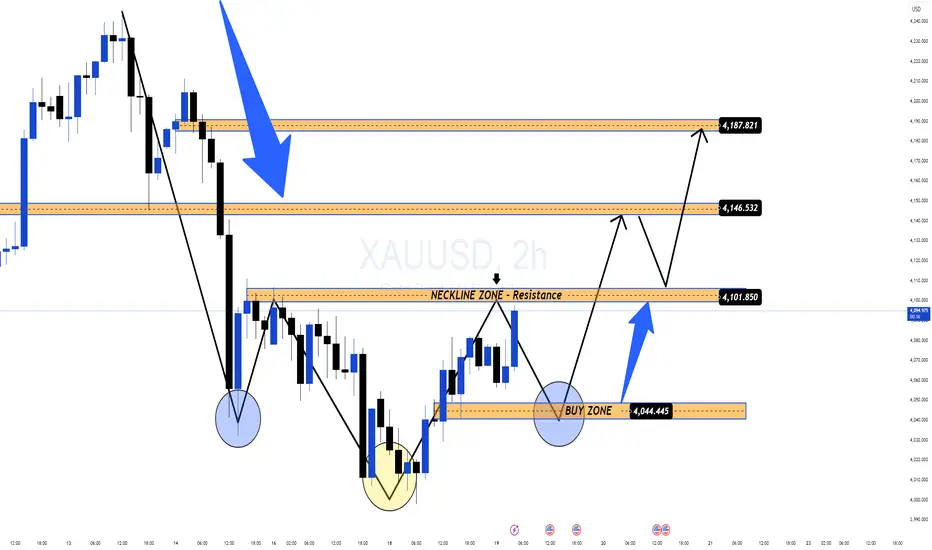
Gold Forms Inverted Head & Shoulders: Reversal Signal!After a short-term corrective decline, the $4,000 level has triggered strong BUY momentum, creating a clear price rebound at the end of yesterday's session. The increase in buying volume indicates that the BUY side is returning to the market after several sessions of being pushed down.
📊 Prominent Technical Structure
On the 2H chart, gold is completing the Inverted Head & Shoulders pattern – one of the strongest bullish reversal patterns.
• Head: liquidity bottom at 4,00x
• Two shoulders: forming symmetrically with good bounce
• Neckline: area 4,101–4,102, currently a key resistance
Price is likely to:
1️⃣ Slightly adjust to the neckline area or BUY ZONE 4,044–4,046
2️⃣ Retest – Accumulate – Confirm breakout
3️⃣ Break out towards 4,146 → 4,187 when the pattern is complete
🎯 Short-term Expectations
Volatility may increase ahead of upcoming economic data, so the reasonable strategy remains:
✅ Prioritize BUY according to the pattern
• Wait for retest of neckline or area 4,044–4,046
• Observe confirmation force (Volume – Momentum – Rejection)
• Target towards 4,146 → 4,187 if the pattern is activated
⚠️ Note
– The reversal trend is only truly confirmed when the price clearly breaks the 4,101–4,102 area.
– Market sentiment currently leans towards recovery, but clear signals are needed before entering large (long-term HOLD) positions.
Gold price analysis November 18XAUUSD continues to be under downward pressure as the sellers have a clear advantage, pulling the price down to the support zone of 3933. The buyers' efforts to hold the price at the trendline are quite weak, indicating that this support structure is at risk of being penetrated and the market may extend its decline to lower areas.
At this point, observing the price reaction at important support levels on the chart is the key factor to find a safe entry point.
Preferred trading scenario:
BUY when the market refuses to fall deeply and there is a clear reversal signal at the zone of 3973 - 3933.
Target: immediate target towards 4104, further extension to 4203.
Risk note: the uptrend will be invalidated if the H4 candle closes below 3933.

SPY & SPX Scenarios — Wednesday, Nov 19, 2025🔮 SPY & SPX Scenarios — Wednesday, Nov 19, 2025 🔮
🌍 Market-Moving Headlines
📉 Manufacturing + housing cluster hits premarket: Philly Fed, Starts, and Permits all drop at 8:30 — a rare combo that can shift the recession narrative quickly.
⚠️ Shutdown-lag still in play: Housing Starts, Building Permits, and the delayed Trade Balance report may not publish due to the Oct 1–Nov 14 shutdown backlog.
📘 FOMC Minutes in the afternoon: Markets focus on cut-timing language, inflation persistence, and financial-conditions assessment.
📊 Key Data & Events (ET)
⏰ 8:30 AM — Philadelphia Fed Manufacturing (Nov)
Forecast: 3.0 vs –12.8 prior
One of the top-tier regional recession indicators.
⏰ 8:30 AM — Housing Starts (Oct)
⏰ 8:30 AM — Building Permits (Oct)
⚠️ Both reports may be delayed due to ongoing data backlog from the federal shutdown.
If released, they move rates, homebuilders, and cyclicals.
⏰ 8:30 AM — U.S. Trade Deficit (Aug, delayed report)
Forecast: –$61.0B vs –$78.3B prior
Lower impact due to being a stale report, but can still nudge GDP tracking.
⏰ 2:00 PM — FOMC Minutes (Oct Meeting)
The day’s biggest confirmed market catalyst.
⚠️ Disclaimer: Educational/informational only — not financial advice.
📌 #SPY #SPX #trading #macro #recession #housing #rates #manufacturing #FOMC #markets #investing

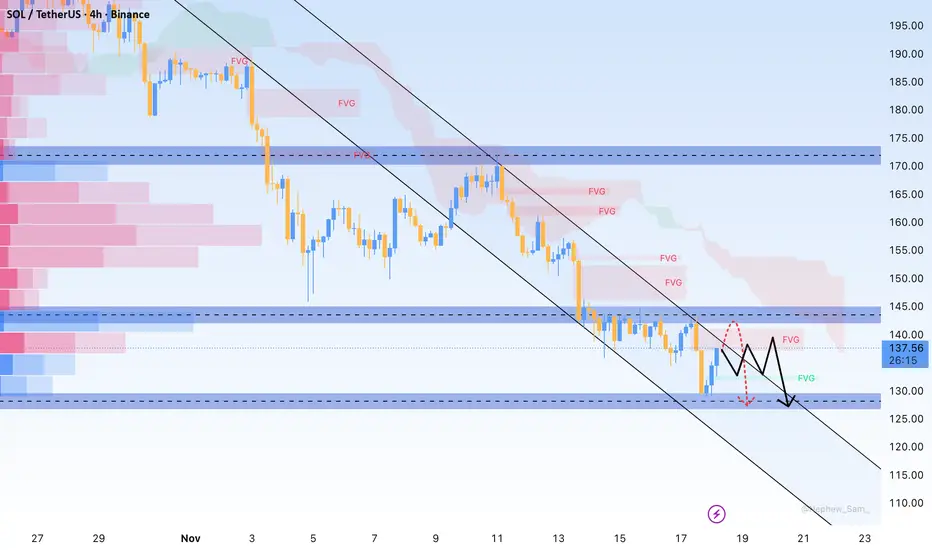
SOL Pulls Back to Key Support Before Its Next Major MoveHello everyone, after a sharp rebound from 132 USD to 137 USD, SOL is now pulling back and trading around the key 135 USD support — a zone that previously triggered a strong bullish reaction. Selling pressure returned as price touched 137 USD, where the red FVG and Ichimoku cloud converge, slowing buyers down. Meanwhile, broader crypto sentiment has softened as the stronger USD and expectations of delayed Fed cuts reduce risk appetite, especially for assets that rallied aggressively like SOL.
With the current market structure, SOL may continue to retreat toward 132–130 USD — an area packed with green FVG and deep liquidity, also the zone where buyers previously stepped in with conviction. A solid reaction here could send SOL back to retest 135–137 USD before choosing its next major direction. But if 130 USD breaks, the downside could extend toward 125 USD.
This is a critical moment to watch price behavior — a clean bounce from 132–130 USD could set the stage for the next recovery leg. Do you think SOL can defend this support?
EUR/USD Eyes Key Support Ahead of Potential BounceHello everyone, looking at EUR/USD on the H4 chart, the pair remains in a natural corrective phase following the rebound from 1.1500. Currently trading around 1.1590, it is close to the Ichimoku cloud and the red FVG zone, indicating that selling pressure dominates upper supply areas. Unable to breach 1.1650–1.1670, the price is gradually sliding toward the 1.1570–1.1550 support area, where buying has been historically strong.
On the news front, the USD has strengthened as market expectations for a December Fed rate cut have fallen. CME FedWatch now shows only a 39.8% chance of a 25bps cut, while the ECB faces weak growth and slowing inflation. This policy divergence naturally puts pressure on the Euro.
Given the current picture, I expect EUR/USD to test 1.1570–1.1550 before potential buying returns. A positive reaction could push the pair back toward 1.1650–1.1670 in the coming sessions.
Do you think this support zone will hold the current pullback?

Gold Extends Its Downward Pressure Amid Clouded MomentumHello everyone, I see gold still holding its downward pace after forming a top around 4,230–4,250 USD/oz, now hovering near 4,030 USD/oz — trading below the Ichimoku cloud and squeezed between several unfilled Fair Value Gaps, signalling that the market may be rebalancing liquidity before choosing a clearer direction. After the strong surge earlier this month, corrective pressure has returned, pushing price toward the short-term support zone at 4,000–3,980 USD/oz — an area that overlaps with previous green FVGs and where buying reactions typically appear. On the upside, 4,070–4,100 USD/oz has turned into a key resistance region where price has repeatedly attempted to break but failed. Only a decisive breakout above this zone would restore the short-term bullish structure; otherwise, losing 3,980 could open the door for further downside.
On the news front, gold continues to face weight from fading expectations of a Fed rate cut next month, a strengthening US dollar, and the return of risk-off sentiment, all of which leave the metal struggling for momentum. The probability of a 25-basis-point cut, according to CME FedWatch, has sharply fallen from 61.9% to 39.8%, while the likelihood of unchanged rates has climbed to 60.2%. This extends the pressure on gold — a non-yielding asset — while the dollar benefits more clearly. The prolonged government shutdown in the US has also delayed key inflation and labour reports for October, leaving the Fed with less evidence to support a firmer forward-guidance message. Meanwhile, Chair Powell’s cautious stance reinforces the view that higher rates will persist for longer, adding further strain to gold.
Based on both technical and macro factors, I feel this could be gold’s final corrective phase before the market finds equilibrium again. I expect price to ease toward 3,990–3,970 USD/oz to “test” liquidity — an area where demand historically returns. If buyers step in as before, gold could rebound toward 4,100–4,150 USD/oz, and once above 4,150, the next target expands toward 4,200–4,250 USD/oz.

SPY Long From Demand Area! Buy!
Hello,Traders!
SPY tapped the higher-timeframe mitigation block after clearing sell-side liquidity, showing a strong bullish response. If displacement continues, price may rally toward the premium target. Time Frame 5H.
Buy!
Comment and subscribe to help us grow!
Check out other forecasts below too!
Disclosure: I am part of Trade Nation's Influencer program and receive a monthly fee for using their TradingView charts in my analysis.

EURJPY FREE SIGNAL|LONG|
✅EURJPY broke cleanly above the key level with strong bullish displacement, confirming a shift in orderflow. A retracement into the breakout zone can offer premium entry before targeting the inefficiency above.
—————————
Entry: 180.071
Stop Loss: 179.785
Take Profit: 180.499
Time Frame: 2H
—————————
LONG🚀
✅Like and subscribe to never miss a new idea!✅

Deposits All Commercial Banks & US DebtWhen a politician and their buddy start spouting nonsense about the US debt spiraling out of control, but then insist that tax cuts are great because they’ll create jobs, and all that money will somehow trickle down to the rest of us, magically boosting tax revenue to "make up" for the lost funds.
Especially when that same politician was re-elected bc inflation & the economy were just so horrible, promising he would come in and save the day bringing prices down again with more tax cuts because they worked so great the first time around.
That's the extreme right. What about the extreme left #MMT?
#MMT is just as bad as MAGAs! They will tell you deficits are great! Deficits add to our savings! Deficits make us all richer! It's accounting, they say! it has to be that way! Except for the little fact that it's not based on empirical evidence.
So the next time some B.S. Artist tells you their little version of a fictional money story, you will know what reality is since 2018. You will have seen this chart with your own eyes and cannot unsee it! No matter what you do, no matter what side you lean politically, it's irrelevant.
Public debt since the tax cuts have grown exponentially, while the private sector deposits have lagged to the point they have stagnated completely since 2021. Barely rising 6%.
Defunding CIA, FBI, USAID, Dept of Education etc.. will do absolutely nothing to make up for all the lost tax revenue since 2018 and the next tax cuts to follow. In fact, when we enter a recession, the deficits will explode even higher as tax revenues collapse and social and economic stabilizers (if there are any left) kick in. Then what?
Don't shoot the messenger!
